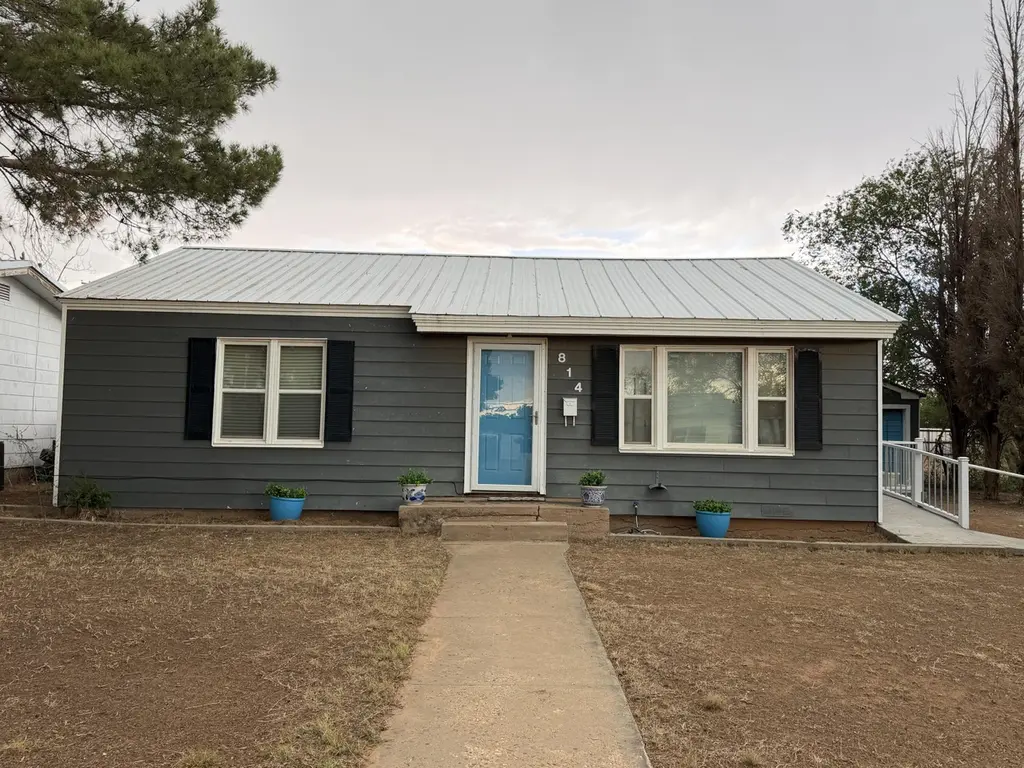
814 W 11th St · Post, TX
Flood risk 1/10 · Minimal
- FEMA flood zone
- —
- Chance of flooding over 30 yrs
- 0.0%
- Est. flood insurance / yr
- —
Fire risk 7/10 · Major
- Est. fire insurance / yr
- $1,222 – $2,270
Heat risk 6/10 · Moderate
- Hot days now (above 102°F)
- 7 days/yr
- Hot days in 30 yrs
- 21 days/yr
Wind risk 2/10 · Minimal
- Chance of severe wind over 30 yrs
- 2.0%
Air-quality risk 1/10 · Minimal
- Unhealthy air days now
- 0 days/yr
- Unhealthy air days in 30 yrs
- 0 days/yr
Risk factors via First Street. Map © Google.
Why this score? — see what drove the D grade
The composite is a weighted blend of 9 inputs, each scored 0–100. Each bar is that input's sub-score; the figure is the points it added to the 100-point composite (weight × sub-score).
- Cash flow +10.7/30.0
- ARV discount +7.5/15.0
- Appreciation +6.1/10.0
- Livability +3.4/5.0
- DSCR +3.1/10.0
- Schools +2.9/10.0
- 1% rule +2.6/10.0
- Rent growth +2.5/5.0
- Condition / age +2.5/5.0
$109,500
🖨 Deal sheet 📄 Offer letter ✓ Due diligence
Listing remarks
Charming, clean, and completely move-in ready. From the moment you step inside, this 2-bedroom, 1-bath home maximizes its 936 square feet to feel bright and remarkably spacious. The heart of the home features an inviting living area that flows into a large kitchen anchored by a center island. As a major bonus, the refrigerator, washer, and dryer all stay with the property. Outside, you will find durable metal roofing, central air, and a newly installed side entry ramp. A standout feature is the detached garage, which includes an extra storage room with incredible potential to become your home office, hobby studio, or man cave. Schedule your tour today.
Key facts
- Metal roofing
- Wood floors
- Central air
Tags
Property features AI
Exterior
- Parking: Drive-through paved parking
- Utilities: Standard municipal utilities (water, sewer, power)
- Home design: Single family residence; Residential property
- Construction: Vinyl siding exterior; Metal roof; Pillar/post/pier foundation; Built on 0.28-acre lot
- Exterior features: Exterior storage; Accessible entrance with ramp
Interior
- Kitchen: Cooktop; Refrigerator; Gas water heater
- Flooring: Wood flooring
- Bathrooms: 1 full bathroom
- Heating & cooling: Central heating; Central air conditioning
- Interior features: Kitchen island; Storage (interior)
- Laundry & utility: Washer and dryer included
Neighborhood map
What this means for you Summary
Snapshot
- This is a 2-bed/1.0-bath single-family listed at $110k.
Deal economics
- At list price, monthly cash flow is $-52 ($-621/yr) — negative.
- To cash-flow at today's rent, offer at most $100k (8.3% below list).
- To meet the 1% rule (rent ≥ 1% of price), the offer needs to be $83k (24.3% below list).
- Recommended offer: $83k (24.3% below list) — sets the bar for 1% rule.
Location & tenants
- Location reads 68/100 on livability (#502 in TX) — a middle-class / working-renter tenant base. Strengths: cost of living A+, health & safety A+, housing A-; Watch: employment C-, crime F, amenities F.
- Post ISD (town): math 34% / reading 33% proficiency, ranked #545 of 826 in TX (top 66%) — families likely to look elsewhere, expect single-tenant / working-renter base with shorter leases.
- Zoned schools: Post El (math 42% / reading 37%, grade F, #1,545 of 4,322 statewide, top 38%, 341 students, 76% FRL); Post Middle (math 22% / reading 27%, grade F, #1,279 of 1,662 statewide, top 78%, 183 students, 66% FRL); Post H S (math 74% / reading 54%, grade B-, #199 of 1,632 statewide, top 14%, 217 students, 61% FRL).
- Market conditions: 22 active listings in the ZIP; 5 units permitted in Garza County in 2024 (0 in 5+ unit buildings).
Forward outlook
- In year one you build about $3k of equity ($757 loan paydown + $2k appreciation (2.2% local appreciation)).
- Garza County population projected at +4% by 2050 — modest demand growth; plan on rents tracking national, not racing it.
- At projected returns (2.2% appreciation + 3.0% rent growth), your $31k cash investment doubles in ~9 years — after that, you're playing with house money.
- By year 10, paydown + projected appreciation supports a ~$31k cash-out refi (75% LTV) — recoverable capital for the next deal without selling this one.
Negotiation context
- Only 12 days on market — expect competitive offers; lowballing is unlikely to land.
Risks & watch-outs
- Climate carrying-cost: major wildfire risk; extreme-heat days projected 7→21/yr by 2055 (HVAC capex compounding) — expect insurance premiums to compound above CPI over the hold.
Questions for the listing agent
- What do current leases actually rent for vs. the listed asking? Can we see a recent rent roll and the last 12 months of T-12 income?
- Built in 1970 — when were the roof, HVAC, electrical panel, plumbing, and water heater last replaced?
- Is there a deadline driving the sale (1031 exchange, divorce, estate, relocation)? That informs how much negotiation room exists.
- Schools are F-rated, which usually means shorter tenancies and higher turnover. Who's the typical renter profile here, and what's been the actual vacancy rate?
- Crime grade is F in this area — have there been break-ins, vandalism, or insurance claims at this property in the last 3 years? What carrier currently insures it and at what premium?
- The area grade is low — what's the realistic commute time and amenity access for the typical tenant pool here? Any planned neighborhood developments (good or bad) we should know about?
- What's the average days-on-market for RENTAL listings here right now (not sales)? A rising rental-DOM trend means longer vacancies and softer asking-rent achievability than the comps imply.
- What's the recent tenant-quality profile in this submarket — average credit score on applications, eviction rate, late-payment / NSF rate, and stable-employment percentage? A property-management company in the area should have these aggregated.
- How much new for-sale + rental construction is in the pipeline within 1–3 miles? Heavy new supply typically softens prices + rents 12–24 months out; constrained supply supports both.
Investment metrics
- 1% rule
- 0.76% ✗
- Cap rate
- 5.73%
- Cash-on-cash
- -2.02%
- DSCR
- 0.91
- GRM
- 11.0
CMA / ARV
No comps found within radius.
Projected returns pro-forma
2.18% appreciation · 3.0% rent growth · sell at horizon
- IRR
- 3.1%
- Equity multiple
- 1.17×
- Total profit
- $5,183
- Equity at exit
- $44,241
- IRR
- 6.8%
- Equity multiple
- 1.95×
- Total profit
- $29,103
- Equity at exit
- $64,526
Cash invested: $30,660 (down + closing). Projections, not guarantees.
Landlord ↔ Tenant lean methodology
- Overall (STATE)
- 87 Strongly Landlord-Friendly
- State Texas
- 87 Strongly Landlord-Friendly · R+5
- County
- — inherits STATE
- City
- — inherits STATE
ZIP-level market 79356
- Home prices YoY
- 2.2%
- Active inventory
- 22
- Price-to-rent
- 11.0×
Monthly cashflow live
- Estimated rent
- $829 medium interval (Pro) →
- Mortgage (P&I)
- −$574
- Tax from tax record
- −$87 /mo · $1,043/yr
- Insurance
- −$46
- HOA
- −$0
- Vacancy / Maint / Mgmt
- −$174
- Net cashflow
- $-52
Break-even live
UW: 25.0% down · 7.5% · 30yr · 1.5% tax · 5.0% vac · 8.0% maint · 8.0% mgmt
Financing live
Cash to close
- Down payment
- $27,375
- Closing costs
- $3,285
- Reserves months
- —
- Total cash needed
- —
Loan-product check · same deal, 3 products live
Conventional
25% down · 7.5% · 30yr
- Down + closing
- —
- Monthly P&I
- —
- Monthly cashflow
- —
- DSCR
- —
- Eligible?
- —
Personal DTI + credit; lowest rate.
DSCR
20% down · 8.5% · 30yr
- Down + closing
- —
- Monthly P&I
- —
- Monthly cashflow
- —
- DSCR
- —
- Eligible?
- —
No personal income docs; deal must DSCR.
Hard money
10% down · 12.0% · 12mo
- Down + closing
- —
- Monthly P&I
- —
- Monthly cashflow
- —
- DSCR
- —
- Eligible?
- —
Short-term bridge; refi at stabilization.
Listing history 13 events
-
2026-06-18days on market $109,500 Active 12 DOM
-
2026-06-17days on market $109,500 Active 11 DOM
-
2026-06-16days on market $109,500 Active 10 DOM
-
2026-06-16remarks 660-char remark
-
2026-06-15days on market $109,500 Active 9 DOM
-
2026-06-15days on market $109,500 Active 8 DOM
-
2026-06-13days on market $109,500 Active 7 DOM
-
2026-06-12days on market $109,500 Active 6 DOM
-
2026-06-09days on market $109,500 Active 3 DOM
-
2026-06-08days on market $109,500 Active 2 DOM
-
2026-06-08price $109,500 Active 1 DOM
-
2026-06-03remarks 633-char remark
-
2026-06-03$115,000 Active 1 DOM
ⓘ Source: listings_history table (triggers on properties + properties_extension) + one-shot
backfill from property_details.listing_events for pre-trigger history.
Tax reassessment forecast TX · Resets to sale price
- Current annual tax
- $1,043 · $87/mo
- Projected year-2 tax
- $2,004 · $167/mo
- Expected delta
- +$960/yr (+$80/mo · 92.0%)
ⓘ Screening estimate from a state-policy table — verify with the county assessor before closing.
Climate risk First Street
- Flood 1/10 Low 0% chance over 30 yrs
- Wildfire 7/10 Severe
- Heat 6/10 Major 7 d/yr ≥102°F today · 21 d/yr by 30 yrs out
- Wind 2/10 Low 2% chance of damaging wind over 30 yrs
- Air quality 1/10 Low 0 unhealthy d/yr today · 0 by 30 yrs out
Nearby sold comps map
Loading sold comps map…
Walkable amenities ~0.75 mi
Loading nearby amenities…
Taxation est. · year 1
- Rental income
- $9,951
- − Mortgage interest
- −$6,134
- − Property taxes
- −$1,043
- − Insurance
- −$548
- − Repairs & maintenance
- −$796
- − Management
- −$796
- − Depreciation
- −$3,185
- Taxable loss
- −$2,552
- Est. tax savings @ 24.0%
- +$612
- After-tax cash flow
- $-8/yr
For passive investors: Depreciation is non-cash, so a rental often shows a tax loss while cash-flowing — sheltering income. Rental losses are passive: they offset passive income freely, and up to $25,000/yr can offset ordinary (W-2) income if you actively participate and your MAGI is under $100k (phasing out to $0 by $150k); unused losses carry forward. On sale, claimed depreciation is recaptured at up to 25%, and gains may owe capital-gains tax (a 1031 exchange can defer both). Figures are a year-1 estimate at your 24.0% rate — not tax advice; consult a CPA.
Schools (NCES district)
- District
- Post ISD
- NCES district ID
- 4835490
- Math proficiency
- 34% ▼ -3.00%
- Reading proficiency
- 33% ▲ 5.00%
- Median HH income
- $46,804
- Composite
- 28.81/100
- National rank
- #6661
- State rank
- #545 of 826 in TX
Livability — Post
- Score
- 68/100
- State rank
- #502
- US rank
- #9963
Category grades
Schools grade is shown separately in the Schools card above.
Census & demographics
- Census place
- Post, TX
- Population (ZIP)
- 5,362
Population outlook (Garza County) Hauer SSP2
- Today (2025)
- 6,497 people
- By 2030
- 6,615 · +1.8%
- By 2040
- 6,551 · +0.8%
- By 2050
- 6,734 · +3.6%
- By 2075
- 6,642 · +2.2%
- By 2100
- 5,430 · -16.4%
Race, ethnicity, and origin ACS 2023
- Neighborhood character
- Diverse neighborhood (Simpson 0.60)
- Race & ethnicity
- Hispanic / Latino 51% White 36% Two or more races 18% Black 10%
- Hispanic origin (detail)
- Mexican 44%
- Common ancestry
- Italian 2% Iranian 1% Slovak 1%
- Foreign-born
- 17% · Canada, China, Jamaica
- Languages at home
- 60% English-only · Spanish 39% Chinese 1%
Political lean MEDSL · Garza
- 2024 margin
- Solid R (+72.6) · D 13.3% · R 85.9%
- 2008→2024 swing
- -16.5pp toward R · 2008: -56.1pp · 2024: -72.6pp
- All cycles
- 2024: R+72.6 2020: R+71.5 2016: R+67.7 2012: R+63.4 2008: R+56.1
Not yet ingested
- Civics
- —
Market trends
- HPI YoY
- ▲ 2.18%
- Current HPI
- 101.9858
- Rent YoY
- —
- Metro
- —
- State GDP YoY
- ▲ 3.95%
- F500 in state
- 110
Industry mix (Fortune 500 HQ in TX)
| Industry | F500 HQs | Revenue |
|---|---|---|
| Energy | 16 | $1,198B |
|
||
| Technology | 5 | $198B |
|
||
| Engineering / Construction | 4 | $72B |
|
||
| Energy Services | 3 | $60B |
|
||
| Utilities | 3 | $41B |
|
||
| Healthcare | 2 | $330B |
|
||
Price history
4 events — show timeline
- 2026-05-31 Listed $115,000 LARMLS
- 2019-09-25 Sold (Public Records) — Public Records
- 2008-06-05 Sold (Public Records) — Public Records
- 2006-09-07 Sold (Public Records) — Public Records
Property tax history
+4.1%/yrLatest (2025): $1,043 · +11.8% YoY. Source: county tax records.
Cash-flow waterfall
monthlySold comps — $/sqft
last 12 mo · ≤1 miLoading sold comps…