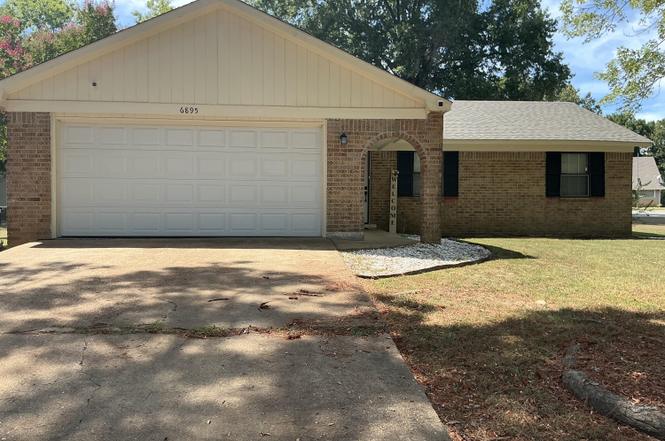
6895 Belle Meade Rd · Horn Lake, MS
Flood risk 1/10 · Minimal
- FEMA flood zone
- X (unshaded)
- Chance of flooding over 30 yrs
- 0.0%
- Est. flood insurance / yr
- $507 – $1,088
Fire risk 3/10 · Minor
- Est. fire insurance / yr
- $1,241 – $2,305
Heat risk 6/10 · Moderate
- Hot days now (above 109°F)
- 7 days/yr
- Hot days in 30 yrs
- 21 days/yr
Wind risk 4/10 · Minor
- Chance of severe wind over 30 yrs
- 18.0%
Air-quality risk 2/10 · Minimal
- Unhealthy air days now
- 2 days/yr
- Unhealthy air days in 30 yrs
- 2 days/yr
Risk factors via First Street. Map © Google.
Why this score? — see what drove the D grade
The composite is a weighted blend of 9 inputs, each scored 0–100. Each bar is that input's sub-score; the figure is the points it added to the 100-point composite (weight × sub-score).
- Cash flow +14.0/30.0
- ARV discount +8.5/15.0
- DSCR +4.2/10.0
- Schools +4.0/10.0
- Livability +3.1/5.0
- 1% rule +2.8/10.0
- Condition / age +2.5/5.0
- Rent growth +2.3/5.0
- Appreciation +0.0/10.0
$215,000
🖨 Deal sheet (PDF) 📄 Offer letter ✓ Due diligence
Listing remarks MLS
Don't miss out on this charming home situated in the heart of Horn Lake. This newly remodeled home features 3 bedroom 1.5 bath (master does have a shower) with a car garage. This spacious home has beautiful water proof laminate floors. Property has new installed roof, freshly painted, new doors and new garage doors.
Key facts
- Spacious yard
- Covered patio
- Granite countertops
Tags
Neighborhood map
What this means for you Summary
Snapshot
- This is a 3-bed/2.0-bath single-family listed at $215k.
Deal economics
- At list price, monthly cash flow is $26 ($312/yr) — positive.
- The deal already cash-flows at list — no discount required.
- To meet the 1% rule (rent ≥ 1% of price), the offer needs to be $168k (21.8% below list).
- Recommended offer: $168k (21.8% below list) — sets the bar for 1% rule.
Location & tenants
- Location reads 61/100 on livability (#196 in MS) — a middle-class / working-renter tenant base. Strengths: cost of living A+, housing A+, crime A; Watch: employment D, amenities F, commute F.
- Desoto County School District (suburban): math 48% / reading 42% proficiency, ranked #20 of 130 in MS (top 15%) — families likely to look elsewhere, expect single-tenant / working-renter base with shorter leases.
- Zoned schools: Shadow Oaks Elementary School (459 students, 99% FRL); Horn Lake Middle School (math 37% / reading 21%, grade F, #90 of 179 statewide, top 52%, 1,021 students, 100% FRL); Horn Lake High (math 28% / reading 30%, grade F, #98 of 197 statewide, top 49%, 1,361 students, 100% FRL) — zoned schools average 100% FRL vs 43% district-wide (56 pts higher); higher-poverty schools than district average — tighter screening recommended.
- Zoned-school proficiency averages 29% at this address vs 45% district-wide (-16 pts) — the specific schools serving this property underperform the Desoto County School District average; the district grade overstates school quality for this exact location.
- Market conditions: Rents soft (-0.7%/yr); 98 active listings in the ZIP; 40 comparable units currently listed for rent nearby; rentals at typical pace (median 23d on market — plan ~3-4 weeks tenant-placement turnaround); 1,155 units permitted in DeSoto County in 2024 (0 in 5+ unit buildings).
- This rent runs 38% of the median local income ($53k/yr) — at the standard rent-burdened threshold; future hikes will face affordability resistance.
Forward outlook
- Local home prices are declining (-3.0%/yr); year-one equity from $1k of loan paydown is wiped out by about $6k of value loss. Plan a longer hold.
- DeSoto County population projected at +33% by 2050 — long-run rental-demand tailwind backs the buy-and-hold thesis.
Negotiation context
- It's been on market 233 days — a 12% lower offer ($189k) is reasonable based on typical stale-listing flexibility.
- 3 sale attempts since 4y ago; this cycle's ask has dropped $25k (10%) from the opening price — seller is motivated, your offer sets the floor, not the list.
Risks & watch-outs
- Climate carrying-cost: extreme-heat days projected 7→21/yr by 2055 (HVAC capex compounding) — expect insurance premiums to compound above CPI over the hold.
Questions for the listing agent
- It's been on market 233 days. Have you received any prior offers? Is the seller open to a 22% concession, seller financing, or rate buy-down credit?
- Why hasn't it sold? Are there any deal-killer items the seller is aware of (foundation, flood, title, zoning, code violations)?
- Is there a deadline driving the sale (1031 exchange, divorce, estate, relocation)? That informs how much negotiation room exists.
- Schools are F-rated, which usually means shorter tenancies and higher turnover. Who's the typical renter profile here, and what's been the actual vacancy rate?
- The area grade is low — what's the realistic commute time and amenity access for the typical tenant pool here? Any planned neighborhood developments (good or bad) we should know about?
- What's the average days-on-market for RENTAL listings here right now (not sales)? A rising rental-DOM trend means longer vacancies and softer asking-rent achievability than the comps imply.
- What's the recent tenant-quality profile in this submarket — average credit score on applications, eviction rate, late-payment / NSF rate, and stable-employment percentage? A property-management company in the area should have these aggregated.
- How much new for-sale + rental construction is in the pipeline within 1–3 miles? Heavy new supply typically softens prices + rents 12–24 months out; constrained supply supports both.
Investment metrics
- 1% rule
- 0.78% ✗
- Cap rate
- 6.44%
- Cash-on-cash
- 0.52%
- DSCR
- 1.02
- GRM
- 10.7
CMA / ARV
- ARV (on-the-fly)
- $219,762
- Comps found
- 12
Show comp detail 12 sales within ~0.75 mi
| Address | Dist | Beds/Ba | Sqft | Sold | Price | $/sf | Match |
|---|---|---|---|---|---|---|---|
| 6795 Dunbarton Dr | 0.18mi | 3/2.0 | 1,260 (-0%) | 4mo | $208,000 | $165 | 88 |
| 3810 Union Ave | 0.27mi | 3/2.0 | 1,308 (+4%) | 2mo | $235,000 | $180 | 80 |
| 3405 Woodbine Cv | 0.35mi | 3/2.0 | 1,246 (-1%) | 4mo | $194,900 | $156 | 78 |
| 6570 Westbury Ave | 0.36mi | 3/2.0 | 1,320 (+4%) | 0mo | $200,000 | $152 | 75 |
| 3410 Dorchester Cv | 0.35mi | 3/2.0 | 1,351 (+7%) | 1mo | $95,500 | $71 | 71 |
| 4194 Blackstone Dr | 0.59mi | 3/2.0 | 1,301 (+3%) | 1mo | $199,900 | $154 | 67 |
| 6395 Kensington Rd | 0.53mi | 3/2.0 | 1,322 (+5%) | 1mo | $242,000 | $183 | 67 |
| 3783 Conrail Cir | 0.36mi | 3/2.0 | 1,377 (+9%) | 2mo | $240,000 | $174 | 66 |
| 3350 W Tulane Rd | 0.53mi | 3/2.0 | 1,357 (+7%) | 4mo | $175,000 | $129 | 59 |
| 6325 Collinwood Rd | 0.63mi | 3/2.0 | 1,162 (-8%) | 2mo | $202,000 | $174 | 56 |
| 6701 Tulane Rd | 0.68mi | 4/2.0 (+1) | 1,236 (-2%) | 6mo | $219,000 | $177 | 54 |
| 3430 Mayfair Dr | 0.63mi | 3/2.0 | 1,089 (-14%) | 3mo | $204,900 | $188 | 45 |
Match score weights: distance 35% · size 25% · config 20% · recency 20%. Top-matched comps best support the ARV.
Projected returns pro-forma
-3.0% appreciation · 0.0% rent growth · sell at horizon
- IRR
- -18.5%
- Equity multiple
- 0.37×
- Total profit
- $-38,196
- Equity at exit
- $32,057
- IRR
- -17.4%
- Equity multiple
- 0.16×
- Total profit
- $-50,521
- Equity at exit
- $18,589
Cash invested: $60,200 (down + closing). Projections, not guarantees.
Landlord ↔ Tenant lean methodology
- Overall (STATE)
- 90 Strongly Landlord-Friendly
- State Mississippi
- 90 Strongly Landlord-Friendly · R+11
- County
- — inherits STATE
- City
- — inherits STATE
ZIP-level market 38637
- Home prices YoY
- -13.4%
- Rents YoY
- -0.7%
- Active inventory
- 98
- Price-to-rent
- 10.7×
Monthly cashflow live
- Estimated rent
- $1,681 high interval (Pro) →
- Mortgage (P&I)
- −$1,127
- Tax from tax record
- −$85 /mo · $1,018/yr
- Insurance
- −$90
- HOA
- −$0
- Vacancy / Maint / Mgmt
- −$353
- Net cashflow
- $26
Break-even live
Sensitivity live
| Price | -10% $148 | -5% $87 | +0% $26 | +5% $-35 | +10% $-96 |
|---|---|---|---|---|---|
| Rent | -10% $-107 | -5% $-40 | +0% $26 | +5% $92 | +10% $159 |
| Rate | -1.0pp $134 | -0.5pp $81 | base $26 | +0.5pp $-30 | +1.0pp $-86 |
UW: 25.0% down · 7.5% · 30yr · 1.5% tax · 5.0% vac · 8.0% maint · 8.0% mgmt
Financing live
Cash to close
- Down payment
- $53,750
- Closing costs
- $6,450
- Reserves months
- —
- Total cash needed
- —
Loan-product check · same deal, 3 products live
Conventional
25% down · 7.5% · 30yr
- Down + closing
- —
- Monthly P&I
- —
- Monthly cashflow
- —
- DSCR
- —
- Eligible?
- —
Personal DTI + credit; lowest rate.
DSCR
20% down · 8.5% · 30yr
- Down + closing
- —
- Monthly P&I
- —
- Monthly cashflow
- —
- DSCR
- —
- Eligible?
- —
No personal income docs; deal must DSCR.
Hard money
10% down · 12.0% · 12mo
- Down + closing
- —
- Monthly P&I
- —
- Monthly cashflow
- —
- DSCR
- —
- Eligible?
- —
Short-term bridge; refi at stabilization.
Rent comps 40 comps
| Address | Beds | Baths | Sqft | Rent | $/sqft | DOM | Units | Dist |
|---|---|---|---|---|---|---|---|---|
| 3915 Woodland Dr Horn Lake, MS | 3.0 | 2.0 | 1400 | $1,775 | $1.27 | 45d | 1 | 0.22mi |
| 3985 Fernway Dr Horn Lake, MS | 3.0 | 2.0 | 1726 | $1,903 | $1.10 | 45d | 1 | 0.23mi |
| 3914 Santa Fe Loop Horn Lake, MS | 3.0 | 3.0 | 1238 | $1,673 | $1.35 | 25d | 1 | 0.30mi |
| 7266 Illinois Central Ave Horn Lake, MS | 3.0 | 3.0 | 1778 | $1,718 | $0.97 | 3d | 1 | 0.33mi |
| 3560 Lakehurst Dr Horn Lake, MS | 4.0 | 2.0 | 1300 | $1,425 | $1.10 | 18d | 1 | 0.36mi |
| 7340 Durango Dr Horn Lake, MS | 3.0 | 2.0 | 1362 | $1,705 | $1.25 | 6d | 1 | 0.42mi |
| 7163 Layne Dr Horn Lake, MS | 3.0 | 2.0 | 1320 | $1,595 | $1.21 | 25d | 1 | 0.42mi |
| 4238 Highgate Dr Horn Lake, MS | 3.0 | 2.0 | 1232 | $1,585 | $1.29 | 45d | 1 | 0.49mi |
| 7080 Benji Ave Horn Lake, MS | 3.0 | 2.0 | 1276 | $1,550 | $1.21 | 45d | 1 | 0.49mi |
| 3437 Laurelwood St Horn Lake, MS | 3.0 | 2.0 | 1200 | $1,480 | $1.23 | 13d | 1 | 0.49mi |
| 6585 Fairwood Cv Horn Lake, MS | 3.0 | 2.0 | 1473 | $1,553 | $1.05 | 25d | 1 | 0.49mi |
| 6455 Walnut Grove Rd Horn Lake, MS | 3.0 | 2.0 | 1178 | $1,600 | $1.36 | 45d | 1 | 0.52mi |
| 3530 Mayfair Dr Horn Lake, MS | 4.0 | 2.0 | 1300 | $1,595 | $1.23 | 16d | 1 | 0.55mi |
| 6445 Collinwood Rd Horn Lake, MS | 3.0 | 2.0 | 1450 | $1,593 | $1.10 | 3d | 1 | 0.56mi |
| 7202 Brenwood Dr Horn Lake, MS | 3.0 | 2.0 | 1490 | $1,705 | $1.14 | 23d | 1 | 0.56mi |
| 6420 Sandhurst Rd Horn Lake, MS | 3.0 | 2.0 | 1101 | $1,623 | $1.47 | 23d | 1 | 0.56mi |
| 4355 Shadow Ridge Dr Horn Lake, MS | 3.0 | 2.0 | 1350 | $1,760 | $1.30 | 6d | 1 | 0.60mi |
| 7341 Lee Ann Dr Horn Lake, MS | 3.0 | 2.0 | 1247 | $1,660 | $1.33 | 3d | 1 | 0.60mi |
| 4174 Highgate Dr Horn Lake, MS | 3.0 | 1.5 | 1197 | $1,495 | $1.25 | 18d | 1 | 0.61mi |
| 6420 Cornwall Rd Horn Lake, MS | 3.0 | 2.0 | 1189 | $1,550 | $1.30 | 16d | 1 | 0.62mi |
| 7101 Tulane Rd N Horn Lake, MS | 2.0–3.0 | 2.0 | 1189 | $1,750 | $1.47 | 3d | 6 | 0.66mi |
| 6290 Sandhurst Rd Horn Lake, MS | 3.0 | 2.0 | 1178 | $1,600 | $1.36 | 6d | 1 | 0.67mi |
| 6270 Jamestown Ave Horn Lake, MS | 3.0 | 2.0 | 1053 | $1,523 | $1.45 | 45d | 1 | 0.68mi |
| 4192 Anderton Blvd Horn Lake, MS | 3.0 | 2.0 | 1100 | $1,575 | $1.43 | 25d | 1 | 0.68mi |
| 4192 Anderton Blvd Horn Lake, MS | 3.0 | 2.0 | 1100 | $1,575 | $1.43 | 16d | 1 | 0.68mi |
| 6620 Tealwood Dr Horn Lake, MS | 3.0 | 2.0 | 1833 | $2,170 | $1.18 | 5d | 1 | 0.72mi |
| 3780 Southbrook Dr Horn Lake, MS | 4.0 | 2.0 | 1444 | $1,550 | $1.07 | 6d | 1 | 0.73mi |
| 6225 Sandhurst Rd Horn Lake, MS | 3.0 | 2.0 | 1200 | $1,395 | $1.16 | 45d | 1 | 0.74mi |
| 7311 Madelyn Cv Horn Lake, MS | 3.0 | 3.0 | 1263 | $1,395 | $1.10 | 23d | 1 | 0.74mi |
| 7311 Madelyn Cv Horn Lake, MS | 3.0 | 3.0 | 1263 | $1,395 | $1.10 | 25d | 1 | 0.74mi |
| 6392 Manchester Dr Horn Lake, MS | 3.0 | 2.0 | 1352 | $1,715 | $1.27 | 3d | 1 | 0.75mi |
| 6420 Forestgate Rd Horn Lake, MS | 3.0 | 2.0 | 1120 | $1,573 | $1.40 | 23d | 1 | 0.77mi |
| 4506 Shadow Hollow Dr Horn Lake, MS | 3.0 | 2.0 | 1300 | $1,645 | $1.27 | 3d | 1 | 0.78mi |
| 3285 Edenshire Ln Horn Lake, MS | 2.0 | 2.0 | 1407 | $1,573 | $1.12 | 25d | 1 | 0.81mi |
| 7063 Foxhall Dr Horn Lake, MS | 3.0 | 2.0 | 1392 | $1,745 | $1.25 | 6d | 1 | 0.82mi |
| 4088 Carroll Dr W Horn Lake, MS | 3.0 | 2.0 | 1614 | $1,815 | $1.12 | 6d | 1 | 0.83mi |
| 7609 Woodshire Dr Horn Lake, MS | 3.0 | 2.0 | 1480 | $1,690 | $1.14 | 45d | 1 | 0.83mi |
| 7066 Foxhall Dr Horn Lake, MS | 3.0 | 2.0 | 998 | $1,395 | $1.40 | 46d | 1 | 0.85mi |
| 6165 Forestgate Rd Horn Lake, MS | 3.0 | 1.5 | 1079 | $1,400 | $1.30 | 45d | 1 | 0.88mi |
| 6475 Forest Glen Dr Horn Lake, MS | 3.0 | 1.5 | 1100 | $1,395 | $1.27 | 45d | 1 | 0.90mi |
Listing history 10 events
-
2026-04-20status Pending
-
2026-03-01status Active
-
2026-02-28historical
-
2025-11-20price $215,000
-
2025-10-22price $228,900
-
2025-08-29$239,900 Active
-
2022-10-20soldstatus Closed 317-char remark
Show marketing remark (317 chars)
Don't miss out on this charming home situated in the heart of Horn Lake. This newly remodeled home features 3 bedroom 1.5 bath (master does have a shower) with a car garage. This spacious home has beautiful water proof laminate floors. Property has new installed roof, freshly painted, new doors and new garage doors.
-
2022-09-28status Pending 317-char remark
Show marketing remark (317 chars)
Don't miss out on this charming home situated in the heart of Horn Lake. This newly remodeled home features 3 bedroom 1.5 bath (master does have a shower) with a car garage. This spacious home has beautiful water proof laminate floors. Property has new installed roof, freshly painted, new doors and new garage doors.
-
2022-09-24$209,900 Active 317-char remark
Show marketing remark (317 chars)
Don't miss out on this charming home situated in the heart of Horn Lake. This newly remodeled home features 3 bedroom 1.5 bath (master does have a shower) with a car garage. This spacious home has beautiful water proof laminate floors. Property has new installed roof, freshly painted, new doors and new garage doors.
-
1998-10-19soldstatus
ⓘ Source: listings_history table (triggers on properties + properties_extension) + one-shot
backfill from property_details.listing_events for pre-trigger history.
Tax reassessment forecast MS · Resets to sale price
- Current annual tax
- $1,018 · $85/mo
- Projected year-2 tax
- $1,699 · $142/mo
- Expected delta
- +$680/yr (+$57/mo · 66.8%)
ⓘ Screening estimate from a state-policy table — verify with the county assessor before closing.
Climate risk First Street
- Flood 1/10 Low FEMA zone X (unshaded) · 0% chance over 30 yrs
- Wildfire 3/10 Moderate
- Heat 6/10 Major 7 d/yr ≥109°F today · 21 d/yr by 30 yrs out
- Wind 4/10 Moderate 18% chance of damaging wind over 30 yrs
- Air quality 2/10 Low 2 unhealthy d/yr today · 2 by 30 yrs out
Nearby sold comps map
Loading sold comps map…
Walkable amenities ~0.75 mi
Loading nearby amenities…
Taxation est. · year 1
- Rental income
- $20,171
- − Mortgage interest
- −$12,043
- − Property taxes
- −$1,018
- − Insurance
- −$1,075
- − Repairs & maintenance
- −$1,614
- − Management
- −$1,614
- − Depreciation
- −$6,255
- Taxable loss
- −$3,447
- Est. tax savings @ 24.0%
- +$827
- After-tax cash flow
- $1,140/yr
For passive investors: Depreciation is non-cash, so a rental often shows a tax loss while cash-flowing — sheltering income. Rental losses are passive: they offset passive income freely, and up to $25,000/yr can offset ordinary (W-2) income if you actively participate and your MAGI is under $100k (phasing out to $0 by $150k); unused losses carry forward. On sale, claimed depreciation is recaptured at up to 25%, and gains may owe capital-gains tax (a 1031 exchange can defer both). Figures are a year-1 estimate at your 24.0% rate — not tax advice; consult a CPA.
Schools (NCES district)
- District
- Desoto County School District
- NCES district ID
- 2801320
- Math proficiency
- 48% ▼ -13.00%
- Reading proficiency
- 42% ▼ -6.00%
- Median HH income
- $59,272
- Composite
- 39.56/100
- National rank
- #3933
- State rank
- #20 of 130 in MS
Livability — Horn Lake
- Score
- 61/100
- State rank
- #196
- US rank
- #17977
Category grades
Schools grade is shown separately in the Schools card above.
Census & demographics
- Census place
- Horn Lake, MS
- County
- DeSoto County · 176,513 people
- City population
- 26,647
- Metro
- Memphis, TN-MS-AR
- Population (ZIP)
- 26,647
- Household income
- $53,311
- Rent vs Own
- Severe rent burden
- 1052.0
Population outlook (DeSoto County) Hauer SSP2
- Today (2025)
- 203,338 people
- By 2030
- 217,692 · +7.1%
- By 2040
- 245,320 · +20.6%
- By 2050
- 270,133 · +32.8%
- By 2075
- 323,341 · +59.0%
- By 2100
- 348,742 · +71.5%
Race, ethnicity, and origin ACS 2023
- Neighborhood character
- Diverse neighborhood (Simpson 0.62)
- Race & ethnicity
- Black 44% White 42% Hispanic / Latino 9% Two or more races 5% Asian 1%
- Hispanic origin (detail)
- Mexican 7%
- Common ancestry
- Slovak 2% Lithuanian 1% Serbian 1%
- Foreign-born
- 7% · Canada
- Languages at home
- 91% English-only · Spanish 8%
Political lean MEDSL · DeSoto
- 2024 margin
- Strong R (+24.1) · D 36.7% · R 60.8% · Other 2.5%
- 2008→2024 swing
- +14.2pp toward D · 2008: -38.2pp · 2024: -24.1pp
- All cycles
- 2024: R+24.1 2020: R+23.9 2016: R+34.8 2012: R+33.5 2008: R+38.2
Not yet ingested
- Civics
- —
Market trends
- HPI YoY
- ▼ -32.08%
- Current HPI
- 206.5542
- Rent YoY
- ▼ -0.66%
- Metro
- Memphis, TN-MS-AR
- State GDP YoY
- —
- F500 in state
- 0
Price history
+2.4% since first listed10 events — show timeline
- 2026-04-20 Pending — MLSU
- 2026-03-01 Relisted — MLSU
- 2026-02-28 Listing Removed — MLSU
- 2025-11-20 Price Changed $215,000 MLSU
- 2025-10-22 Price Changed $228,900 MLSU
- 2025-08-29 Listed $239,900 MLSU
- 2022-10-20 Sold (MLS) — MLSU
- 2022-09-28 Pending — MLSU
- 2022-09-24 Listed $209,900 MLSU
- 1998-10-19 Sold (Public Records) — Public Records
Property tax history
+2.7%/yrLatest (2025): $1,018 · +20.8% YoY. Source: county tax records.
Cash-flow waterfall
monthlySold comps — $/sqft
last 12 mo · ≤1 miLoading sold comps…