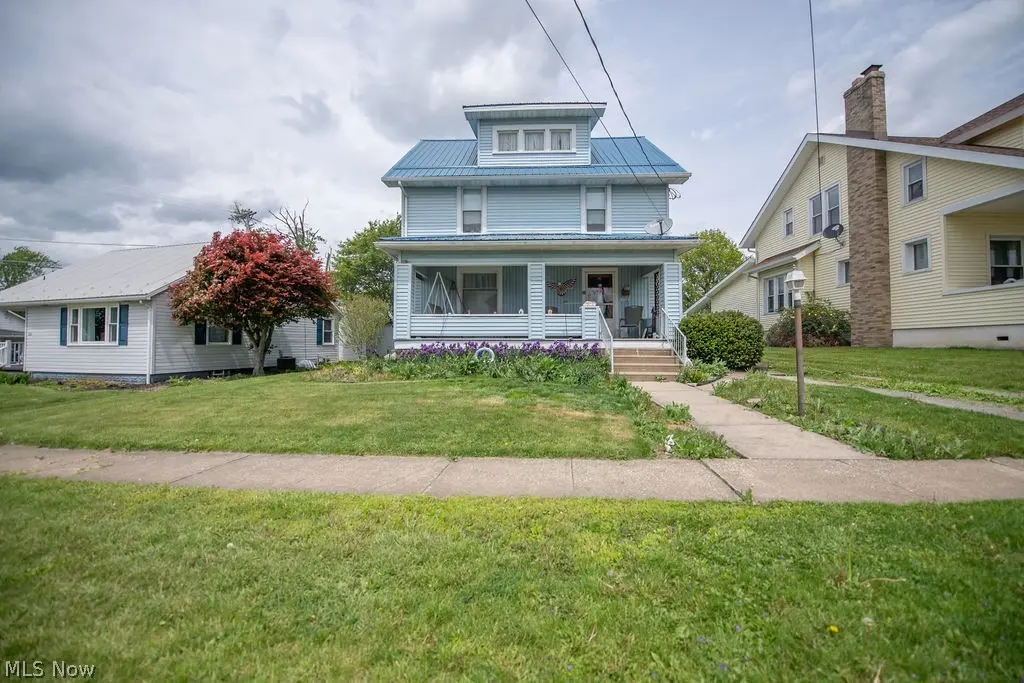
77 4th St NE · Carrollton, OH
Flood risk 1/10 · Minimal
- FEMA flood zone
- X (unshaded)
- Chance of flooding over 30 yrs
- 0.0%
- Est. flood insurance / yr
- $473 – $860
Fire risk 1/10 · Minimal
- Est. fire insurance / yr
- $713 – $1,323
Heat risk 3/10 · Minor
- Hot days now (above 96°F)
- 7 days/yr
- Hot days in 30 yrs
- 18 days/yr
Wind risk 1/10 · Minimal
- Chance of severe wind over 30 yrs
- —
Air-quality risk 2/10 · Minimal
- Unhealthy air days now
- 0 days/yr
- Unhealthy air days in 30 yrs
- 1 days/yr
Risk factors via First Street. Map © Google.
Why this score? — see what drove the C grade
The composite is a weighted blend of 9 inputs, each scored 0–100. Each bar is that input's sub-score; the figure is the points it added to the 100-point composite (weight × sub-score).
- Cash flow +27.2/30.0
- DSCR +9.4/10.0
- 1% rule +6.9/10.0
- Schools +4.4/10.0
- Livability +4.0/5.0
- Rent growth +2.5/5.0
- Condition / age +2.5/5.0
- ARV discount +0.3/15.0
- Appreciation +0.0/10.0
$175,000
🖨 Deal sheet 📄 Offer letter ✓ Due diligence
Listing remarks
Welcome to this charming two story home, complete with a metal roof and a welcoming covered front porch with classic curb appeal. Step inside to beautifully preserved original oak woodwork, custom built-ins, and warm character that carries through the living room into the dining room. The kitchen offers a practical layout with plenty of opportunity to update to your style. Upstairs, you will find spacious bedrooms, each with generous closet space. Full bath featuring a bathtub and a separate shower for added convenience. A walk up third floor provides a large attic space currently used for storage with potential for a finished living space, studio or a quiet retreat. Outside enjoy a landsca
Key facts
- Covered front porch
- Metal roof
- Custom built-ins
Tags
Property features AI
Finance
- HOA & community: Playground in community
Exterior
- Parking: 1-car garage (garage faces rear) with garage door opener; 1-car carport; Driveway
- Utilities: Public water; Public sewer
- Home design: 2-story home; Vinyl siding; Metal roof; Brick/mortar and block foundation
- Construction: Vinyl siding construction; Metal roof; Brick/mortar and block foundation; Built in public-record year (source: public records)
- Exterior features: Front porch; Rear porch; City lot; Flat, level yard; Less than half-acre lot; 50 x 126 lot dimensions; Garage(s) on property
Interior
- Kitchen: Range; Refrigerator; Kitchen island
- Bathrooms: 1 full bathroom; 1 half bathroom; 1 main-level bathroom
- Heating & cooling: Central air conditioning; Forced air heating (gas)
- Interior features: Built-in features; Crown molding; High ceilings; Kitchen island; Laminate counters; Storage; Natural woodwork; Double-pane windows
- Laundry & utility: Laundry in basement
Neighborhood map
What this means for you Summary
Snapshot
- This is a 3-bed/1.5-bath single-family listed at $175k.
Deal economics
- At list price, monthly cash flow is $499 ($6k/yr) — positive.
- The deal already cash-flows at list — no discount required.
- Meets the 1% rule at list price ($2k rent vs $175k).
- Recommended offer: $170k (3.0% below list) — sets the bar for market timing.
- Cap rate 9.7% vs local median 4.7% in Carrollton — top-decile yield for the area; either an underpriced asset or a hidden risk that comps aren't pricing in. Stress-test before assuming the spread holds.
Location & tenants
- Location reads 80/100 on livability (#131 in OH, #1,863 nationally) — a professional / high-income tenant draw. Strengths: crime A+, cost of living A+, housing A+; Watch: amenities F, commute F.
- Carrollton Exempted Village (town): math 46% / reading 58% proficiency, ranked #419 of 656 in OH (top 64%) — acceptable for families but not a draw, mixed tenant base, ~2y average lease.
- Market conditions: 43 active listings in the ZIP; 2 units permitted in Carroll County in 2024 (0 in 5+ unit buildings).
- This rent runs 38% of the median local income ($66k/yr) — at the standard rent-burdened threshold; future hikes will face affordability resistance.
Forward outlook
- Local home prices are declining (-3.0%/yr); year-one equity from $1k of loan paydown is wiped out by about $5k of value loss. Plan a longer hold.
- Carroll County population projected at -25% by 2050 — secular population decline; favor cash flow + early exit over multi-decade hold.
- At projected returns (-3.0% appreciation + 3.0% rent growth), your $49k cash investment doubles in ~10 years — after that, you're playing with house money.
Negotiation context
- It's been on market 42 days — a 3% lower offer ($170k) is reasonable based on typical stale-listing flexibility.
- 2 sale attempts since 23y ago; this cycle's ask has dropped $29k (14%) from the opening price — seller is motivated, your offer sets the floor, not the list.
- Current owner paid $85k; list at $175k implies a 106% gain — meaningful room to come down on a strong offer.
Risks & watch-outs
- Watch-outs: built in 1940 — expect roof / HVAC / electrical / plumbing capex.
Questions for the listing agent
- It's been on market 42 days. Have you received any prior offers? Is the seller open to a 3% concession, seller financing, or rate buy-down credit?
- Built in 1940 — when were the roof, HVAC, electrical panel, plumbing, and water heater last replaced?
- Is there a deadline driving the sale (1031 exchange, divorce, estate, relocation)? That informs how much negotiation room exists.
- Schools are A-rated — typically a magnet for longer-tenancy family renters. What's the average tenant stay here, and is there a school-zone premium baked into asking?
- What's the average days-on-market for RENTAL listings here right now (not sales)? A rising rental-DOM trend means longer vacancies and softer asking-rent achievability than the comps imply.
- What's the recent tenant-quality profile in this submarket — average credit score on applications, eviction rate, late-payment / NSF rate, and stable-employment percentage? A property-management company in the area should have these aggregated.
- How much new for-sale + rental construction is in the pipeline within 1–3 miles? Heavy new supply typically softens prices + rents 12–24 months out; constrained supply supports both.
Investment metrics
- 1% rule
- 1.19% ✓
- Cap rate
- 9.71%
- Cash-on-cash
- 12.21%
- DSCR
- 1.54
- GRM
- 7.0
CMA / ARV
- ARV (median comp)
- $150,871
- List price
- $175,000
- Delta
- 15.99%
- Verdict
- OVERPRICED
- Comps
- 20 within 1.0 mi
Show comp detail 9 sales within ~0.75 mi
| Address | Dist | Beds/Ba | Sqft | Sold | Price | $/sf | Match |
|---|---|---|---|---|---|---|---|
| 260 3rd St NE | 0.19mi | 3/1.5 | 1,565 (-4%) | 22mo | $172,500 | $110 | 66 |
| 360 Garfield Ave NW | 0.33mi | 3/1.0 | 1,705 (+5%) | 10mo | $183,900 | $108 | 66 |
| 335 High St SW | 0.43mi | 3/1.5 | 1,780 (+9%) | 2mo | $169,900 | $95 | 62 |
| 143 5th St NW | 0.13mi | 2/1.0 (-1) | 1,520 (-7%) | 17mo | $135,000 | $89 | 62 |
| 24 4th St SE | 0.48mi | 3/1.5 | 1,766 (+8%) | 4mo | $185,000 | $105 | 60 |
| 294 5th St NW | 0.31mi | 3/1.5 | 1,456 (-11%) | 19mo | $134,900 | $93 | 52 |
| 240 Park Ave SE | 0.38mi | 2/3.0 (-1) | 1,612 (-1%) | 23mo | $179,000 | $111 | 50 |
| 454 Lincoln Ave NW | 0.40mi | 2/3.0 (-1) | 1,784 (+10%) | 11mo | $225,000 | $126 | 45 |
| 357 S High St | 0.46mi | 2/1.0 (-1) | 1,384 (-15%) | 20mo | $116,600 | $84 | 30 |
Match score weights: distance 35% · size 25% · config 20% · recency 20%. Top-matched comps best support the ARV.
Projected returns pro-forma
-3.0% appreciation · 3.0% rent growth · sell at horizon
- IRR
- 1.8%
- Equity multiple
- 1.07×
- Total profit
- $3,386
- Equity at exit
- $26,093
- IRR
- 11.4%
- Equity multiple
- 1.89×
- Total profit
- $43,801
- Equity at exit
- $15,131
Cash invested: $49,000 (down + closing). Projections, not guarantees.
Landlord ↔ Tenant lean methodology
- Overall (STATE)
- 73 Landlord-Friendly
- State Ohio
- 73 Landlord-Friendly · R+6
- County
- — inherits STATE
- City
- — inherits STATE
ZIP-level market 44615
- Active inventory
- 43
- Price-to-rent
- 7.0×
Monthly cashflow live
- Estimated rent
- $2,080 medium interval (Pro) →
- Mortgage (P&I)
- −$918
- Tax from tax record
- −$154 /mo · $1,852/yr
- Insurance
- −$73
- HOA
- −$0
- Vacancy / Maint / Mgmt
- −$437
- Net cashflow
- $499
Break-even live
UW: 25.0% down · 7.5% · 30yr · 1.5% tax · 5.0% vac · 8.0% maint · 8.0% mgmt
Financing live
Cash to close
- Down payment
- $43,750
- Closing costs
- $5,250
- Reserves months
- —
- Total cash needed
- —
Loan-product check · same deal, 3 products live
Conventional
25% down · 7.5% · 30yr
- Down + closing
- —
- Monthly P&I
- —
- Monthly cashflow
- —
- DSCR
- —
- Eligible?
- —
Personal DTI + credit; lowest rate.
DSCR
20% down · 8.5% · 30yr
- Down + closing
- —
- Monthly P&I
- —
- Monthly cashflow
- —
- DSCR
- —
- Eligible?
- —
No personal income docs; deal must DSCR.
Hard money
10% down · 12.0% · 12mo
- Down + closing
- —
- Monthly P&I
- —
- Monthly cashflow
- —
- DSCR
- —
- Eligible?
- —
Short-term bridge; refi at stabilization.
Listing history 20 events
-
2026-06-18days on market $175,000 Active 42 DOM
-
2026-06-17days on market $175,000 Active 41 DOM
-
2026-06-16days on market $175,000 Active 40 DOM
-
2026-06-15days on market $175,000 Active 39 DOM
-
2026-06-13days on market $175,000 Active 37 DOM
-
2026-06-12days on market $175,000 Active 36 DOM
-
2026-06-09days on market $175,000 Active 33 DOM
-
2026-06-09price $175,000 Active 32 DOM
-
2026-06-08days on market $189,900 Active 32 DOM
-
2026-06-07days on market $189,900 Active 31 DOM
-
2026-06-07days on market $189,900 Active 30 DOM
-
2026-06-04days on market $189,900 Active 27 DOM
-
2026-06-02days on market $189,900 Active 26 DOM
-
2026-06-01days on market $189,900 Active 25 DOM
-
2026-05-31days on market $189,900 Active 24 DOM
-
2026-05-18price $189,900 903-char remark
-
2026-05-07$204,499 Active 903-char remark
-
2005-06-08soldstatus $85,000
-
2004-06-30historical
-
2003-01-15$95,500
ⓘ Source: listings_history table (triggers on properties + properties_extension) + one-shot
backfill from property_details.listing_events for pre-trigger history.
Tax reassessment forecast OH · Partial reset (capped growth)
- Current annual tax
- $1,852 · $154/mo
- Projected year-2 tax
- $2,291 · $191/mo
- Expected delta
- +$439/yr (+$37/mo · 23.7%)
ⓘ Screening estimate from a state-policy table — verify with the county assessor before closing.
Climate risk First Street
- Flood 1/10 Low FEMA zone X (unshaded) · 0% chance over 30 yrs
- Wildfire 1/10 Low
- Heat 3/10 Moderate 7 d/yr ≥96°F today · 18 d/yr by 30 yrs out
- Wind 1/10 Low
- Air quality 2/10 Low 0 unhealthy d/yr today · 1 by 30 yrs out
Nearby sold comps map
Loading sold comps map…
Walkable amenities ~0.75 mi
Loading nearby amenities…
Taxation est. · year 1
- Rental income
- $24,965
- − Mortgage interest
- −$9,803
- − Property taxes
- −$1,852
- − Insurance
- −$875
- − Repairs & maintenance
- −$1,997
- − Management
- −$1,997
- − Depreciation
- −$5,091
- Taxable income
- $3,350
- Est. tax owed @ 24.0%
- −$804
- After-tax cash flow
- $5,178/yr
For passive investors: Depreciation is non-cash, so a rental often shows a tax loss while cash-flowing — sheltering income. Rental losses are passive: they offset passive income freely, and up to $25,000/yr can offset ordinary (W-2) income if you actively participate and your MAGI is under $100k (phasing out to $0 by $150k); unused losses carry forward. On sale, claimed depreciation is recaptured at up to 25%, and gains may owe capital-gains tax (a 1031 exchange can defer both). Figures are a year-1 estimate at your 24.0% rate — not tax advice; consult a CPA.
Schools (NCES district)
- District
- Carrollton Exempted Village
- NCES district ID
- 3904527
- Math proficiency
- 46% ▼ -21.00%
- Reading proficiency
- 58% ▼ -10.00%
- Median HH income
- $45,165
- Composite
- 43.94/100
- National rank
- #2903
- State rank
- #419 of 656 in OH
Livability — Carrollton
- Score
- 80/100
- State rank
- #131
- US rank
- #1863
Category grades
Schools grade is shown separately in the Schools card above.
Census & demographics
- Census place
- Carrollton, OH
- County
- Carroll · 27,595 people
- Metro
- Canton-Massillon, OH
- Population (ZIP)
- 9,830
- Household income
- $66,391
- Rent vs Own
- Severe rent burden
- 7.5
Population outlook (Carroll County) Hauer SSP2
- Today (2025)
- 25,766 people
- By 2030
- 24,481 · -5.0%
- By 2040
- 21,803 · -15.4%
- By 2050
- 19,323 · -25.0%
- By 2075
- 15,205 · -41.0%
- By 2100
- 12,287 · -52.3%
Race, ethnicity, and origin ACS 2023
- Neighborhood character
- Predominantly White (96%)
- Race & ethnicity
- White 96% Two or more races 3% Hispanic / Latino 2%
- Common ancestry
- Slovak 4% Iranian 3% Romanian 2%
- Foreign-born
- 0% · Canada
- Languages at home
- 92% English-only · German/W. Germanic 6% Spanish 1% Other Indo-European 1%
Political lean MEDSL · Carroll
- 2024 margin
- Solid R (+54.7) · D 22.2% · R 77.0%
- 2008→2024 swing
- -49.9pp toward R · 2008: -4.8pp · 2024: -54.7pp
- All cycles
- 2024: R+54.7 2020: R+52.7 2016: R+46.4 2012: R+13.7 2008: R+4.8
Not yet ingested
- Civics
- —
Market trends
- HPI YoY
- ▼ -129.95%
- Current HPI
- 222.0728
- Rent YoY
- —
- Metro
- —
- State GDP YoY
- ▲ 1.98%
- F500 in state
- 48
Industry mix (Fortune 500 HQ in OH)
| Industry | F500 HQs | Revenue |
|---|---|---|
| Insurance | 3 | $145B |
|
||
| Industrial Machinery | 3 | $49B |
|
||
| Financial Services | 3 | $24B |
|
||
| Consumer Goods | 2 | $93B |
|
||
| Aerospace / Defense | 2 | $47B |
|
||
| Utilities | 2 | $33B |
|
||
Price history
+83.2% since first listed6 events — show timeline
- 2026-06-08 Price Changed $175,000 MLSNOW
- 2026-05-18 Price Changed $189,900 MLSNOW
- 2026-05-07 Listed $204,499 MLSNOW
- 2005-06-08 Sold (Public Records) $85,000 Public Records
- 2004-06-30 Listing Removed — MLSNOW
- 2003-01-15 Listed $95,500 MLSNOW
Property tax history
+9.8%/yrLatest (2025): $1,852 · +15.9% YoY. Source: county tax records.
Cash-flow waterfall
monthlySold comps — $/sqft
last 12 mo · ≤1 miLoading sold comps…