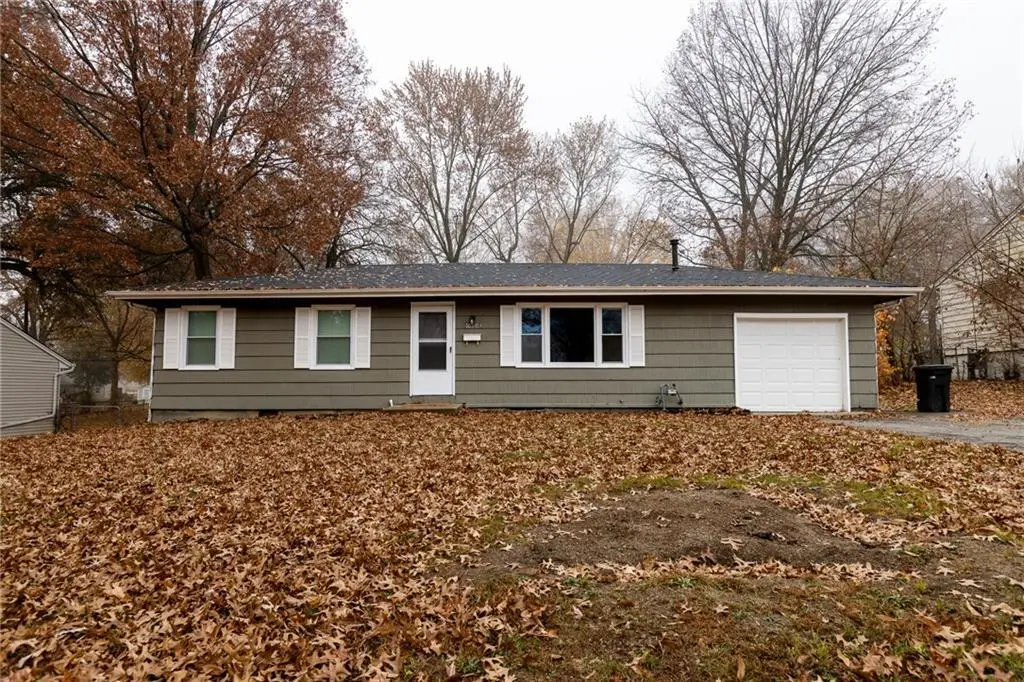
10803 E 60 Ter · Raytown, MO
Flood risk 1/10 · Minimal
- FEMA flood zone
- X (unshaded)
- Chance of flooding over 30 yrs
- 0.0%
- Est. flood insurance / yr
- $473 – $860
Fire risk 1/10 · Minimal
- Est. fire insurance / yr
- $1,054 – $1,958
Heat risk 4/10 · Minor
- Hot days now (above 108°F)
- 7 days/yr
- Hot days in 30 yrs
- 17 days/yr
Wind risk 2/10 · Minimal
- Chance of severe wind over 30 yrs
- —
Air-quality risk 3/10 · Minor
- Unhealthy air days now
- 3 days/yr
- Unhealthy air days in 30 yrs
- 5 days/yr
Risk factors via First Street. Map © Google.
Why this score? — see what drove the D grade
The composite is a weighted blend of 9 inputs, each scored 0–100. Each bar is that input's sub-score; the figure is the points it added to the 100-point composite (weight × sub-score).
- ARV discount +14.6/15.0
- Cash flow +11.7/30.0
- DSCR +3.4/10.0
- Livability +3.2/5.0
- 1% rule +3.1/10.0
- Rent growth +2.8/5.0
- Condition / age +2.5/5.0
- Schools +1.8/10.0
- Appreciation +0.0/10.0
$179,900
🖨 Deal sheet (PDF) 📄 Offer letter ✓ Due diligence
Listing remarks MLS
Charming 3 bedroom, 1 bathroom ranch home offering comfortable one-level living in a convenient Raytown location. Situated on a spacious lot with mature trees, this property provides a peaceful setting with plenty of outdoor space to enjoy. Inside, you’ll find hardwood floors throughout the main living areas and a generously sized living room filled with natural light—perfect for everyday living or entertaining. The layout flows easily into the dining area and kitchen, creating a functional and inviting space. The kitchen offers ample cabinet storage, durable countertops, and a practical layout, along with a breakfast bar for casual dining. Adjacent dining space overlooks the backyard, bringing in great natural light. All three bedrooms are comfortably sized with updated carpeting, offering flexibility for family, guests, or a home office. The full bathroom is clean and functional, ready for your personal touch. Additional features include: Attached 1-car garage Extended driveway for additional parking Large yard with mature trees Quiet, established neighborhood Great opportunity for a first-time buyer, downsizer, or investor looking to add value. Convenient access to highways, shopping, and everyday amenities makes this a smart and accessible location.
Key facts
- One-level living
- Spacious lot
- Hardwood floors
Tags
Neighborhood map
What this means for you Summary
Snapshot
- This is a 3-bed/1.0-bath single-family listed at $180k.
Deal economics
- At list price, monthly cash flow is $-52 ($-625/yr) — negative.
- To cash-flow at today's rent, offer at most $171k (5.1% below list).
- To meet the 1% rule (rent ≥ 1% of price), the offer needs to be $146k (18.9% below list).
- Recommended offer: $146k (18.9% below list) — sets the bar for 1% rule.
Location & tenants
- Location reads 65/100 on livability (#281 in MO) — a middle-class / working-renter tenant base. Strengths: cost of living A+, housing A+, health & safety B+; Watch: crime F, amenities F, commute F.
- Raytown C-2 (suburban): math 12% / reading 28% proficiency, ranked #302 of 324 in MO (top 93%) — low school quality limits family demand, transient renter base, plan for 1-2y turnover.
- Zoned schools: Norfleet Elem. (math 17% / reading 27%, grade F, #910 of 1,115 statewide, top 83%, 311 students, 67% FRL); Raytown Central Middle (math 16% / reading 32%, grade F, #326 of 391 statewide, top 84%, 564 students, 64% FRL); Raytown Sr. High (math 7% / reading 29%, grade F, #482 of 521 statewide, top 92%, 1,365 students, 65% FRL).
- Market conditions: Rents rising (+1.3%/yr); 208 active listings in the ZIP; 11 comparable units currently listed for rent nearby; rentals at typical pace (median 18d on market — plan ~3-4 weeks tenant-placement turnaround); 4,002 units permitted in Jackson County in 2024 (2,271 in 5+ unit buildings).
Forward outlook
- Local home prices are declining (-3.0%/yr); year-one equity from $1k of loan paydown is wiped out by about $5k of value loss. Plan a longer hold.
- Jackson County population projected at +4% by 2050 — modest demand growth; plan on rents tracking national, not racing it.
Negotiation context
- It's been on market 93 days — a 9% lower offer ($164k) is reasonable based on typical stale-listing flexibility.
Risks & watch-outs
- Watch-outs: built in 1954 — expect roof / HVAC / electrical / plumbing capex.
Questions for the listing agent
- What do current leases actually rent for vs. the listed asking? Can we see a recent rent roll and the last 12 months of T-12 income?
- It's been on market 93 days. Have you received any prior offers? Is the seller open to a 19% concession, seller financing, or rate buy-down credit?
- Built in 1954 — when were the roof, HVAC, electrical panel, plumbing, and water heater last replaced?
- Why hasn't it sold? Are there any deal-killer items the seller is aware of (foundation, flood, title, zoning, code violations)?
- Is there a deadline driving the sale (1031 exchange, divorce, estate, relocation)? That informs how much negotiation room exists.
- Schools are D-rated, which usually means shorter tenancies and higher turnover. Who's the typical renter profile here, and what's been the actual vacancy rate?
- Crime grade is F in this area — have there been break-ins, vandalism, or insurance claims at this property in the last 3 years? What carrier currently insures it and at what premium?
- The area grade is low — what's the realistic commute time and amenity access for the typical tenant pool here? Any planned neighborhood developments (good or bad) we should know about?
- What's the average days-on-market for RENTAL listings here right now (not sales)? A rising rental-DOM trend means longer vacancies and softer asking-rent achievability than the comps imply.
- What's the recent tenant-quality profile in this submarket — average credit score on applications, eviction rate, late-payment / NSF rate, and stable-employment percentage? A property-management company in the area should have these aggregated.
- How much new for-sale + rental construction is in the pipeline within 1–3 miles? Heavy new supply typically softens prices + rents 12–24 months out; constrained supply supports both.
Investment metrics
- 1% rule
- 0.81% ✗
- Cap rate
- 5.95%
- Cash-on-cash
- -1.24%
- DSCR
- 0.94
- GRM
- 10.3
CMA / ARV
- ARV (median comp)
- $213,606
- List price
- $179,900
- Delta
- -15.78%
- Verdict
- UNDERPRICED
- Comps
- 20 within 1.0 mi
Show comp detail 12 sales within ~0.75 mi
| Address | Dist | Beds/Ba | Sqft | Sold | Price | $/sf | Match |
|---|---|---|---|---|---|---|---|
| 6121 Willow Ave | 0.24mi | 3/2.0 | 1,276 (-5%) | 3mo | $149,900 | $117 | 74 |
| 6309 Hedges Ave | 0.32mi | 3/2.0 | 1,266 (-5%) | 7mo | $252,500 | $199 | 66 |
| 5725 Blue Ridge Cut Off N/A | 0.43mi | 3/1.0 | 1,406 (+5%) | 9mo | $90,000 | $64 | 64 |
| 9817 E 60th Ter | 0.64mi | 2/1.5 (-1) | 1,341 (+0%) | 2mo | $183,999 | $137 | 61 |
| 5933 Sterling Ave | 0.22mi | 4/2.0 (+1) | 1,496 (+12%) | 3mo | $166,000 | $111 | 58 |
| 6126 Ash Ct | 0.38mi | 2/2.0 (-1) | 1,238 (-8%) | 4mo | $170,000 | $137 | 58 |
| 6110 Willow St | 0.24mi | 3/1.5 | 1,536 (+15%) | 8mo | $179,900 | $117 | 55 |
| 5517 Willow Ave | 0.70mi | 3/2.0 | 1,415 (+6%) | 4mo | $234,000 | $165 | 50 |
| 6339 Harris Ave | 0.38mi | 3/2.0 | 1,520 (+14%) | 9mo | $275,000 | $181 | 48 |
| 10600 E 65th St | 0.50mi | 3/2.5 | 1,508 (+13%) | 3mo | $225,000 | $149 | 47 |
| 5621 Ridgeway Ave | 0.72mi | 3/2.0 | 1,423 (+6%) | 7mo | $225,000 | $158 | 46 |
| 10204 E 56 St | 0.74mi | 2/2.0 (-1) | 1,536 (+15%) | 0mo | $215,000 | $140 | 32 |
Match score weights: distance 35% · size 25% · config 20% · recency 20%. Top-matched comps best support the ARV.
Projected returns pro-forma
-3.0% appreciation · 1.34% rent growth · sell at horizon
- IRR
- -20.2%
- Equity multiple
- 0.31×
- Total profit
- $-34,867
- Equity at exit
- $26,824
- IRR
- -17.1%
- Equity multiple
- 0.12×
- Total profit
- $-44,155
- Equity at exit
- $15,554
Cash invested: $50,372 (down + closing). Projections, not guarantees.
Landlord ↔ Tenant lean methodology
- Overall (STATE)
- 81 Strongly Landlord-Friendly
- State Missouri
- 81 Strongly Landlord-Friendly · R+10
- County
- — inherits STATE
- City
- — inherits STATE
ZIP-level market 64133
- Rents YoY
- 1.3%
- Active inventory
- 208
- Price-to-rent
- 10.3×
Monthly cashflow live
- Estimated rent
- $1,459 high interval (Pro) →
- Mortgage (P&I)
- −$943
- Tax from tax record
- −$187 /mo · $2,240/yr
- Insurance
- −$75
- HOA
- −$0
- Vacancy / Maint / Mgmt
- −$306
- Net cashflow
- $-52
Break-even live
Sensitivity live
| Price | -10% $50 | -5% $-1 | +0% $-52 | +5% $-103 | +10% $-154 |
|---|---|---|---|---|---|
| Rent | -10% $-167 | -5% $-110 | +0% $-52 | +5% $6 | +10% $63 |
| Rate | -1.0pp $39 | -0.5pp $-6 | base $-52 | +0.5pp $-99 | +1.0pp $-146 |
UW: 25.0% down · 7.5% · 30yr · 1.5% tax · 5.0% vac · 8.0% maint · 8.0% mgmt
Financing live
Cash to close
- Down payment
- $44,975
- Closing costs
- $5,397
- Reserves months
- —
- Total cash needed
- —
Loan-product check · same deal, 3 products live
Conventional
25% down · 7.5% · 30yr
- Down + closing
- —
- Monthly P&I
- —
- Monthly cashflow
- —
- DSCR
- —
- Eligible?
- —
Personal DTI + credit; lowest rate.
DSCR
20% down · 8.5% · 30yr
- Down + closing
- —
- Monthly P&I
- —
- Monthly cashflow
- —
- DSCR
- —
- Eligible?
- —
No personal income docs; deal must DSCR.
Hard money
10% down · 12.0% · 12mo
- Down + closing
- —
- Monthly P&I
- —
- Monthly cashflow
- —
- DSCR
- —
- Eligible?
- —
Short-term bridge; refi at stabilization.
Rent comps 11 comps
| Address | Beds | Baths | Sqft | Rent | $/sqft | DOM | Units | Dist |
|---|---|---|---|---|---|---|---|---|
| 10318 E 63rd St Raytown, MO | 1.0–2.0 | 1.0–1.5 | 785 | $1,200 | $1.53 | 25d | 2 | 0.33mi |
| 11121 E 56th Ter Raytown, MO | 2.0 | 1.0 | 1120 | $1,295 | $1.16 | 16d | 1 | 0.56mi |
| 9805 E 61st St Raytown, MO | 1.0–2.0 | 1.0 | 758 | $924 | $1.22 | 4d | 39 | 0.67mi |
| 5517 Willow Ave Raytown, MO | 3.0 | 2.0 | 1415 | $1,850 | $1.31 | 3d | 1 | 0.71mi |
| 9706 E 65th Ter Raytown, MO | 3.0 | 1.0 | 995 | $1,295 | $1.30 | 45d | 1 | 0.89mi |
| 9408 E 68th St Raytown, MO | 2.0 | 1.0 | 1112 | $1,295 | $1.16 | 18d | 1 | 1.23mi |
| 4934 Appleton Ave Kansas City, MO | 3.0 | 2.0 | 1000 | $1,395 | $1.40 | 18d | 1 | 1.29mi |
| 11508 E 51st St Raytown, MO | 3.0 | 1.0 | 1644 | $1,500 | $0.91 | 4d | 1 | 1.29mi |
| 5035 Overton Ave Kansas City, MO | 3.0 | 2.0 | 1323 | $1,795 | $1.36 | 45d | 1 | 1.43mi |
| 6017 Farley Ave Raytown, MO | 2.0 | 2.5 | 1152 | $1,495 | $1.30 | 45d | 1 | 1.46mi |
| 8818 E 58 Ter Raytown, MO | 3.0 | 1.5 | 1700 | $1,897 | $1.12 | 14d | 1 | 1.49mi |
Listing history 19 events
-
2026-06-21days on market $179,900 Active 93 DOM
-
2026-06-18days on market $179,900 Active 90 DOM
-
2026-06-17days on market $179,900 Active 89 DOM
-
2026-06-16days on market $179,900 Active 88 DOM
-
2026-06-15days on market $179,900 Active 87 DOM
-
2026-06-13days on market $179,900 Active 85 DOM
-
2026-06-13days on market $179,900 Active 84 DOM
-
2026-06-09days on market $179,900 Active 81 DOM
-
2026-06-08days on market $179,900 Active 80 DOM
-
2026-06-07remarks 693-char remark
-
2026-06-07pricedays on market $179,900 Active 79 DOM
-
2026-06-03days on market $184,900 Active 75 DOM
-
2026-06-02days on market $184,900 Active 74 DOM
-
2026-06-01days on market $184,900 Active 73 DOM
-
2026-05-31days on market $184,900 Active 72 DOM
-
2026-05-14price $184,900 1292-char remark
Show marketing remark (1292 chars)
Charming 3 bedroom, 1 bathroom ranch home offering comfortable one-level living in a convenient Raytown location. Situated on a spacious lot with mature trees, this property provides a peaceful setting with plenty of outdoor space to enjoy. Inside, you’ll find hardwood floors throughout the main living areas and a generously sized living room filled with natural light—perfect for everyday living or entertaining. The layout flows easily into the dining area and kitchen, creating a functional and inviting space. The kitchen offers ample cabinet storage, durable countertops, and a practical layout, along with a breakfast bar for casual dining. Adjacent dining space overlooks the backyard, bringing in great natural light. All three bedrooms are comfortably sized with updated carpeting, offering flexibility for family, guests, or a home office. The full bathroom is clean and functional, ready for your personal touch. Additional features include: Attached 1-car garage Extended driveway for additional parking Large yard with mature trees Quiet, established neighborhood Great opportunity for a first-time buyer, downsizer, or investor looking to add value. Convenient access to highways, shopping, and everyday amenities makes this a smart and accessible location.
-
2026-03-20$189,900 Active 1292-char remark
Show marketing remark (1292 chars)
Charming 3 bedroom, 1 bathroom ranch home offering comfortable one-level living in a convenient Raytown location. Situated on a spacious lot with mature trees, this property provides a peaceful setting with plenty of outdoor space to enjoy. Inside, you’ll find hardwood floors throughout the main living areas and a generously sized living room filled with natural light—perfect for everyday living or entertaining. The layout flows easily into the dining area and kitchen, creating a functional and inviting space. The kitchen offers ample cabinet storage, durable countertops, and a practical layout, along with a breakfast bar for casual dining. Adjacent dining space overlooks the backyard, bringing in great natural light. All three bedrooms are comfortably sized with updated carpeting, offering flexibility for family, guests, or a home office. The full bathroom is clean and functional, ready for your personal touch. Additional features include: Attached 1-car garage Extended driveway for additional parking Large yard with mature trees Quiet, established neighborhood Great opportunity for a first-time buyer, downsizer, or investor looking to add value. Convenient access to highways, shopping, and everyday amenities makes this a smart and accessible location.
-
1997-07-15soldstatus
-
1985-08-01soldstatus
ⓘ Source: listings_history table (triggers on properties + properties_extension) + one-shot
backfill from property_details.listing_events for pre-trigger history.
Tax reassessment forecast MO · Resets to sale price
- Current annual tax
- $2,240 · $187/mo
- Projected year-2 tax
- $2,240 · $187/mo
- Expected delta
- $0/yr ($0/mo · 0.0%)
ⓘ Screening estimate from a state-policy table — verify with the county assessor before closing.
Climate risk First Street
- Flood 1/10 Low FEMA zone X (unshaded) · 0% chance over 30 yrs
- Wildfire 1/10 Low
- Heat 4/10 Moderate 7 d/yr ≥108°F today · 17 d/yr by 30 yrs out
- Wind 2/10 Low
- Air quality 3/10 Moderate 3 unhealthy d/yr today · 5 by 30 yrs out
Nearby sold comps map
Loading sold comps map…
Walkable amenities ~0.75 mi
Loading nearby amenities…
Taxation est. · year 1
- Rental income
- $17,513
- − Mortgage interest
- −$10,077
- − Property taxes
- −$2,240
- − Insurance
- −$900
- − Repairs & maintenance
- −$1,401
- − Management
- −$1,401
- − Depreciation
- −$5,233
- Taxable loss
- −$3,739
- Est. tax savings @ 24.0%
- +$897
- After-tax cash flow
- $273/yr
For passive investors: Depreciation is non-cash, so a rental often shows a tax loss while cash-flowing — sheltering income. Rental losses are passive: they offset passive income freely, and up to $25,000/yr can offset ordinary (W-2) income if you actively participate and your MAGI is under $100k (phasing out to $0 by $150k); unused losses carry forward. On sale, claimed depreciation is recaptured at up to 25%, and gains may owe capital-gains tax (a 1031 exchange can defer both). Figures are a year-1 estimate at your 24.0% rate — not tax advice; consult a CPA.
Schools (NCES district)
- District
- Raytown C-2
- NCES district ID
- 2926070
- Math proficiency
- 12% ▼ -11.00%
- Reading proficiency
- 28% ▼ -9.00%
- Median HH income
- $47,215
- Composite
- 17.59/100
- National rank
- #9039
- State rank
- #302 of 324 in MO
Livability — Raytown
- Score
- 65/100
- State rank
- #281
- US rank
- #13079
Category grades
Schools grade is shown separately in the Schools card above.
Census & demographics
- Census place
- Raytown, MO
- County
- Jackson County · 687,798 people
- City population
- 60,054
- Metro
- Kansas City, MO-KS
- Population (ZIP)
- 36,249
- Household income
- $67,750
- Rent vs Own
- Severe rent burden
- 1173.0
Population outlook (Jackson County) Hauer SSP2
- Today (2025)
- 719,589 people
- By 2030
- 731,456 · +1.6%
- By 2040
- 746,689 · +3.8%
- By 2050
- 749,289 · +4.1%
- By 2075
- 736,227 · +2.3%
- By 2100
- 668,210 · -7.1%
Race, ethnicity, and origin ACS 2023
- Neighborhood character
- Diverse neighborhood (Simpson 0.64)
- Race & ethnicity
- White 46% Black 37% Hispanic / Latino 12% Two or more races 9%
- Hispanic origin (detail)
- Mexican 10%
- Common ancestry
- Italian 7% Slovak 1% Lithuanian 1%
- Foreign-born
- 5% · Canada
- Languages at home
- 90% English-only · Spanish 7% French/Haitian/Cajun 1%
Political lean MEDSL · Jackson
- 2024 margin
- D (+19.3) · D 58.9% · R 39.5% · Other 1.6%
- 2008→2024 swing
- -6.1pp toward R · 2008: 25.4pp · 2024: 19.3pp
- All cycles
- 2024: D+19.3 2020: D+22.0 2016: D+16.6 2012: D+19.0 2008: D+25.4
Not yet ingested
- Civics
- —
Market trends
- HPI YoY
- ▼ -155.40%
- Current HPI
- 263.6915
- Rent YoY
- ▲ 1.34%
- Metro
- Kansas City, MO-KS
- State GDP YoY
- ▲ 1.84%
- F500 in state
- 20
Industry mix (Fortune 500 HQ in MO)
| Industry | F500 HQs | Revenue |
|---|---|---|
| Healthcare | 1 | $163B |
|
||
| Insurance | 1 | $21B |
|
||
| Industrial Technology | 1 | $17B |
|
||
| Retail | 1 | $16B |
|
||
| Industrial Distribution | 1 | $10B |
|
||
| Utilities | 1 | $9B |
|
||
Price history
-2.6% since first listed4 events — show timeline
- 2026-05-14 Price Changed $184,900 Heartland MLS as Distributed by MLS Grid
- 2026-03-20 Listed $189,900 Heartland MLS as Distributed by MLS Grid
- 1997-07-15 Sold (Public Records) — Public Records
- 1985-08-01 Sold (Public Records) — Public Records
Property tax history
+6.5%/yrLatest (2025): $2,240 · +8.8% YoY. Source: county tax records.
Cash-flow waterfall
monthlySold comps — $/sqft
last 12 mo · ≤1 miLoading sold comps…