 🏗️ New Construction
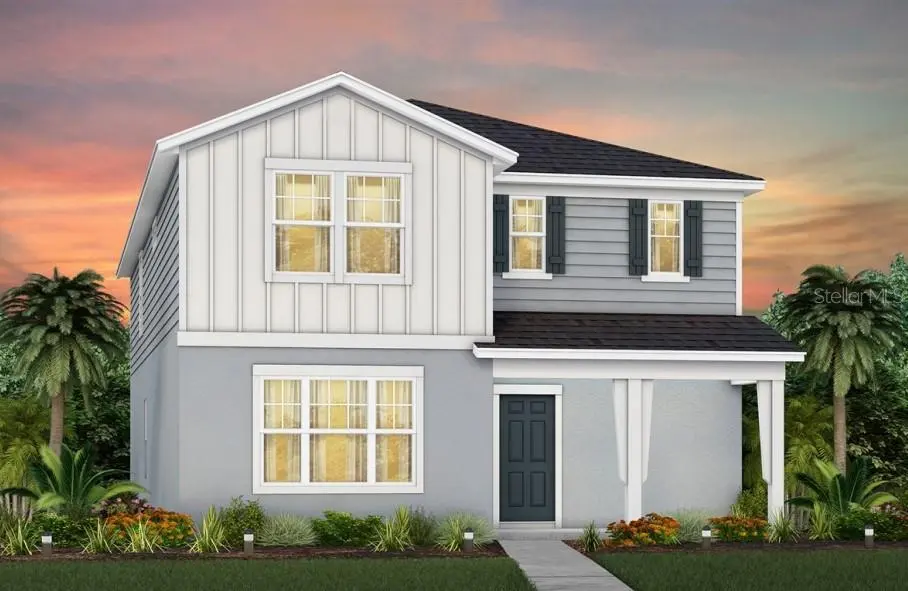
5069 Starling Bird Ln · St. Cloud, FL
Flood risk No data
- FEMA flood zone
- —
- Chance of flooding over 30 yrs
- —
- Est. flood insurance / yr
- —
Fire risk No data
- Est. fire insurance / yr
- —
Heat risk No data
- Hot days now (above threshold)
- —
- Hot days in 30 yrs
- —
Wind risk No data
- Chance of severe wind over 30 yrs
- —
Air-quality risk No data
- Unhealthy air days now
- —
- Unhealthy air days in 30 yrs
- —
Risk factors via First Street. Map © Google.
Why this score? — see what drove the F grade
The composite is a weighted blend of 9 inputs, each scored 0–100. Each bar is that input's sub-score; the figure is the points it added to the 100-point composite (weight × sub-score).
- Cash flow +9.2/30.0
- ARV discount +7.5/15.0
- Schools +3.6/10.0
- Rent growth +3.3/5.0
- DSCR +2.6/10.0
- Livability +2.5/5.0
- Condition / age +2.5/5.0
- 1% rule +1.8/10.0
- Appreciation +0.0/10.0
$427,990
🖨 Deal sheet (PDF) 📄 Offer letter ✓ Due diligence
Listing remarks MLS
Beautiful 5 Bedroom, 3 Bathroom Talbot Bungalow Home Complete with a Front Porch, a Covered Lanai, White Cabinetry, Quartz Countertops, Tile Backsplash, Refrigerator, Washer, Dryer, and Blinds
Key facts
- Large loft area
- Expansive kitchen
- Covered lanai
Tags
Property features AI
Finance
- Other: Home warranty available; Builder license: CGC1516628; Lot approximately 0.1 acre (40x110)
- Financial info: Lease restrictions apply
- HOA & community: HOA required (The Landing's at Live Oak Homeowner's Association); Monthly HOA fee $115; HOA covers cable TV, pool, internet, recreational facilities, trash; Community amenities: pool, playground, recreation facilities, trails, community mailbox, street lights; Pets allowed
Exterior
- Parking: Attached 2-car garage (20x20); Driveway; Garage door opener; Garage faces rear
- Security: Smoke detector(s)
- Utilities: Public water; Public sewer; Electricity connected; Cable connected; Internet available; Underground utilities; Water connected; Sewer connected
- Home design: Single family residence; Two stories; Under construction (projected completion June 2, 2026); North-facing
- Construction: Block and stucco construction; Shingle roof; Slab foundation; New construction by Pulte Homes (model: Talbot)
- Exterior features: Covered rear porch; Lighting; Sidewalk; Sliding doors; Irrigation equipment; Drip irrigation / reclaimed water irrigation; Cleared and landscaped lot; Florida-friendly/native landscaping; Paved public road access
Interior
- Kitchen: Dishwasher; Disposal; Microwave; Range; Refrigerator; Stone countertops
- Bedrooms: 5 bedrooms
- Flooring: Carpet; Tile
- Bathrooms: 3 full bathrooms
- Heating & cooling: Central heating and cooling; Electric heat pump; Central air
- Interior features: Eat-in kitchen; Living room/dining room combo; Open floorplan; Pest guard system; Split bedroom plan; Stone counters; Thermostat; Walk-in closets; Blinds; Double pane and insulated windows; Loft; Home has smoke detectors
- Laundry & utility: Laundry room on upper level; Washer; Dryer; Electric water heater
Neighborhood map
What this means for you Summary
Snapshot
- This is a 5-bed/3.0-bath land listed at $428k.
Deal economics
- At list price, monthly cash flow is $-321 ($-4k/yr) — negative.
- To cash-flow at today's rent, offer at most $371k (13.2% below list).
- To meet the 1% rule (rent ≥ 1% of price), the offer needs to be $290k (32.2% below list).
- Recommended offer: $290k (32.2% below list) — sets the bar for 1% rule.
- Cap rate 5.4% vs local median 4.0% in St. Cloud — top-decile yield for the area; either an underpriced asset or a hidden risk that comps aren't pricing in. Stress-test before assuming the spread holds.
Location & tenants
- Location reads: area grade F — affects rentability + tenant quality, not the cash-flow math above.
- Osceola (suburban): math 39% / reading 45% proficiency, ranked #60 of 73 in FL (top 82%) — families likely to look elsewhere, expect single-tenant / working-renter base with shorter leases; 60% free/reduced lunch — lower-income household profile, screen leases tightly.
- Zoned schools: Hickory Tree Elementary School (math 64% / reading 59%, grade B, #634 of 2,144 statewide, top 30%, 795 students, 48% FRL); St. Cloud Middle School (math 52% / reading 50%, grade C, #237 of 571 statewide, top 43%, 1,229 students, 60% FRL); Harmony High School (math 40% / reading 46%, grade F, #255 of 667 statewide, top 39%, 2,822 students, 42% FRL).
- Market conditions: Rents rising (+3.0%/yr); 1396 active listings in the ZIP; 13 comparable units currently listed for rent nearby; rentals leasing fast (median 10d on market — plan ~1-2 weeks tenant-placement turnaround); solid renter incomes; 8,813 units permitted in Osceola County in 2024 (3,072 in 5+ unit buildings).
- This rent runs 36% of the median local income ($97k/yr) — at the standard rent-burdened threshold; future hikes will face affordability resistance.
Forward outlook
- Local home prices are declining (-3.0%/yr); year-one equity from $3k of loan paydown is wiped out by about $13k of value loss. Plan a longer hold.
- Osceola County population projected at +73% by 2050 — long-run rental-demand tailwind backs the buy-and-hold thesis.
Negotiation context
- It's been on market 30 days — a 2% lower offer ($422k) is reasonable based on typical stale-listing flexibility.
- 2 sale attempts with the ask held roughly flat each time — persistent listings suggest the price (not the market) is what's stuck; bring a comps-based counter.
Questions for the listing agent
- What do current leases actually rent for vs. the listed asking? Can we see a recent rent roll and the last 12 months of T-12 income?
- What does the HOA fee cover, when was the last increase, and are there any pending special assessments or reserve-fund shortfalls?
- Is there a deadline driving the sale (1031 exchange, divorce, estate, relocation)? That informs how much negotiation room exists.
- The area grade is low — what's the realistic commute time and amenity access for the typical tenant pool here? Any planned neighborhood developments (good or bad) we should know about?
- What's the average days-on-market for RENTAL listings here right now (not sales)? A rising rental-DOM trend means longer vacancies and softer asking-rent achievability than the comps imply.
- What's the recent tenant-quality profile in this submarket — average credit score on applications, eviction rate, late-payment / NSF rate, and stable-employment percentage? A property-management company in the area should have these aggregated.
- How much new for-sale + rental construction is in the pipeline within 1–3 miles? Heavy new supply typically softens prices + rents 12–24 months out; constrained supply supports both.
Investment metrics
- 1% rule
- 0.68% ✗
- Cap rate
- 5.39%
- Cash-on-cash
- -3.21%
- DSCR
- 0.86
- GRM
- 12.3
CMA / ARV
No comps found within radius.
Projected returns pro-forma
-3.0% appreciation · 3.02% rent growth · sell at horizon
- IRR
- -21.7%
- Equity multiple
- 0.25×
- Total profit
- $-89,890
- Equity at exit
- $63,815
- IRR
- -15.6%
- Equity multiple
- 0.12×
- Total profit
- $-105,022
- Equity at exit
- $37,005
Cash invested: $119,837 (down + closing). Projections, not guarantees.
Landlord ↔ Tenant lean methodology
- Overall (STATE)
- 87 Strongly Landlord-Friendly
- State Florida
- 87 Strongly Landlord-Friendly · R+3
- County
- — inherits STATE
- City
- — inherits STATE
ZIP-level market 34771
- Home prices YoY
- -30.0%
- Rents YoY
- 3.0%
- Active inventory
- 1396
- Price-to-rent
- 12.3×
Monthly cashflow live
- Estimated rent
- $2,901 high interval (Pro) →
- Mortgage (P&I)
- −$2,244
- Tax from tax record
- −$75 /mo · $895/yr
- Insurance
- −$178
- HOA
- −$115
- Vacancy / Maint / Mgmt
- −$609
- Net cashflow
- $-321
Break-even live
Sensitivity live
| Price | -10% $-78 | -5% $-200 | +0% $-321 | +5% $-929 | +10% $-1,077 |
|---|---|---|---|---|---|
| Rent | -10% $-550 | -5% $-435 | +0% $-321 | +5% $-206 | +10% $-92 |
| Rate | -1.0pp $-105 | -0.5pp $-212 | base $-321 | +0.5pp $-432 | +1.0pp $-544 |
UW: 25.0% down · 7.5% · 30yr · 1.5% tax · 5.0% vac · 8.0% maint · 8.0% mgmt
Financing live
Cash to close
- Down payment
- $106,998
- Closing costs
- $12,840
- Reserves months
- —
- Total cash needed
- —
Loan-product check · same deal, 3 products live
Conventional
25% down · 7.5% · 30yr
- Down + closing
- —
- Monthly P&I
- —
- Monthly cashflow
- —
- DSCR
- —
- Eligible?
- —
Personal DTI + credit; lowest rate.
DSCR
20% down · 8.5% · 30yr
- Down + closing
- —
- Monthly P&I
- —
- Monthly cashflow
- —
- DSCR
- —
- Eligible?
- —
No personal income docs; deal must DSCR.
Hard money
10% down · 12.0% · 12mo
- Down + closing
- —
- Monthly P&I
- —
- Monthly cashflow
- —
- DSCR
- —
- Eligible?
- —
Short-term bridge; refi at stabilization.
Rent comps 13 comps
| Address | Beds | Baths | Sqft | Rent | $/sqft | DOM | Units | Dist |
|---|---|---|---|---|---|---|---|---|
| 2099 Tay Wes Dr Saint Cloud, FL | 4.0 | 2.5 | 2203 | $2,600 | $1.18 | 0d | 1 | 0.20mi |
| 2071 Tay Wes Dr Saint Cloud, FL | 5.0 | 3.0 | 2460 | $2,700 | $1.10 | 25d | 1 | 0.20mi |
| 5192 Chickadee St Saint Cloud, FL | 4.0 | 3.0 | 2204 | $2,490 | $1.13 | 25d | 1 | 0.38mi |
| 5182 Flycatcher Ct Saint Cloud, FL | 4.0 | 3.0 | 2306 | $2,700 | $1.17 | 25d | 1 | 0.42mi |
| 2286 Nuthatch St Saint Cloud, FL | 4.0 | 3.0 | 2204 | $2,490 | $1.13 | 22d | 1 | 0.43mi |
| 2128 Live Oak Lake Rd Saint Cloud, FL | 4.0 | 2.0 | 2146 | $2,200 | $1.03 | 0d | 1 | 0.50mi |
| 1883 Green Dragon Dr Saint Cloud, FL | 4.0 | 2.0 | 1767 | $2,495 | $1.41 | 0d | 1 | 0.54mi |
| 5133 Foxtail Fern Way Saint Cloud, FL | 5.0 | 3.0 | 2674 | $2,681 | $1.00 | 9d | 1 | 0.63mi |
| 1859 Castleton Dr Saint Cloud, FL | 4.0 | 2.0 | 2064 | $2,490 | $1.21 | 6d | 1 | 0.91mi |
| 1842 Castleton Dr Saint Cloud, FL | 4.0 | 2.0 | 1859 | $2,419 | $1.30 | 5d | 1 | 0.92mi |
| 5314 Amersham Ln Saint Cloud, FL | 4.0 | 3.0 | 2110 | $650 | $0.31 | 5d | 1 | 1.28mi |
| 1742 Chatsworth Cir Saint Cloud, FL | 4.0 | 2.5 | 3342 | $3,000 | $0.90 | 25d | 1 | 1.40mi |
| 5574 Bakewell Pl Saint Cloud, FL | 4.0 | 2.0 | 1957 | $2,350 | $1.20 | 23d | 1 | 1.48mi |
HOA detail
- Monthly dues
- $115 · $1,380/yr
Listing history 17 events
-
2026-06-21days on market $427,990 Active 30 DOM
-
2026-06-18days on market $427,990 Active 27 DOM
-
2026-06-17pricedays on market $427,990 Active 26 DOM
-
2026-06-16days on market $432,990 Active 25 DOM
-
2026-06-15days on market $432,990 Active 24 DOM
-
2026-06-13days on market $432,990 Active 22 DOM
-
2026-06-13days on market $432,990 Active 21 DOM
-
2026-06-09days on market $432,990 Active 18 DOM
-
2026-06-08days on market $432,990 Active 17 DOM
-
2026-06-07days on market $432,990 Active 16 DOM
-
2026-06-04pricedays on market $432,990 Active 13 DOM
-
2026-06-03days on market $442,990 Active 12 DOM
-
2026-06-02days on market $442,990 Active 11 DOM
-
2026-06-01days on market $442,990 Active 10 DOM
-
2026-05-31days on market $442,990 Active 9 DOM
-
2026-05-22$442,990 Active
-
2026-05-09$442,990 Active 192-char remark
Show marketing remark (192 chars)
Beautiful 5 Bedroom, 3 Bathroom Talbot Bungalow Home Complete with a Front Porch, a Covered Lanai, White Cabinetry, Quartz Countertops, Tile Backsplash, Refrigerator, Washer, Dryer, and Blinds
ⓘ Source: listings_history table (triggers on properties + properties_extension) + one-shot
backfill from property_details.listing_events for pre-trigger history.
Tax reassessment forecast FL · Resets to sale price
- Current annual tax
- $895 · $75/mo
- Projected year-2 tax
- $3,552 · $296/mo
- Expected delta
- +$2,657/yr (+$221/mo · 296.9%)
ⓘ Screening estimate from a state-policy table — verify with the county assessor before closing.
Nearby sold comps map
Loading sold comps map…
Walkable amenities ~0.75 mi
Loading nearby amenities…
Taxation est. · year 1
- Rental income
- $34,809
- − Mortgage interest
- −$23,974
- − Property taxes
- −$895
- − Insurance
- −$2,140
- − Repairs & maintenance
- −$2,785
- − Management
- −$2,785
- − HOA
- −$1,380
- − Depreciation
- −$12,451
- Taxable loss
- −$11,600
- Est. tax savings @ 24.0%
- +$2,784
- After-tax cash flow
- $-1,065/yr
For passive investors: Depreciation is non-cash, so a rental often shows a tax loss while cash-flowing — sheltering income. Rental losses are passive: they offset passive income freely, and up to $25,000/yr can offset ordinary (W-2) income if you actively participate and your MAGI is under $100k (phasing out to $0 by $150k); unused losses carry forward. On sale, claimed depreciation is recaptured at up to 25%, and gains may owe capital-gains tax (a 1031 exchange can defer both). Figures are a year-1 estimate at your 24.0% rate — not tax advice; consult a CPA.
Schools (NCES district)
- District
- Osceola
- NCES district ID
- 1201470
- Math proficiency
- 39% ▼ -9.00%
- Reading proficiency
- 45% ▼ -4.00%
- Median HH income
- $45,528
- Composite
- 35.7/100
- National rank
- #4865
- State rank
- #60 of 73 in FL
Livability — St. Cloud
No livability data for this city. (Only ~50 U.S. cities are tracked.)
Census & demographics
- Census place
- St. Cloud, FL
- County
- Osceola County · 410,217 people
- City population
- 29,247
- Metro
- Orlando-Kissimmee-Sanford, FL
- Population (ZIP)
- 35,257
- Household income
- $97,415
- Rent vs Own
- Severe rent burden
- 338.0
Population outlook (Osceola County) Hauer SSP2
- Today (2025)
- 447,624 people
- By 2030
- 511,823 · +14.3%
- By 2040
- 642,986 · +43.6%
- By 2050
- 774,552 · +73.0%
- By 2075
- 1,078,144 · +140.9%
- By 2100
- 1,269,660 · +183.6%
Race, ethnicity, and origin ACS 2023
- Neighborhood character
- Diverse neighborhood (Simpson 0.62)
- Race & ethnicity
- White 45% Hispanic / Latino 41% Two or more races 20% Black 9% Asian 2%
- Hispanic origin (detail)
- Mexican 3% Puerto Rican 26% Cuban 2% Dominican 4%
- Common ancestry
- Slovak 2% Romanian 2% Lithuanian 1%
- Foreign-born
- 14% · Canada, Jamaica
- Languages at home
- 64% English-only · Spanish 33% Other Indo-European 3%
Political lean MEDSL · Osceola
- 2024 margin
- Toss-up / Even · D 48.7% · R 50.2% · Other 1.1%
- 2008→2024 swing
- -21.2pp toward R · 2008: 19.7pp · 2024: -1.4pp
- All cycles
- 2024: R+1.4 2020: D+13.8 2016: D+25.0 2012: D+24.5 2008: D+19.7
Not yet ingested
- Civics
- —
Market trends
- HPI YoY
- ▼ -124.44%
- Current HPI
- 290.3095
- Rent YoY
- ▲ 3.02%
- Metro
- Orlando-Kissimmee-Sanford, FL
- State GDP YoY
- ▲ 3.28%
- F500 in state
- 36
Industry mix (Fortune 500 HQ in FL)
| Industry | F500 HQs | Revenue |
|---|---|---|
| Industrial Technology | 2 | $29B |
|
||
| Insurance | 2 | $17B |
|
||
| Retail | 1 | $60B |
|
||
| Technology Distribution | 1 | $58B |
|
||
| Homebuilding | 1 | $35B |
|
||
| Technology Manufacturing | 1 | $35B |
|
||
Price history
+0.0% since first listed2 events — show timeline
- 2026-05-22 Listed $442,990 Stellar MLS as Distributed by MLS Grid
- 2026-05-09 Listed $442,990 Zillow
Property tax history
+25.4%/yrLatest (2025): $895 · +25.4% YoY. Source: county tax records.
Cash-flow waterfall
monthlySold comps — $/sqft
last 12 mo · ≤1 miLoading sold comps…