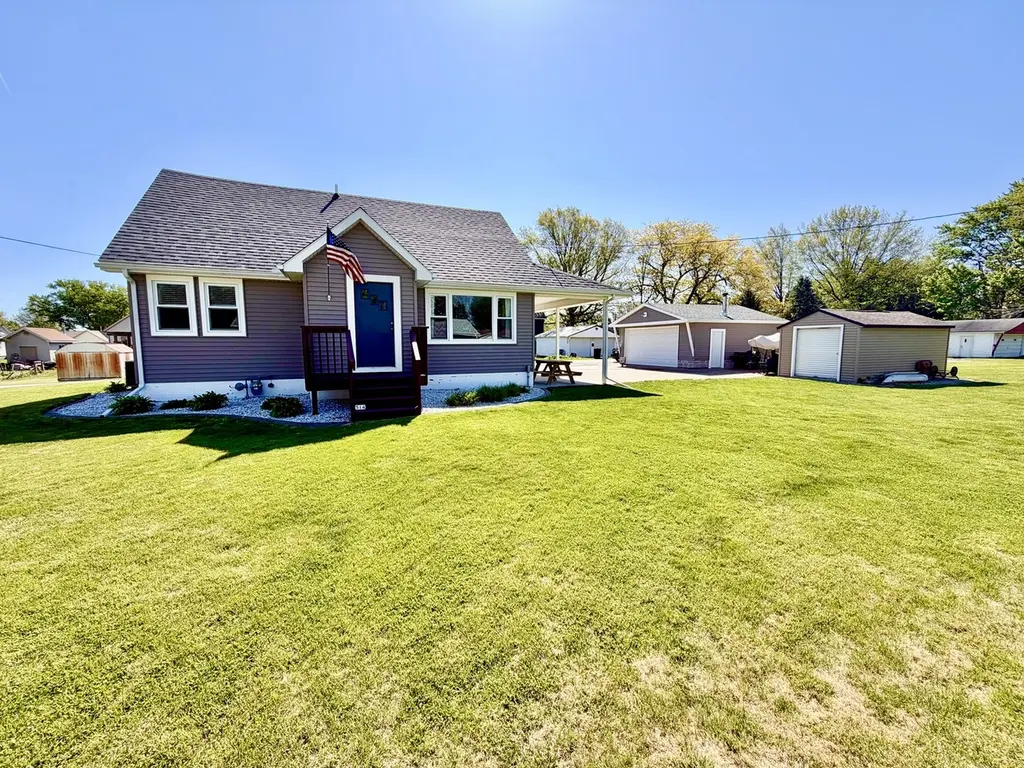
514 N Posey St · Reynolds, IL
Flood risk 1/10 · Minimal
- FEMA flood zone
- X (unshaded)
- Chance of flooding over 30 yrs
- 0.0%
- Est. flood insurance / yr
- $507 – $1,088
Fire risk 1/10 · Minimal
- Est. fire insurance / yr
- $804 – $1,492
Heat risk 3/10 · Minor
- Hot days now (above 103°F)
- 7 days/yr
- Hot days in 30 yrs
- 16 days/yr
Wind risk 2/10 · Minimal
- Chance of severe wind over 30 yrs
- —
Air-quality risk 2/10 · Minimal
- Unhealthy air days now
- 2 days/yr
- Unhealthy air days in 30 yrs
- 2 days/yr
Risk factors via First Street. Map © Google.
Why this score? — see what drove the F grade
The composite is a weighted blend of 9 inputs, each scored 0–100. Each bar is that input's sub-score; the figure is the points it added to the 100-point composite (weight × sub-score).
- Cash flow +7.5/30.0
- Appreciation +7.3/10.0
- Livability +3.2/5.0
- Rent growth +2.5/5.0
- Schools +2.5/10.0
- Condition / age +2.5/5.0
- 1% rule +2.2/10.0
- DSCR +1.6/10.0
- ARV discount +0.0/15.0
$169,900
🖨 Deal sheet (PDF) 📄 Offer letter ✓ Due diligence
Listing remarks
* Coming Soon! No Showings Until Tuesday, May 5th. * Beautiful 3 Bedroom, 3 Bathroom Home with a 2 Car Garage, Large Shed, Full basement, and relaxing outdoors space to enjoy the seasons! Drive into the peaceful rural town of Reynolds. Tucked away on a quiet street you'll find this true gem of a home. Sit back and relax under your Covered Patio that features ceiling lighting so the fun doesn't have to stop when the sun goes down. Inside you'll be greeted with a spacious living room with a large picture window filling the home with natural light. You will love the kitchen and the Custom Stained Burch Amish Cabinets. The main level also offers 2 Bedrooms and a Full Bathroom. Upstairs you'll
Key facts
- 9,583 sq ft lot
- 2 garage spots
- Built 1950
Property features AI
Finance
- Other: Living area source: assessor; Total finished/unfinshed area reported; School bus service available; Property located in unincorporated area; Lot dimensions approximately 128 x 80 (less than 0.25 acre)
- HOA & community: No master association fee required; Homeowner tax exemption reported
Exterior
- Parking: Detached heated garage; Concrete driveway/parking; Garage owned — 2 garage spaces (2 total parking spaces)
- Security: Invisible fencing
- Utilities: Public water; Public sewer
- Home design: Detached single-family home; 1.5-story design; Fee simple ownership; Built approximately 71–80 years ago; Asphalt roof
- Construction: Vinyl siding; Block foundation
- Exterior features: Patio; Porch; Level lot; Invisible fencing; Street lights and paved streets nearby
Interior
- Kitchen: Custom cabinetry; Pantry; Range; Microwave; Refrigerator
- Bedrooms: Three bedrooms total; Master bedroom on the second floor (17 x 12)
- Flooring: Luxury vinyl flooring in bedrooms, kitchen, living room
- Bathrooms: Three full bathrooms; Basement bathroom(s) present
- Heating & cooling: Forced air heating; Central air conditioning
- Interior features: First-floor bedroom; First-floor full bathroom; Walk-in closet(s); Partially finished full basement; Sink in laundry area; Five total rooms
- Laundry & utility: Washer; Dryer; Laundry sink
Neighborhood map
What this means for you Summary
Snapshot
- This is a 3-bed/3.0-bath single-family listed at $170k.
Deal economics
- At list price, monthly cash flow is $-213 ($-3k/yr) — negative.
- To cash-flow at today's rent, offer at most $132k (22.2% below list).
- To meet the 1% rule (rent ≥ 1% of price), the offer needs to be $123k (27.5% below list).
- Recommended offer: $123k (27.5% below list) — sets the bar for 1% rule.
Location & tenants
- Location reads 65/100 on livability (#660 in IL) — a middle-class / working-renter tenant base. Strengths: employment A+, cost of living A+, housing A+; Watch: amenities F, commute F, health & safety F.
- Rockridge CUSD 300 (rural): math 25% / reading 29% proficiency, ranked #257 of 620 in IL (top 42%) — low school quality limits family demand, transient renter base, plan for 1-2y turnover; only 16% free/reduced lunch — higher-income household profile.
- Zoned schools: Taylor Ridge Elem School (179 students, 0% FRL); Rockridge Jr High School (math 25% / reading 26%, grade F, #322 of 665 statewide, top 49%, 233 students, 0% FRL); Rockridge High School (math 42% / reading 42%, grade F, #76 of 693 statewide, top 12%, 343 students, 0% FRL) — zoned schools average 0% FRL vs 16% district-wide (16 pts lower); this property's tenant base skews higher-income than the district average.
- Market conditions: 4 active listings in the ZIP; 116 units permitted in Rock Island County in 2024 (50 in 5+ unit buildings).
Forward outlook
- In year one you build about $9k of equity ($1k loan paydown + $8k appreciation (4.6% local appreciation)).
- Rock Island County population projected at -12% by 2050 — secular population decline; favor cash flow + early exit over multi-decade hold.
- By year 4, paydown + projected appreciation supports a ~$30k cash-out refi (75% LTV) — recoverable capital for the next deal without selling this one.
Negotiation context
- Only 3 days on market — expect competitive offers; lowballing is unlikely to land.
- Current owner paid $115k; 48% above their basis — modest negotiation headroom, anchor on the comps not their cost.
Risks & watch-outs
- Watch-outs: built in 1950 — expect roof / HVAC / electrical / plumbing capex.
Questions for the listing agent
- What do current leases actually rent for vs. the listed asking? Can we see a recent rent roll and the last 12 months of T-12 income?
- Built in 1950 — when were the roof, HVAC, electrical panel, plumbing, and water heater last replaced?
- Is there a deadline driving the sale (1031 exchange, divorce, estate, relocation)? That informs how much negotiation room exists.
- Schools are D-rated, which usually means shorter tenancies and higher turnover. Who's the typical renter profile here, and what's been the actual vacancy rate?
- The area grade is low — what's the realistic commute time and amenity access for the typical tenant pool here? Any planned neighborhood developments (good or bad) we should know about?
- What's the average days-on-market for RENTAL listings here right now (not sales)? A rising rental-DOM trend means longer vacancies and softer asking-rent achievability than the comps imply.
- What's the recent tenant-quality profile in this submarket — average credit score on applications, eviction rate, late-payment / NSF rate, and stable-employment percentage? A property-management company in the area should have these aggregated.
- How much new for-sale + rental construction is in the pipeline within 1–3 miles? Heavy new supply typically softens prices + rents 12–24 months out; constrained supply supports both.
Investment metrics
- 1% rule
- 0.72% ✗
- Cap rate
- 4.79%
- Cash-on-cash
- -5.38%
- DSCR
- 0.76
- GRM
- 11.5
CMA / ARV
- ARV (on-the-fly)
- $145,200
- Comps found
- 5
Show comp detail 5 sales within ~0.75 mi
| Address | Dist | Beds/Ba | Sqft | Sold | Price | $/sf | Match |
|---|---|---|---|---|---|---|---|
| 507 N Bush St | 0.16mi | 3/1.5 | 1,203 (+0%) | 13mo | $230,000 | $191 | 75 |
| 101 Hartman St | 0.18mi | 3/2.0 | 1,188 (-1%) | 13mo | $146,000 | $123 | 75 |
| 606 W Edgington St | 0.36mi | 3/2.0 | 1,176 (-2%) | 10mo | $133,500 | $114 | 67 |
| 704 W Edgington St | 0.39mi | 3/1.5 | 1,112 (-7%) | 13mo | $135,100 | $121 | 53 |
| 711 W Main St | 0.46mi | 3/1.0 | 1,298 (+8%) | 10mo | $149,500 | $115 | 49 |
Match score weights: distance 35% · size 25% · config 20% · recency 20%. Top-matched comps best support the ARV.
Projected returns pro-forma
4.56% appreciation · 3.0% rent growth · sell at horizon
- IRR
- 7.1%
- Equity multiple
- 1.45×
- Total profit
- $21,340
- Equity at exit
- $91,759
- IRR
- 9.3%
- Equity multiple
- 2.65×
- Total profit
- $78,461
- Equity at exit
- $154,747
Cash invested: $47,572 (down + closing). Projections, not guarantees.
Landlord ↔ Tenant lean methodology
- Overall (STATE)
- 43 Moderately Tenant-Leaning
- State Illinois
- 43 Moderately Tenant-Leaning · D+7
- County
- — inherits STATE
- City
- — inherits STATE
ZIP-level market 61279
- Home prices YoY
- 3.4%
- Active inventory
- 4
- Price-to-rent
- 11.5×
Monthly cashflow live
- Estimated rent
- $1,231 medium interval (Pro) →
- Mortgage (P&I)
- −$891
- Tax from tax record
- −$224 /mo · $2,692/yr
- Insurance
- −$71
- HOA
- −$0
- Vacancy / Maint / Mgmt
- −$259
- Net cashflow
- $-213
Break-even live
Sensitivity live
| Price | -10% $-117 | -5% $-165 | +0% $-213 | +5% $-262 | +10% $-310 |
|---|---|---|---|---|---|
| Rent | -10% $-311 | -5% $-262 | +0% $-213 | +5% $-165 | +10% $-116 |
| Rate | -1.0pp $-128 | -0.5pp $-170 | base $-213 | +0.5pp $-257 | +1.0pp $-302 |
UW: 25.0% down · 7.5% · 30yr · 1.5% tax · 5.0% vac · 8.0% maint · 8.0% mgmt
Financing live
Cash to close
- Down payment
- $42,475
- Closing costs
- $5,097
- Reserves months
- —
- Total cash needed
- —
Loan-product check · same deal, 3 products live
Conventional
25% down · 7.5% · 30yr
- Down + closing
- —
- Monthly P&I
- —
- Monthly cashflow
- —
- DSCR
- —
- Eligible?
- —
Personal DTI + credit; lowest rate.
DSCR
20% down · 8.5% · 30yr
- Down + closing
- —
- Monthly P&I
- —
- Monthly cashflow
- —
- DSCR
- —
- Eligible?
- —
No personal income docs; deal must DSCR.
Hard money
10% down · 12.0% · 12mo
- Down + closing
- —
- Monthly P&I
- —
- Monthly cashflow
- —
- DSCR
- —
- Eligible?
- —
Short-term bridge; refi at stabilization.
Listing history 3 events
-
2026-05-07status Pending
-
2026-05-04$169,900 Active
-
2019-09-03soldstatus $115,000
ⓘ Source: listings_history table (triggers on properties + properties_extension) + one-shot
backfill from property_details.listing_events for pre-trigger history.
Tax reassessment forecast IL · Partial reset (capped growth)
- Current annual tax
- $2,692 · $224/mo
- Projected year-2 tax
- $3,275 · $273/mo
- Expected delta
- +$582/yr (+$49/mo · 21.6%)
ⓘ Screening estimate from a state-policy table — verify with the county assessor before closing.
Climate risk First Street
- Flood 1/10 Low FEMA zone X (unshaded) · 0% chance over 30 yrs
- Wildfire 1/10 Low
- Heat 3/10 Moderate 7 d/yr ≥103°F today · 16 d/yr by 30 yrs out
- Wind 2/10 Low
- Air quality 2/10 Low 2 unhealthy d/yr today · 2 by 30 yrs out
Nearby sold comps map
Loading sold comps map…
Walkable amenities ~0.75 mi
Loading nearby amenities…
Taxation est. · year 1
- Rental income
- $14,775
- − Mortgage interest
- −$9,517
- − Property taxes
- −$2,692
- − Insurance
- −$850
- − Repairs & maintenance
- −$1,182
- − Management
- −$1,182
- − Depreciation
- −$4,943
- Taxable loss
- −$5,591
- Est. tax savings @ 24.0%
- +$1,342
- After-tax cash flow
- $-1,220/yr
For passive investors: Depreciation is non-cash, so a rental often shows a tax loss while cash-flowing — sheltering income. Rental losses are passive: they offset passive income freely, and up to $25,000/yr can offset ordinary (W-2) income if you actively participate and your MAGI is under $100k (phasing out to $0 by $150k); unused losses carry forward. On sale, claimed depreciation is recaptured at up to 25%, and gains may owe capital-gains tax (a 1031 exchange can defer both). Figures are a year-1 estimate at your 24.0% rate — not tax advice; consult a CPA.
Schools (NCES district)
- District
- Rockridge CUSD 300
- NCES district ID
- 1734440
- Math proficiency
- 25% ▼ -3.00%
- Reading proficiency
- 29% ▼ -3.00%
- Median HH income
- $68,124
- Composite
- 25.44/100
- National rank
- #7451
- State rank
- #257 of 620 in IL
Livability — Reynolds
- Score
- 65/100
- State rank
- #660
- US rank
- #13542
Category grades
Schools grade is shown separately in the Schools card above.
Census & demographics
- Census place
- Reynolds, IL
- Population (ZIP)
- 960
Population outlook (Rock Island County) Hauer SSP2
- Today (2025)
- 140,982 people
- By 2030
- 137,705 · -2.3%
- By 2040
- 130,512 · -7.4%
- By 2050
- 123,841 · -12.2%
- By 2075
- 109,851 · -22.1%
- By 2100
- 90,922 · -35.5%
Race, ethnicity, and origin ACS 2023
- Neighborhood character
- Predominantly White (97%)
- Race & ethnicity
- White 97% Two or more races 2%
- Common ancestry
- English 8% Serbian 2% Portuguese 1%
- Foreign-born
- 1% · China, Vietnam
Political lean MEDSL · Rock Island
- 2024 margin
- Lean D (+9.6) · D 53.9% · R 44.4% · Other 1.7%
- 2008→2024 swing
- -15.0pp toward R · 2008: 24.6pp · 2024: 9.6pp
- All cycles
- 2024: D+9.6 2020: D+12.1 2016: D+8.4 2012: D+21.9 2008: D+24.6
Not yet ingested
- Civics
- —
Market trends
- HPI YoY
- ▲ 4.56%
- Current HPI
- 139.5821
- Rent YoY
- —
- Metro
- —
- State GDP YoY
- ▲ 1.59%
- F500 in state
- 60
Industry mix (Fortune 500 HQ in IL)
| Industry | F500 HQs | Revenue |
|---|---|---|
| Insurance | 4 | $201B |
|
||
| Consumer Goods | 4 | $87B |
|
||
| Industrial Machinery | 3 | $64B |
|
||
| Healthcare | 2 | $55B |
|
||
| Retail / Pharmacy | 1 | $148B |
|
||
| Agriculture / Food | 1 | $86B |
|
||
Price history
+47.7% since first listed3 events — show timeline
- 2026-05-07 Pending — MRED as Distributed by MLS Grid
- 2026-05-04 Listed $169,900 MRED as Distributed by MLS Grid
- 2019-09-03 Sold (Public Records) $115,000 Public Records
Property tax history
+4.7%/yrLatest (2024): $2,692 · +8.6% YoY. Source: county tax records.
Cash-flow waterfall
monthlySold comps — $/sqft
last 12 mo · ≤1 miLoading sold comps…