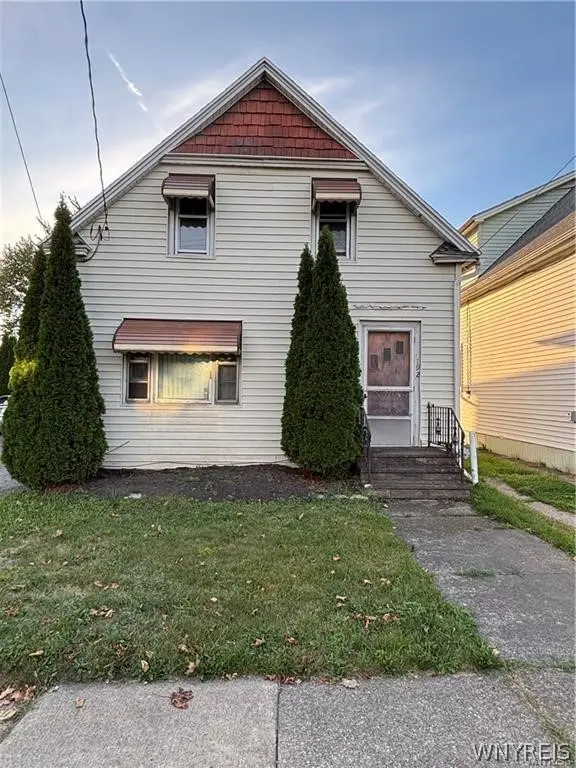
192 Cass Ave · Cheektowaga, NY
Flood risk 1/10 · Minimal
- FEMA flood zone
- X (unshaded)
- Chance of flooding over 30 yrs
- 0.0%
- Est. flood insurance / yr
- $507 – $1,088
Fire risk 1/10 · Minimal
- Est. fire insurance / yr
- $691 – $1,283
Heat risk 3/10 · Minor
- Hot days now (above 92°F)
- 7 days/yr
- Hot days in 30 yrs
- 16 days/yr
Wind risk 1/10 · Minimal
- Chance of severe wind over 30 yrs
- —
Air-quality risk 3/10 · Minor
- Unhealthy air days now
- 2 days/yr
- Unhealthy air days in 30 yrs
- 3 days/yr
Risk factors via First Street. Map © Google.
Why this score? — see what drove the B- grade
The composite is a weighted blend of 9 inputs, each scored 0–100. Each bar is that input's sub-score; the figure is the points it added to the 100-point composite (weight × sub-score).
- Cash flow +23.2/30.0
- 1% rule +9.5/10.0
- Appreciation +9.0/10.0
- ARV discount +7.5/15.0
- DSCR +7.4/10.0
- Livability +4.2/5.0
- Schools +3.0/10.0
- Rent growth +2.5/5.0
- Condition / age +2.5/5.0
$99,900
🖨 Deal sheet 📄 Offer letter ✓ Due diligence
Listing remarks
Welcome to 192 Cass Avenue in Cheektowaga! This two story home has maintenance free vinyl siding with a large 2.5 car wide driveway. The home features 4 beds and a 1 bath, with 2 bedrooms being on the first floor so it can live like a ranch if you wish. A spacious 16x15 kitchen including all appliances with an island and pantry. The living room and dining room have 9 foot ceilings with hardwoods. Upstairs you will find two more bedrooms and a large 20x15 bonus area that could serve as an extra living space. Walk-in attic access for storage. Outside you will find a large fenced in back yard to enjoy the cool fall evenings. Boiler 2019, Gutters 2021.
Key facts
- Large driveway
- Spacious kitchen
- Walk-in attic access
Tags
Neighborhood map
What this means for you Summary
Snapshot
- This is a 3-bed/1.0-bath single-family listed at $100k.
Deal economics
- At list price, monthly cash flow is $180 ($2k/yr) — positive.
- The deal already cash-flows at list — no discount required.
- Meets the 1% rule at list price ($1k rent vs $100k).
- Recommended offer: $98k (1.5% below list) — sets the bar for market timing.
- Cap rate 8.5% vs local median 3.8% in Cheektowaga — top-decile yield for the area; either an underpriced asset or a hidden risk that comps aren't pricing in. Stress-test before assuming the spread holds.
Location & tenants
- Location reads 84/100 on livability (#54 in NY, #811 nationally) — a professional / high-income tenant draw. Strengths: commute A+, housing A+, health & safety A+; Watch: crime C-.
- Cheektowaga-Sloan Union Free School District (urban): math 33% / reading 38% proficiency, ranked #555 of 590 in NY (top 94%) — families likely to look elsewhere, expect single-tenant / working-renter base with shorter leases.
- Market conditions: 169 active listings in the ZIP; 2 comparable units currently listed for rent nearby; 1,244 units permitted in Erie County in 2024 (563 in 5+ unit buildings).
- This rent runs 34% of the median local income ($50k/yr) — at the standard rent-burdened threshold; future hikes will face affordability resistance.
Forward outlook
- In year one you build about $9k of equity ($691 loan paydown + $8k appreciation (8.1% local appreciation)).
- At projected returns (8.1% appreciation + 3.0% rent growth), your $28k cash investment doubles in ~3 years — after that, you're playing with house money.
- By year 4, paydown + projected appreciation supports a ~$30k cash-out refi (75% LTV) — recoverable capital for the next deal without selling this one.
Negotiation context
- It's been on market 17 days — a 2% lower offer ($98k) is reasonable based on typical stale-listing flexibility.
- 3 sale attempts with the ask held roughly flat each time — persistent listings suggest the price (not the market) is what's stuck; bring a comps-based counter.
Risks & watch-outs
- Watch-outs: property tax is 4.8% of price; built in 1915 — expect roof / HVAC / electrical / plumbing capex.
Questions for the listing agent
- Built in 1915 — when were the roof, HVAC, electrical panel, plumbing, and water heater last replaced?
- Property tax is high relative to price — has the assessment been appealed recently, and will the sale trigger a re-assessment?
- Is there a deadline driving the sale (1031 exchange, divorce, estate, relocation)? That informs how much negotiation room exists.
- Schools are B-rated — typically a magnet for longer-tenancy family renters. What's the average tenant stay here, and is there a school-zone premium baked into asking?
- What's the average days-on-market for RENTAL listings here right now (not sales)? A rising rental-DOM trend means longer vacancies and softer asking-rent achievability than the comps imply.
- What's the recent tenant-quality profile in this submarket — average credit score on applications, eviction rate, late-payment / NSF rate, and stable-employment percentage? A property-management company in the area should have these aggregated.
- How much new for-sale + rental construction is in the pipeline within 1–3 miles? Heavy new supply typically softens prices + rents 12–24 months out; constrained supply supports both.
Investment metrics
- 1% rule
- 1.45% ✓
- Cap rate
- 8.46%
- Cash-on-cash
- 7.74%
- DSCR
- 1.34
- GRM
- 5.7
CMA / ARV
- ARV (on-the-fly)
- $249,084
- Comps found
- 12
Show comp detail 12 sales within ~0.75 mi
| Address | Dist | Beds/Ba | Sqft | Sold | Price | $/sf | Match |
|---|---|---|---|---|---|---|---|
| 180 Bright St | 0.12mi | 3/1.0 | 1,222 (-3%) | 4mo | $242,000 | $198 | 86 |
| 29 Frederick St | 0.34mi | 3/1.5 | 1,202 (-4%) | 3mo | $232,500 | $193 | 72 |
| 2302 William St | 0.27mi | 2/1.0 (-1) | 1,208 (-4%) | 5mo | $142,000 | $118 | 72 |
| 108 Crisfield Ave | 0.23mi | 3/1.5 | 1,152 (-8%) | 5mo | $220,000 | $191 | 69 |
| 218 Alaska St | 0.41mi | 3/1.0 | 1,332 (+6%) | 3mo | $165,000 | $124 | 69 |
| 56 Peoria Ave | 0.29mi | 3/2.0 | 1,136 (-10%) | 0mo | $260,000 | $229 | 66 |
| 39 Jane Dr | 0.71mi | 3/1.5 | 1,306 (+4%) | 5mo | $250,000 | $191 | 55 |
| 30 Jane Dr | 0.69mi | 3/2.0 | 1,320 (+5%) | 2mo | $255,000 | $193 | 54 |
| 83 Patricia Ln | 0.62mi | 3/1.0 | 1,120 (-11%) | 1mo | $265,000 | $237 | 52 |
| 43 Starlite Ave | 0.60mi | 3/1.0 | 1,120 (-11%) | 4mo | $250,000 | $223 | 51 |
| 35 Ceil Dr | 0.74mi | 3/1.5 | 1,181 (-6%) | 5mo | $260,000 | $220 | 49 |
| 104 Starlite Ave | 0.66mi | 3/1.0 | 1,120 (-11%) | 2mo | $260,000 | $232 | 49 |
Match score weights: distance 35% · size 25% · config 20% · recency 20%. Top-matched comps best support the ARV.
Projected returns pro-forma
8.06% appreciation · 3.0% rent growth · sell at horizon
- IRR
- 26.2%
- Equity multiple
- 2.90×
- Total profit
- $53,208
- Equity at exit
- $76,294
- IRR
- 23.6%
- Equity multiple
- 6.23×
- Total profit
- $146,237
- Equity at exit
- $151,823
Cash invested: $27,972 (down + closing). Projections, not guarantees.
Landlord ↔ Tenant lean methodology
- Overall (STATE)
- 15 Strongly Tenant-Friendly
- State New York
- 15 Strongly Tenant-Friendly · D+10
- County
- — inherits STATE
- City
- — inherits STATE
ZIP-level market 14206
- Home prices YoY
- 1.8%
- Active inventory
- 169
- Price-to-rent
- 5.7×
Monthly cashflow live
- Estimated rent
- $1,448 medium interval (Pro) →
- Mortgage (P&I)
- −$524
- Tax from tax record
- −$398 /mo · $4,776/yr
- Insurance
- −$42
- HOA
- −$0
- Vacancy / Maint / Mgmt
- −$304
- Net cashflow
- $180
Break-even live
UW: 25.0% down · 7.5% · 30yr · 1.5% tax · 5.0% vac · 8.0% maint · 8.0% mgmt
Financing live
Cash to close
- Down payment
- $24,975
- Closing costs
- $2,997
- Reserves months
- —
- Total cash needed
- —
Loan-product check · same deal, 3 products live
Conventional
25% down · 7.5% · 30yr
- Down + closing
- —
- Monthly P&I
- —
- Monthly cashflow
- —
- DSCR
- —
- Eligible?
- —
Personal DTI + credit; lowest rate.
DSCR
20% down · 8.5% · 30yr
- Down + closing
- —
- Monthly P&I
- —
- Monthly cashflow
- —
- DSCR
- —
- Eligible?
- —
No personal income docs; deal must DSCR.
Hard money
10% down · 12.0% · 12mo
- Down + closing
- —
- Monthly P&I
- —
- Monthly cashflow
- —
- DSCR
- —
- Eligible?
- —
Short-term bridge; refi at stabilization.
Rent comps 2 comps
| Address | Beds | Baths | Sqft | Rent | $/sqft | DOM | Units | Dist |
|---|---|---|---|---|---|---|---|---|
| 1368 Harlem Rd Buffalo, NY | 2.0 | 1.0 | 1776 | $1,300 | $0.73 | 23d | 1 | 0.19mi |
| 14 Rutland Ave Buffalo, NY | 4.0 | 1.0 | 1430 | $2,200 | $1.54 | 10d | 1 | 0.93mi |
Listing history 8 events
-
2026-04-13status Pending
-
2026-04-02status Active
-
2026-03-30status Pending
-
2026-03-24$99,900 Active
-
2026-01-02historical
-
2025-11-26price $129,900
-
2025-11-01price $139,900
-
2025-10-01$149,900 Active
ⓘ Source: listings_history table (triggers on properties + properties_extension) + one-shot
backfill from property_details.listing_events for pre-trigger history.
Tax reassessment forecast NY · Partial reset (capped growth)
- Current annual tax
- $4,776 · $398/mo
- Projected year-2 tax
- $4,776 · $398/mo
- Expected delta
- $0/yr ($0/mo · 0.0%)
ⓘ Screening estimate from a state-policy table — verify with the county assessor before closing.
Climate risk First Street
- Flood 1/10 Low FEMA zone X (unshaded) · 0% chance over 30 yrs
- Wildfire 1/10 Low
- Heat 3/10 Moderate 7 d/yr ≥92°F today · 16 d/yr by 30 yrs out
- Wind 1/10 Low
- Air quality 3/10 Moderate 2 unhealthy d/yr today · 3 by 30 yrs out
Nearby sold comps map
Loading sold comps map…
Walkable amenities ~0.75 mi
Loading nearby amenities…
Taxation est. · year 1
- Rental income
- $17,376
- − Mortgage interest
- −$5,596
- − Property taxes
- −$4,776
- − Insurance
- −$500
- − Repairs & maintenance
- −$1,390
- − Management
- −$1,390
- − Depreciation
- −$2,906
- Taxable income
- $818
- Est. tax owed @ 24.0%
- −$196
- After-tax cash flow
- $1,969/yr
For passive investors: Depreciation is non-cash, so a rental often shows a tax loss while cash-flowing — sheltering income. Rental losses are passive: they offset passive income freely, and up to $25,000/yr can offset ordinary (W-2) income if you actively participate and your MAGI is under $100k (phasing out to $0 by $150k); unused losses carry forward. On sale, claimed depreciation is recaptured at up to 25%, and gains may owe capital-gains tax (a 1031 exchange can defer both). Figures are a year-1 estimate at your 24.0% rate — not tax advice; consult a CPA.
Schools (NCES district)
- District
- Cheektowaga-Sloan Union Free School District
- NCES district ID
- 3627000
- Math proficiency
- 33% ▼ -16.00%
- Reading proficiency
- 38% ▼ -6.00%
- Median HH income
- $45,810
- Composite
- 30.35/100
- National rank
- #6263
- State rank
- #555 of 590 in NY
Livability — Cheektowaga
- Score
- 84/100
- State rank
- #54
- US rank
- #811
Category grades
Schools grade is shown separately in the Schools card above.
Census & demographics
- Census place
- Cheektowaga, NY
- County
- Erie County · 714,559 people
- City population
- 55,470
- Metro
- Buffalo-Cheektowaga, NY
- Population (ZIP)
- 21,631
- Household income
- $50,450
- Rent vs Own
- Severe rent burden
- 841.0
Population outlook (Erie County) Hauer SSP2
- Today (2025)
- 933,037 people
- By 2030
- 935,181 · +0.2%
- By 2040
- 928,531 · -0.5%
- By 2050
- 905,725 · -2.9%
- By 2075
- 834,037 · -10.6%
- By 2100
- 708,033 · -24.1%
Race, ethnicity, and origin ACS 2023
- Neighborhood character
- Majority White (65%)
- Race & ethnicity
- White 65% Hispanic / Latino 13% Black 12% Two or more races 8% Asian 4%
- Hispanic origin (detail)
- Mexican 2% Puerto Rican 10%
- Common ancestry
- Romanian 25% Lithuanian 1% Italian 1%
- Foreign-born
- 6% · Canada, China
- Languages at home
- 88% English-only · Spanish 5% Other Indo-European 3% Arabic 2%
Political lean MEDSL · Erie
- 2024 margin
- Lean D (+9.7) · D 54.8% · R 45.2%
- 2008→2024 swing
- -7.9pp toward R · 2008: 17.5pp · 2024: 9.7pp
- All cycles
- 2024: D+9.7 2020: D+14.7 2016: D+4.8 2012: D+15.6 2008: D+17.5
Not yet ingested
- Civics
- —
Market trends
- HPI YoY
- ▲ 8.06%
- Current HPI
- 457.3935
- Rent YoY
- —
- Metro
- Buffalo-Cheektowaga, NY
- State GDP YoY
- ▲ 2.60%
- F500 in state
- 92
Industry mix (Fortune 500 HQ in NY)
| Industry | F500 HQs | Revenue |
|---|---|---|
| Financial Services | 10 | $950B |
|
||
| Consumer Goods | 9 | $162B |
|
||
| Insurance | 4 | $225B |
|
||
| Telecommunications | 2 | $144B |
|
||
| Pharmaceuticals | 2 | $112B |
|
||
| Media / Entertainment | 2 | $69B |
|
||
Price history
-33.4% since first listed8 events — show timeline
- 2026-04-13 Pending — WNYREIS
- 2026-04-02 Relisted — WNYREIS
- 2026-03-30 Pending — WNYREIS
- 2026-03-24 Listed $99,900 WNYREIS
- 2026-01-02 Listing Removed — WNYREIS
- 2025-11-26 Price Changed $129,900 WNYREIS
- 2025-11-01 Price Changed $139,900 WNYREIS
- 2025-10-01 Listed $149,900 WNYREIS
Property tax history
+5.5%/yrLatest (2025): $4,776 · +0.2% YoY. Source: county tax records.
Cash-flow waterfall
monthlySold comps — $/sqft
last 12 mo · ≤1 miLoading sold comps…