5223 Colonial Ave · Dallas, TX
Flood risk 1/10 · Minimal
- FEMA flood zone
- X (shaded)
- Chance of flooding over 30 yrs
- 0.0%
- Est. flood insurance / yr
- $507 – $1,088
Fire risk 3/10 · Minor
- Est. fire insurance / yr
- $1,222 – $2,270
Heat risk 7/10 · Major
- Hot days now (above 110°F)
- 7 days/yr
- Hot days in 30 yrs
- 24 days/yr
Wind risk 6/10 · Moderate
- Chance of severe wind over 30 yrs
- 27.0%
Air-quality risk 2/10 · Minimal
- Unhealthy air days now
- 1 days/yr
- Unhealthy air days in 30 yrs
- 2 days/yr
Risk factors via First Street. Map © Google.
Why this score? — see what drove the D+ grade
The composite is a weighted blend of 9 inputs, each scored 0–100. Each bar is that input's sub-score; the figure is the points it added to the 100-point composite (weight × sub-score).
- ARV discount +14.9/15.0
- Cash flow +8.1/30.0
- Appreciation +5.4/10.0
- 1% rule +5.1/10.0
- Rent growth +4.3/5.0
- Livability +4.0/5.0
- Schools +2.8/10.0
- Condition / age +2.5/5.0
- DSCR +2.1/10.0
$240,000
🖨 Deal sheet 📄 Offer letter ✓ Due diligence
Listing remarks MLS
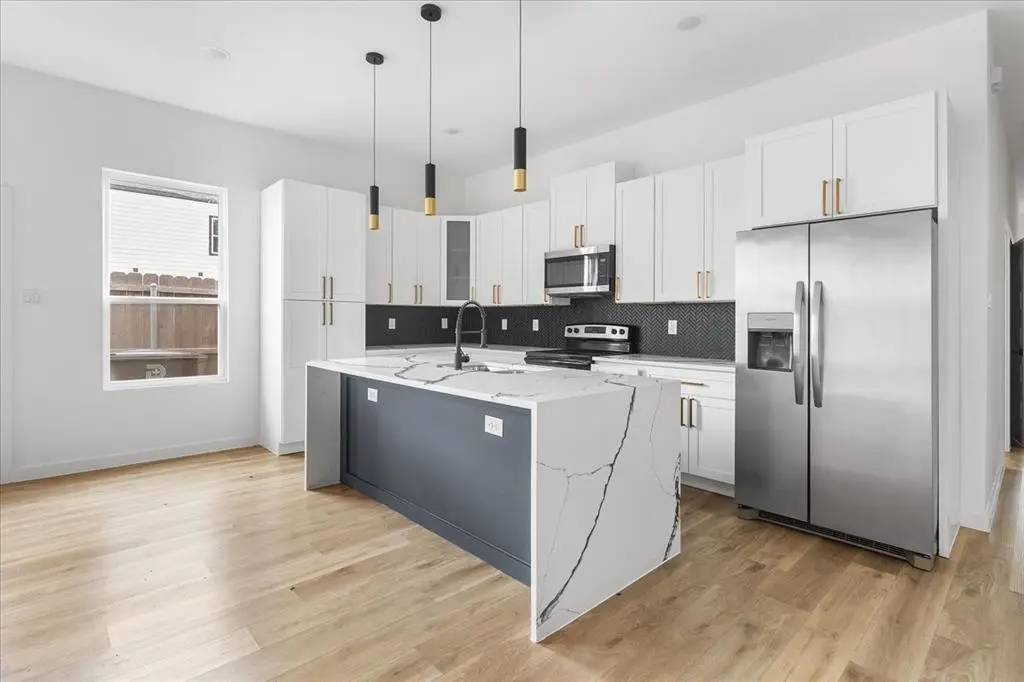
Discover a contemporary new-construction half-duplex in central Dallas - 4 beds, 2 baths. Bright, open floor plan with plenty of natural light. The chef-ready kitchen features quartz counters, gray shaker cabinets, stainless steel appliances, and a large island that flows into the living and dining space. This unit is being sold individually, the other side is already sold. Ideal for rental income or Airbnb, situated in a rapidly developing neighborhood with quick access to highways, shopping, and restaurants. Ready for immediate move-in.
Key facts
- 7,013 sq ft lot
- Built 2024
- Listed 62 days
Neighborhood map
What this means for you Summary
Snapshot
- This is a 8-bed/4.0-bath single-family listed at $240k.
Deal economics
- At list price, monthly cash flow is $-239 ($-3k/yr) — negative.
- To cash-flow at today's rent, offer at most $198k (17.6% below list).
- Meets the 1% rule at list price ($2k rent vs $240k).
- Recommended offer: $198k (17.6% below list) — sets the bar for cash-flow.
- Cap rate 5.1% vs local median 2.3% in Dallas — top-decile yield for the area; either an underpriced asset or a hidden risk that comps aren't pricing in. Stress-test before assuming the spread holds.
Location & tenants
- Location reads 81/100 on livability (#24 in TX, #1,380 nationally) — a professional / high-income tenant draw. Strengths: amenities A+, commute A+, housing A+; Watch: schools C-, crime F.
- Dallas ISD (urban): math 31% / reading 36% proficiency, ranked #559 of 826 in TX (top 68%) — families likely to look elsewhere, expect single-tenant / working-renter base with shorter leases; 83% free/reduced lunch — lower-income household profile, screen leases tightly.
- Market conditions: Rents rising fast (+7.2%/yr); 248 active listings in the ZIP; 12,577 units permitted in Dallas County in 2024 (6,829 in 5+ unit buildings).
- At $2,435/mo this rent would consume 64% of the median local household income ($46k/yr) (locally 1464% of renters already pay >50% of income on rent) — very limited rent-growth headroom before tenants either downsize or default.
Forward outlook
- In year one you build about $4k of equity ($2k loan paydown + $2k appreciation (0.8% local appreciation)).
- Dallas County population projected at +35% by 2050 — long-run rental-demand tailwind backs the buy-and-hold thesis.
- By year 9, paydown + projected appreciation supports a ~$34k cash-out refi (75% LTV) — recoverable capital for the next deal without selling this one.
Negotiation context
- It's been on market 62 days — a 6% lower offer ($226k) is reasonable based on typical stale-listing flexibility.
- 12 sale attempts since 4y ago with the ask held roughly flat each time — persistent listings suggest the price (not the market) is what's stuck; bring a comps-based counter.
Risks & watch-outs
- Watch-outs: property tax is 4.0% of price.
- Climate carrying-cost: major wind risk, 27% chance of damaging wind over 30y; extreme-heat days projected 7→24/yr by 2055 (HVAC capex compounding) — expect insurance premiums to compound above CPI over the hold.
Questions for the listing agent
- What do current leases actually rent for vs. the listed asking? Can we see a recent rent roll and the last 12 months of T-12 income?
- It's been on market 62 days. Have you received any prior offers? Is the seller open to a 18% concession, seller financing, or rate buy-down credit?
- Property tax is high relative to price — has the assessment been appealed recently, and will the sale trigger a re-assessment?
- Why hasn't it sold? Are there any deal-killer items the seller is aware of (foundation, flood, title, zoning, code violations)?
- Is there a deadline driving the sale (1031 exchange, divorce, estate, relocation)? That informs how much negotiation room exists.
- Crime grade is F in this area — have there been break-ins, vandalism, or insurance claims at this property in the last 3 years? What carrier currently insures it and at what premium?
- The area grade is low — what's the realistic commute time and amenity access for the typical tenant pool here? Any planned neighborhood developments (good or bad) we should know about?
- What's the average days-on-market for RENTAL listings here right now (not sales)? A rising rental-DOM trend means longer vacancies and softer asking-rent achievability than the comps imply.
- What's the recent tenant-quality profile in this submarket — average credit score on applications, eviction rate, late-payment / NSF rate, and stable-employment percentage? A property-management company in the area should have these aggregated.
- How much new for-sale + rental construction is in the pipeline within 1–3 miles? Heavy new supply typically softens prices + rents 12–24 months out; constrained supply supports both.
Investment metrics
- 1% rule
- 1.01% ✓
- Cap rate
- 5.10%
- Cash-on-cash
- -4.26%
- DSCR
- 0.81
- GRM
- 8.2
CMA / ARV
- ARV (median comp)
- $287,126
- List price
- $240,000
- Delta
- -16.41%
- Verdict
- UNDERPRICED
- Comps
- 20 within 1.0 mi
Projected returns pro-forma
0.79% appreciation · 7.19% rent growth · sell at horizon
- IRR
- -0.6%
- Equity multiple
- 0.97×
- Total profit
- $-2,133
- Equity at exit
- $79,310
- IRR
- 7.8%
- Equity multiple
- 2.04×
- Total profit
- $69,903
- Equity at exit
- $103,397
Cash invested: $67,200 (down + closing). Projections, not guarantees.
Landlord ↔ Tenant lean methodology
- Overall (STATE)
- 87 Strongly Landlord-Friendly
- State Texas
- 87 Strongly Landlord-Friendly · R+5
- County
- — inherits STATE
- City
- — inherits STATE
ZIP-level market 75215
- Home prices YoY
- 0.3%
- Rents YoY
- 7.2%
- Active inventory
- 248
- Price-to-rent
- 8.2×
Monthly cashflow live
- Estimated rent
- $2,435 medium interval (Pro) →
- Mortgage (P&I)
- −$1,259
- Tax from tax record
- −$804 /mo · $9,644/yr
- Insurance
- −$100
- HOA
- −$0
- Vacancy / Maint / Mgmt
- −$511
- Net cashflow
- $-239
Break-even live
UW: 25.0% down · 7.5% · 30yr · 1.5% tax · 5.0% vac · 8.0% maint · 8.0% mgmt
Financing live
Cash to close
- Down payment
- $60,000
- Closing costs
- $7,200
- Reserves months
- —
- Total cash needed
- —
Loan-product check · same deal, 3 products live
Conventional
25% down · 7.5% · 30yr
- Down + closing
- —
- Monthly P&I
- —
- Monthly cashflow
- —
- DSCR
- —
- Eligible?
- —
Personal DTI + credit; lowest rate.
DSCR
20% down · 8.5% · 30yr
- Down + closing
- —
- Monthly P&I
- —
- Monthly cashflow
- —
- DSCR
- —
- Eligible?
- —
No personal income docs; deal must DSCR.
Hard money
10% down · 12.0% · 12mo
- Down + closing
- —
- Monthly P&I
- —
- Monthly cashflow
- —
- DSCR
- —
- Eligible?
- —
Short-term bridge; refi at stabilization.
Listing history 37 events
-
2026-06-18days on market $240,000 Active 62 DOM
-
2026-06-17days on market $240,000 Active 61 DOM
-
2026-06-16days on market $240,000 Active 60 DOM
-
2026-06-15days on market $240,000 Active 59 DOM
-
2026-06-13days on market $240,000 Active 57 DOM
-
2026-06-09days on market $240,000 Active 53 DOM
-
2026-06-08days on market $240,000 Active 52 DOM
-
2026-06-07days on market $240,000 Active 51 DOM
-
2026-06-04days on market $240,000 Active 48 DOM
-
2026-06-03days on market $240,000 Active 47 DOM
-
2026-06-02days on market $240,000 Active 46 DOM
-
2026-06-01days on market $240,000 Active 45 DOM
-
2026-05-31days on market $240,000 Active 44 DOM
-
2026-04-17$240,000 Active 544-char remark
Show marketing remark (544 chars)
Discover a contemporary new-construction half-duplex in central Dallas - 4 beds, 2 baths. Bright, open floor plan with plenty of natural light. The chef-ready kitchen features quartz counters, gray shaker cabinets, stainless steel appliances, and a large island that flows into the living and dining space. This unit is being sold individually, the other side is already sold. Ideal for rental income or Airbnb, situated in a rapidly developing neighborhood with quick access to highways, shopping, and restaurants. Ready for immediate move-in.
-
2026-02-05$245,000 Active
-
2025-12-10soldstatus
-
2025-11-07historical $2,200
-
2025-10-27price $235,900
-
2025-10-27status Active
-
2025-08-27$2,200
-
2025-07-16$259,900 Active
-
2025-04-01historical $2,400
-
2024-11-22price $458,000
-
2024-11-22price $229,000
-
2024-11-14$250,000 Active
-
2024-11-14$500,000 Active
-
2024-11-14$2,400
-
2024-11-09historical $2,400
-
2024-11-09historical
-
2024-10-27$2,400
-
2024-10-12price $269,900
-
2024-10-12status Active
-
2024-09-25$275,900 Active
-
2023-03-29soldstatus
-
2022-03-09$150,000 Active
-
2022-01-14soldstatus
-
1995-02-24soldstatus
ⓘ Source: listings_history table (triggers on properties + properties_extension) + one-shot
backfill from property_details.listing_events for pre-trigger history.
Tax reassessment forecast TX · Resets to sale price
- Current annual tax
- $9,644 · $804/mo
- Projected year-2 tax
- $9,644 · $804/mo
- Expected delta
- $0/yr ($0/mo · 0.0%)
ⓘ Screening estimate from a state-policy table — verify with the county assessor before closing.
Climate risk First Street
- Flood 1/10 Low FEMA zone X (shaded) · 0% chance over 30 yrs
- Wildfire 3/10 Moderate
- Heat 7/10 Severe 7 d/yr ≥110°F today · 24 d/yr by 30 yrs out
- Wind 6/10 Major 27% chance of damaging wind over 30 yrs
- Air quality 2/10 Low 1 unhealthy d/yr today · 2 by 30 yrs out
Nearby sold comps map
Loading sold comps map…
Walkable amenities ~0.75 mi
Loading nearby amenities…
Taxation est. · year 1
- Rental income
- $29,219
- − Mortgage interest
- −$13,444
- − Property taxes
- −$9,644
- − Insurance
- −$1,200
- − Repairs & maintenance
- −$2,338
- − Management
- −$2,338
- − Depreciation
- −$6,982
- Taxable loss
- −$6,725
- Est. tax savings @ 24.0%
- +$1,614
- After-tax cash flow
- $-1,250/yr
For passive investors: Depreciation is non-cash, so a rental often shows a tax loss while cash-flowing — sheltering income. Rental losses are passive: they offset passive income freely, and up to $25,000/yr can offset ordinary (W-2) income if you actively participate and your MAGI is under $100k (phasing out to $0 by $150k); unused losses carry forward. On sale, claimed depreciation is recaptured at up to 25%, and gains may owe capital-gains tax (a 1031 exchange can defer both). Figures are a year-1 estimate at your 24.0% rate — not tax advice; consult a CPA.
Schools (NCES district)
- District
- Dallas ISD
- NCES district ID
- 4816230
- Math proficiency
- 31% ▼ -16.00%
- Reading proficiency
- 36% ▼ -4.00%
- Median HH income
- $42,881
- Composite
- 28.41/100
- National rank
- #6763
- State rank
- #559 of 826 in TX
Livability — Dallas
- Score
- 81/100
- State rank
- #24
- US rank
- #1380
Category grades
Schools grade is shown separately in the Schools card above.
Census & demographics
- Census place
- Dallas, TX
- County
- Dallas County · 2,612,404 people
- City population
- 1,168,437
- Metro
- Dallas-Fort Worth-Arlington, TX
- Population (ZIP)
- 18,895
- Household income
- $45,557
- Rent vs Own
- Severe rent burden
- 1464.0
Population outlook (Dallas County) Hauer SSP2
- Today (2025)
- 2,979,839 people
- By 2030
- 3,191,823 · +7.1%
- By 2040
- 3,619,611 · +21.5%
- By 2050
- 4,026,915 · +35.1%
- By 2075
- 4,957,073 · +66.4%
- By 2100
- 5,508,725 · +84.9%
Race, ethnicity, and origin ACS 2023
- Neighborhood character
- Diverse neighborhood (Simpson 0.58)
- Race & ethnicity
- Black 59% Hispanic / Latino 25% White 11% Two or more races 10%
- Hispanic origin (detail)
- Mexican 21%
- Common ancestry
- Italian 1% Hispanic 1%
- Foreign-born
- 16% · Canada
- Languages at home
- 74% English-only · Spanish 26%
Political lean MEDSL · Dallas
- 2024 margin
- Strong D (+22.2) · D 60.2% · R 38.0% · Other 1.8%
- 2008→2024 swing
- +6.9pp toward D · 2008: 15.3pp · 2024: 22.2pp
- All cycles
- 2024: D+22.2 2020: D+31.6 2016: D+26.2 2012: D+15.4 2008: D+15.3
Not yet ingested
- Civics
- —
Market trends
- HPI YoY
- ▲ 0.79%
- Current HPI
- 224.2955
- Rent YoY
- ▲ 7.19%
- Metro
- Dallas-Fort Worth-Arlington, TX
- State GDP YoY
- ▲ 3.95%
- F500 in state
- 110
Industry mix (Fortune 500 HQ in TX)
| Industry | F500 HQs | Revenue |
|---|---|---|
| Energy | 16 | $1,198B |
|
||
| Technology | 5 | $198B |
|
||
| Engineering / Construction | 4 | $72B |
|
||
| Energy Services | 3 | $60B |
|
||
| Utilities | 3 | $41B |
|
||
| Healthcare | 2 | $330B |
|
||
Price history
+60.0% since first listed24 events — show timeline
- 2026-04-17 Listed $240,000 NTREIS
- 2026-02-05 Listed $245,000 NTREIS
- 2025-12-10 Sold (Public Records) — Public Records
- 2025-11-07 Rental Removed $2,200 NTREIS
- 2025-10-27 Price Changed $235,900 NTREIS
- 2025-10-27 Relisted — NTREIS
- 2025-08-27 Listed for Rent $2,200 NTREIS
- 2025-07-16 Listed $259,900 NTREIS
- 2025-04-01 Rental Removed $2,400 NTREIS
- 2024-11-22 Price Changed $458,000 NTREIS
- 2024-11-22 Price Changed $229,000 NTREIS
- 2024-11-14 Listed $500,000 NTREIS
- 2024-11-14 Listed $250,000 NTREIS
- 2024-11-14 Listed for Rent $2,400 NTREIS
- 2024-11-09 Rental Removed $2,400 NTREIS
- 2024-11-09 Listing Removed — NTREIS
- 2024-10-27 Listed for Rent $2,400 NTREIS
- 2024-10-12 Price Changed $269,900 NTREIS
- 2024-10-12 Relisted — NTREIS
- 2024-09-25 Listed $275,900 NTREIS
- 2023-03-29 Sold (Public Records) — Public Records
- 2022-03-09 Listed $150,000 NTREIS
- 2022-01-14 Sold (Public Records) — Public Records
- 1995-02-24 Sold (Public Records) — Public Records
Property tax history
+28.9%/yrLatest (2025): $9,644 · +584.9% YoY. Source: county tax records.
Cash-flow waterfall
monthlySold comps — $/sqft
last 12 mo · ≤1 miLoading sold comps…