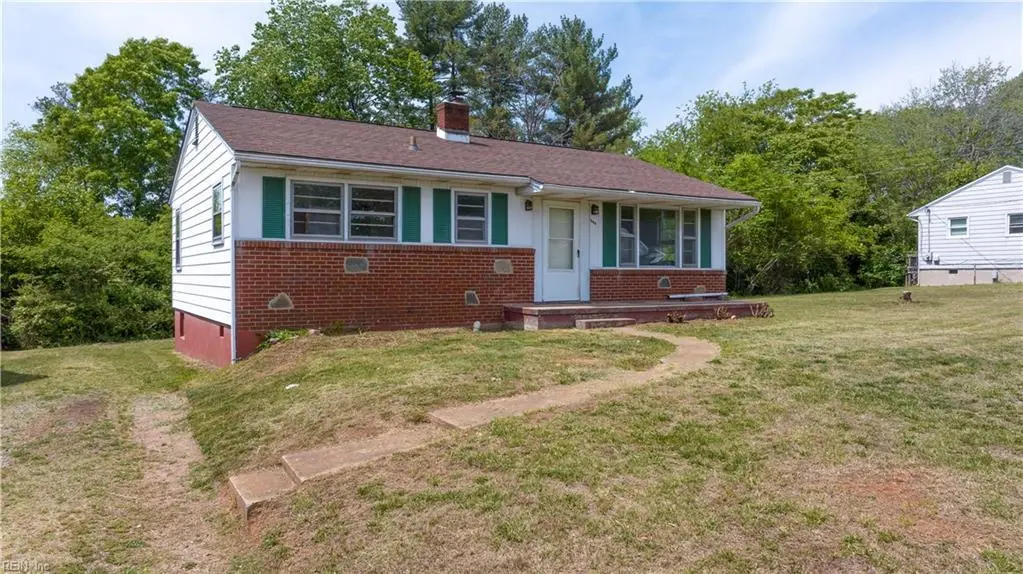
1018 Askin St · Martinsville, VA
Flood risk 1/10 · Minimal
- FEMA flood zone
- X (unshaded)
- Chance of flooding over 30 yrs
- 0.0%
- Est. flood insurance / yr
- $507 – $1,088
Fire risk 1/10 · Minimal
- Est. fire insurance / yr
- $666 – $1,236
Heat risk 5/10 · Moderate
- Hot days now (above 103°F)
- 7 days/yr
- Hot days in 30 yrs
- 18 days/yr
Wind risk 3/10 · Minor
- Chance of severe wind over 30 yrs
- 4.0%
Air-quality risk 2/10 · Minimal
- Unhealthy air days now
- 0 days/yr
- Unhealthy air days in 30 yrs
- 1 days/yr
Risk factors via First Street. Map © Google.
Why this score? — see what drove the C grade
The composite is a weighted blend of 9 inputs, each scored 0–100. Each bar is that input's sub-score; the figure is the points it added to the 100-point composite (weight × sub-score).
- Cash flow +29.6/30.0
- DSCR +10.0/10.0
- 1% rule +7.2/10.0
- Livability +3.5/5.0
- Schools +3.3/10.0
- Rent growth +2.5/5.0
- Condition / age +2.5/5.0
- ARV discount +0.0/15.0
- Appreciation +0.0/10.0
$89,000
🖨 Deal sheet 📄 Offer letter ✓ Due diligence
Listing remarks MLS
House on level lot, with an extra lot. Great starter home. Priced below assessed value by $9,800 - great buy.
Key facts
- 8,712 sq ft lot
- Built 1956
- Listed 39 days
Property features AI
Finance
- HOA & community: No condo or POA fees
Exterior
- Parking: Off-street parking
- Utilities: City/County water; City/County sewer; Gas water heater
- Home design: Detached ranch; Single-story home with 1 living level; Crawl foundation
- Construction: Crawl foundation
- Exterior features: Brick siding; Approximately 0.20 acre lot; Lot dimensions: 8,843 sq ft
Interior
- Kitchen: Kitchen
- Bedrooms: Master bedroom; Additional bedroom; Bedroom and full bathroom on first floor
- Bathrooms: 1 full bathroom
- Interior features: Fixer upper
Neighborhood map
What this means for you Summary
Snapshot
- This is a 2-bed/1.0-bath other listed at $89k.
Deal economics
- At list price, monthly cash flow is $320 ($4k/yr) — positive.
- The deal already cash-flows at list — no discount required.
- Meets the 1% rule at list price ($1k rent vs $89k).
- Recommended offer: $86k (3.0% below list) — sets the bar for market timing.
- Cap rate 10.6% vs local median 5.9% in Martinsville — top-decile yield for the area; either an underpriced asset or a hidden risk that comps aren't pricing in. Stress-test before assuming the spread holds.
Location & tenants
- Location reads 70/100 on livability (#231 in VA) — a middle-class / working-renter tenant base. Strengths: cost of living A+, health & safety A+, schools B; Watch: amenities F, commute F, employment D-.
- Martinsville City Public School District (town): math 29% / reading 53% proficiency, ranked #122 of 131 in VA (top 93%) — families likely to look elsewhere, expect single-tenant / working-renter base with shorter leases; 74% free/reduced lunch — lower-income household profile, screen leases tightly.
- Market conditions: 256 active listings in the ZIP; 5 comparable units currently listed for rent nearby; rentals lingering (median 44d on market — plan ~5-8 weeks vacancy on turnover, expect pricing pressure); 100% of comp listings sitting > 30 days — soft ceiling on asking rent; 5 units permitted in Martinsville city in 2024 (5 in 5+ unit buildings).
Forward outlook
- Local home prices are declining (-3.0%/yr); year-one equity from $615 of loan paydown is wiped out by about $3k of value loss. Plan a longer hold.
- Martinsville County population projected at -14% by 2050 — secular population decline; favor cash flow + early exit over multi-decade hold.
- At projected returns (-3.0% appreciation + 3.0% rent growth), your $25k cash investment doubles in ~8 years — after that, you're playing with house money.
Negotiation context
- It's been on market 40 days — a 3% lower offer ($86k) is reasonable based on typical stale-listing flexibility.
- 4 sale attempts since 15y ago; this cycle's ask has dropped $10k (10%) from the opening price — seller is motivated, your offer sets the floor, not the list.
- Current owner paid $27k; list at $89k implies a 230% gain — meaningful room to come down on a strong offer.
Risks & watch-outs
- Watch-outs: built in 1956 — expect roof / HVAC / electrical / plumbing capex.
- Climate carrying-cost: extreme-heat days projected 7→18/yr by 2055 (HVAC capex compounding) — expect insurance premiums to compound above CPI over the hold.
Questions for the listing agent
- It's been on market 40 days. Have you received any prior offers? Is the seller open to a 3% concession, seller financing, or rate buy-down credit?
- Built in 1956 — when were the roof, HVAC, electrical panel, plumbing, and water heater last replaced?
- Is there a deadline driving the sale (1031 exchange, divorce, estate, relocation)? That informs how much negotiation room exists.
- Schools are B-rated — typically a magnet for longer-tenancy family renters. What's the average tenant stay here, and is there a school-zone premium baked into asking?
- What's the average days-on-market for RENTAL listings here right now (not sales)? A rising rental-DOM trend means longer vacancies and softer asking-rent achievability than the comps imply.
- What's the recent tenant-quality profile in this submarket — average credit score on applications, eviction rate, late-payment / NSF rate, and stable-employment percentage? A property-management company in the area should have these aggregated.
- How much new for-sale + rental construction is in the pipeline within 1–3 miles? Heavy new supply typically softens prices + rents 12–24 months out; constrained supply supports both.
Investment metrics
- 1% rule
- 1.22% ✓
- Cap rate
- 10.61%
- Cash-on-cash
- 15.43%
- DSCR
- 1.69
- GRM
- 6.8
CMA / ARV
- ARV (median comp)
- $61,726
- List price
- $89,000
- Delta
- 44.19%
- Verdict
- OVERPRICED
- Comps
- 20 within 1.0 mi
Projected returns pro-forma
-3.0% appreciation · 3.0% rent growth · sell at horizon
- IRR
- 6.1%
- Equity multiple
- 1.24×
- Total profit
- $5,955
- Equity at exit
- $13,270
- IRR
- 15.5%
- Equity multiple
- 2.26×
- Total profit
- $31,337
- Equity at exit
- $7,695
Cash invested: $24,920 (down + closing). Projections, not guarantees.
Landlord ↔ Tenant lean methodology
- Overall (STATE)
- 55 Moderately Landlord-Leaning
- State Virginia
- 55 Moderately Landlord-Leaning · D+2
- County
- — inherits STATE
- City
- — inherits STATE
ZIP-level market 24112
- Active inventory
- 256
- Price-to-rent
- 6.8×
Monthly cashflow live
- Estimated rent
- $1,086 high interval (Pro) →
- Mortgage (P&I)
- −$467
- Tax from tax record
- −$33 /mo · $401/yr
- Insurance
- −$37
- HOA
- −$0
- Vacancy / Maint / Mgmt
- −$228
- Net cashflow
- $320
Break-even live
UW: 25.0% down · 7.5% · 30yr · 1.5% tax · 5.0% vac · 8.0% maint · 8.0% mgmt
Financing live
Cash to close
- Down payment
- $22,250
- Closing costs
- $2,670
- Reserves months
- —
- Total cash needed
- —
Loan-product check · same deal, 3 products live
Conventional
25% down · 7.5% · 30yr
- Down + closing
- —
- Monthly P&I
- —
- Monthly cashflow
- —
- DSCR
- —
- Eligible?
- —
Personal DTI + credit; lowest rate.
DSCR
20% down · 8.5% · 30yr
- Down + closing
- —
- Monthly P&I
- —
- Monthly cashflow
- —
- DSCR
- —
- Eligible?
- —
No personal income docs; deal must DSCR.
Hard money
10% down · 12.0% · 12mo
- Down + closing
- —
- Monthly P&I
- —
- Monthly cashflow
- —
- DSCR
- —
- Eligible?
- —
Short-term bridge; refi at stabilization.
Rent comps 5 comps
| Address | Beds | Baths | Sqft | Rent | $/sqft | DOM | Units | Dist |
|---|---|---|---|---|---|---|---|---|
| 1002 Oak St Martinsville, VA | 3.0 | 1.0 | 884 | $1,263 | $1.43 | 44d | 1 | 0.18mi |
| 35 Circle Dr Martinsville, VA | 3.0 | 1.0 | 960 | $1,263 | $1.32 | 44d | 1 | 1.00mi |
| 509 Monroe St Unit 6 Martinsville, VA | 2.0 | 1.0 | 655 | $875 | $1.34 | 44d | 1 | 1.04mi |
| 300 Dye Plant Rd Apt F Martinsville, VA | 2.0 | 1.0 | 739 | $875 | $1.18 | 44d | 1 | 1.17mi |
| 612 Church St E Apt 4 Martinsville, VA | 1.0 | 1.0 | 750 | $800 | $1.07 | 44d | 1 | 1.37mi |
Listing history 21 events
-
2026-06-19days on market $89,000 Active 40 DOM
-
2026-06-18days on market $89,000 Active 39 DOM
-
2026-06-17days on market $89,000 Active 38 DOM
-
2026-06-16days on market $89,000 Active 37 DOM
-
2026-06-15days on market $89,000 Active 36 DOM
-
2026-06-14days on market $89,000 Active 34 DOM
-
2026-06-12days on market $89,000 Active 33 DOM
-
2026-06-09days on market $89,000 Active 30 DOM
-
2026-06-09price $89,000 Active 29 DOM
-
2026-06-08days on market $99,000 Active 29 DOM
-
2026-06-07days on market $99,000 Active 28 DOM
-
2026-06-02days on market $99,000 Active 23 DOM
-
2026-06-01days on market $99,000 Active 22 DOM
-
2026-05-31days on market $99,000 Active 21 DOM
-
2026-05-30days on market $99,000 Active 20 DOM
-
2026-05-11$99,000 Active 600-char remark
-
2026-05-09$99,000 600-char remark
-
2016-05-12$49,900
-
2011-09-21soldstatus $27,000
-
2011-09-16soldstatus $27,000
Show marketing remark (109 chars)
House on level lot, with an extra lot. Great starter home. Priced below assessed value by $9,800 - great buy.
-
2011-08-16$30,000
Show marketing remark (109 chars)
House on level lot, with an extra lot. Great starter home. Priced below assessed value by $9,800 - great buy.
ⓘ Source: listings_history table (triggers on properties + properties_extension) + one-shot
backfill from property_details.listing_events for pre-trigger history.
Tax reassessment forecast VA · Resets to sale price
- Current annual tax
- $401 · $33/mo
- Projected year-2 tax
- $730 · $61/mo
- Expected delta
- +$329/yr (+$27/mo · 82.1%)
ⓘ Screening estimate from a state-policy table — verify with the county assessor before closing.
Climate risk First Street
- Flood 1/10 Low FEMA zone X (unshaded) · 0% chance over 30 yrs
- Wildfire 1/10 Low
- Heat 5/10 Major 7 d/yr ≥103°F today · 18 d/yr by 30 yrs out
- Wind 3/10 Moderate 4% chance of damaging wind over 30 yrs
- Air quality 2/10 Low 0 unhealthy d/yr today · 1 by 30 yrs out
Nearby sold comps map
Loading sold comps map…
Walkable amenities ~0.75 mi
Loading nearby amenities…
Taxation est. · year 1
- Rental income
- $13,027
- − Mortgage interest
- −$4,985
- − Property taxes
- −$401
- − Insurance
- −$445
- − Repairs & maintenance
- −$1,042
- − Management
- −$1,042
- − Depreciation
- −$2,589
- Taxable income
- $2,523
- Est. tax owed @ 24.0%
- −$605
- After-tax cash flow
- $3,240/yr
For passive investors: Depreciation is non-cash, so a rental often shows a tax loss while cash-flowing — sheltering income. Rental losses are passive: they offset passive income freely, and up to $25,000/yr can offset ordinary (W-2) income if you actively participate and your MAGI is under $100k (phasing out to $0 by $150k); unused losses carry forward. On sale, claimed depreciation is recaptured at up to 25%, and gains may owe capital-gains tax (a 1031 exchange can defer both). Figures are a year-1 estimate at your 24.0% rate — not tax advice; consult a CPA.
Schools (NCES district)
- District
- Martinsville City Public School District
- NCES district ID
- 5102400
- Math proficiency
- 29% ▼ -51.00%
- Reading proficiency
- 53% ▼ -14.00%
- Median HH income
- $31,215
- Composite
- 33.43/100
- National rank
- #5467
- State rank
- #122 of 131 in VA
Livability — Martinsville
- Score
- 70/100
- State rank
- #231
- US rank
- #7826
Category grades
Schools grade is shown separately in the Schools card above.
Census & demographics
- Census place
- Martinsville, VA
- County
- Martinsville City · 31,028 people
- City population
- 31,028
- Metro
- Martinsville, VA
- Population (ZIP)
- 31,028
- Household income
- $48,770
- Rent vs Own
- Severe rent burden
- 888.0
Population outlook (Martinsville County) Hauer SSP2
- Today (2025)
- 13,026 people
- By 2030
- 12,673 · -2.7%
- By 2040
- 11,933 · -8.4%
- By 2050
- 11,136 · -14.5%
- By 2075
- 9,886 · -24.1%
- By 2100
- 8,334 · -36.0%
Race, ethnicity, and origin ACS 2023
- Neighborhood character
- Diverse neighborhood (Simpson 0.60)
- Race & ethnicity
- White 50% Black 38% Hispanic / Latino 7% Two or more races 5% Asian 1%
- Hispanic origin (detail)
- Mexican 3% Puerto Rican 1%
- Common ancestry
- Slovak 1% Italian 1% Lithuanian 1%
- Foreign-born
- 5% · Canada
- Languages at home
- 92% English-only · Spanish 6% Other Indo-European 1%
Political lean MEDSL · Martinsville
- 2024 margin
- Strong D (+22.6) · D 60.7% · R 38.1% · Other 1.2%
- 2008→2024 swing
- -5.4pp toward R · 2008: 28.0pp · 2024: 22.6pp
- All cycles
- 2024: D+22.6 2020: D+26.6 2016: D+23.5 2012: D+24.6 2008: D+28.0
Not yet ingested
- Civics
- —
Market trends
- HPI YoY
- ▼ -95.37%
- Current HPI
- 172.4393
- Rent YoY
- —
- Metro
- Martinsville, VA
- State GDP YoY
- ▲ 2.40%
- F500 in state
- 50
Industry mix (Fortune 500 HQ in VA)
| Industry | F500 HQs | Revenue |
|---|---|---|
| Aerospace / Defense | 4 | $236B |
|
||
| Technology / Defense | 3 | $32B |
|
||
| Financial Services | 2 | $176B |
|
||
| Utilities | 2 | $27B |
|
||
| Insurance | 2 | $25B |
|
||
| Technology | 2 | $15B |
|
||
Price history
+196.7% since first listed7 events — show timeline
- 2026-06-09 Price Changed $89,000 REINMLS
- 2026-05-11 Listed $99,000 REINMLS
- 2026-05-09 Listed $99,000 REINMLS
- 2016-05-12 Listed $49,900 MHPCAR
- 2011-09-21 Sold (Public Records) $27,000 Public Records
- 2011-09-16 Sold (MLS) $27,000 MHPCAR
- 2011-08-16 Listed $30,000 MHPCAR
Property tax history
+0.7%/yrLatest (2025): $401 · +19.1% YoY. Source: county tax records.
Cash-flow waterfall
monthlySold comps — $/sqft
last 12 mo · ≤1 miLoading sold comps…