 Multi-family
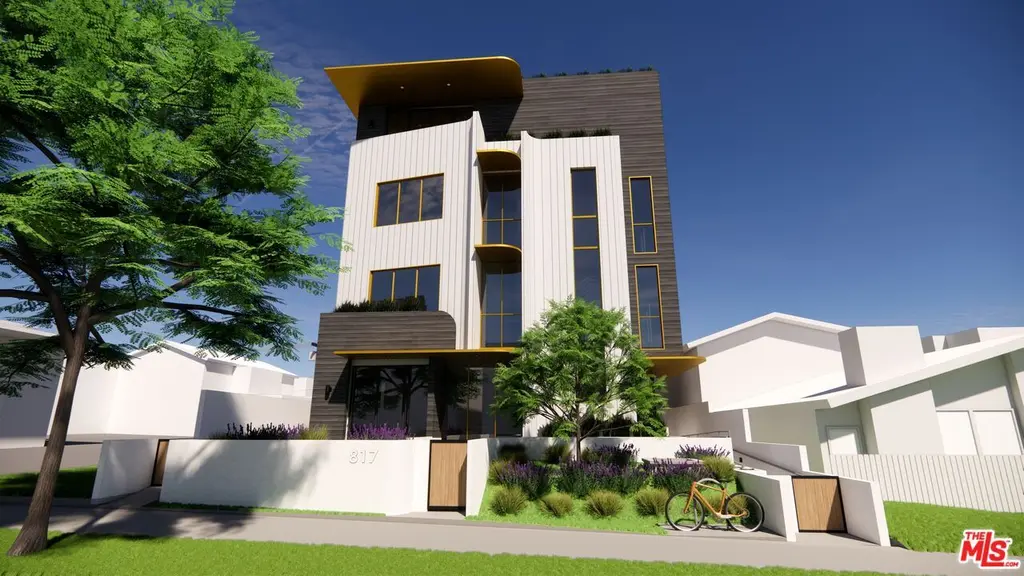
817 16th St · Santa Monica, CA
Flood risk 1/10 · Minimal
- FEMA flood zone
- X (unshaded)
- Chance of flooding over 30 yrs
- 0.0%
- Est. flood insurance / yr
- $507 – $1,088
Fire risk 1/10 · Minimal
- Est. fire insurance / yr
- $659 – $1,223
Heat risk 6/10 · Moderate
- Hot days now (above 83°F)
- 7 days/yr
- Hot days in 30 yrs
- 20 days/yr
Wind risk 1/10 · Minimal
- Chance of severe wind over 30 yrs
- —
Air-quality risk 4/10 · Minor
- Unhealthy air days now
- 5 days/yr
- Unhealthy air days in 30 yrs
- 6 days/yr
Risk factors via First Street. Map © Google.
Why this score? — see what drove the C- grade
The composite is a weighted blend of 9 inputs, each scored 0–100. Each bar is that input's sub-score; the figure is the points it added to the 100-point composite (weight × sub-score).
- Cash flow +16.5/30.0
- ARV discount +7.5/15.0
- Schools +6.2/10.0
- DSCR +5.1/10.0
- Appreciation +4.9/10.0
- 1% rule +4.1/10.0
- Livability +3.6/5.0
- Rent growth +2.5/5.0
- Condition / age +2.5/5.0
$3,250,000
🖨 Deal sheet 📄 Offer letter ✓ Due diligence
Multi-family units
County records classify this as Multi-Family (2-4 Unit). Listing-text estimate: 1 unit. estimate disagrees with records
Listing remarks MLS
Located just off Montana Avenue in one of Santa Monica's most desirable and supply-constrained residential corridors, 817 16th Street presents a rare opportunity to acquire a fully entitled boutique, architectural townhouse-style condominium project in a high-demand neighborhood. The project is comprised of six market-rate residences plus two affordable units, over subterranean parking for ten vehicles and a formally approved subdivision tract map. Designed by Breakform Design, the plans reflect a refined, contemporary architectural vision aligned with the expectations of today's luxury Westside buyer. With Planning Commission approvals secured and the property removed from the rental market via the Ellis Act, a developer can step in and pivot directly into construction documents and plan check. A substantial portion of the entitlement timeline has been completed, creating a streamlined path to market and a compelling opportunity to capitalize on strong end-user demand in a premier Montana-adjacent location.
Key facts
- 7,483 sq ft lot
- Listed 76 days
Neighborhood map
What this means for you Summary
Snapshot
- This is a 2-bed/2.0-bath multifamily listed at $3.25M.
Deal economics
- At list price, monthly cash flow is $2k ($23k/yr) — positive.
- The deal already cash-flows at list — no discount required.
- To meet the 1% rule (rent ≥ 1% of price), the offer needs to be $2.94M (9.4% below list).
- Recommended offer: $2.94M (9.4% below list) — sets the bar for 1% rule.
- Cap rate 7.0% vs local median 1.2% in Santa Monica — top-decile yield for the area; either an underpriced asset or a hidden risk that comps aren't pricing in. Stress-test before assuming the spread holds.
Location & tenants
- Location reads 72/100 on livability (#178 in CA) — a middle-class / working-renter tenant base. Strengths: schools A+, amenities A+, commute A+; Watch: health & safety C-, crime F, cost of living F.
- Santa Monica-Malibu Unified (urban): math 61% / reading 74% proficiency, ranked #123 of 1,400 in CA (top 9%) — acceptable for families but not a draw, mixed tenant base, ~2y average lease.
- Market conditions: Rents soft (-0.1%/yr); 93 active listings in the ZIP; 40 comparable units currently listed for rent nearby; rentals at typical pace (median 25d on market — plan ~3-4 weeks tenant-placement turnaround); high-income renter base; 19,697 units permitted in Los Angeles County in 2024 (9,426 in 5+ unit buildings).
- At $29,438/mo this rent would consume 290% of the median local household income ($122k/yr) (locally 2265% of renters already pay >50% of income on rent) — very limited rent-growth headroom before tenants either downsize or default.
Forward outlook
- In year one you build about $19k of equity ($22k loan paydown + $-3k appreciation (-0.1% local appreciation)).
- Los Angeles County population projected at +9% by 2050 — modest demand growth; plan on rents tracking national, not racing it.
- By year 8, paydown + projected appreciation supports a ~$217k cash-out refi (75% LTV) — recoverable capital for the next deal without selling this one.
Negotiation context
- It's been on market 77 days — a 6% lower offer ($3.06M) is reasonable based on typical stale-listing flexibility.
- 9 sale attempts since 13y ago; this cycle's ask has dropped $500k (13%) from the opening price — seller is motivated, your offer sets the floor, not the list.
- Current owner paid $2.52M; 29% above their basis — modest negotiation headroom, anchor on the comps not their cost.
Risks & watch-outs
- Watch-outs: built in 1952 — expect roof / HVAC / electrical / plumbing capex.
- Climate carrying-cost: extreme-heat days projected 7→20/yr by 2055 (HVAC capex compounding) — expect insurance premiums to compound above CPI over the hold.
Questions for the listing agent
- It's been on market 77 days. Have you received any prior offers? Is the seller open to a 9% concession, seller financing, or rate buy-down credit?
- Built in 1952 — when were the roof, HVAC, electrical panel, plumbing, and water heater last replaced?
- Why hasn't it sold? Are there any deal-killer items the seller is aware of (foundation, flood, title, zoning, code violations)?
- Is there a deadline driving the sale (1031 exchange, divorce, estate, relocation)? That informs how much negotiation room exists.
- Schools are A-rated — typically a magnet for longer-tenancy family renters. What's the average tenant stay here, and is there a school-zone premium baked into asking?
- Crime grade is F in this area — have there been break-ins, vandalism, or insurance claims at this property in the last 3 years? What carrier currently insures it and at what premium?
- What's the average days-on-market for RENTAL listings here right now (not sales)? A rising rental-DOM trend means longer vacancies and softer asking-rent achievability than the comps imply.
- What's the recent tenant-quality profile in this submarket — average credit score on applications, eviction rate, late-payment / NSF rate, and stable-employment percentage? A property-management company in the area should have these aggregated.
- How much new apartment / multifamily construction is in the pipeline within 1–3 miles? Heavy new supply (>2% of stock underway) typically softens rents 12–24 months out; light construction supports rent growth.
Investment metrics
- 1% rule
- 0.91% ✗
- Cap rate
- 6.99%
- Cash-on-cash
- 2.48%
- DSCR
- 1.11
- GRM
- 9.2
CMA / ARV
- ARV (median comp)
- $3,491,183,811
- List price
- $3,250,000
- Delta
- -99.91%
- Verdict
- UNDERPRICED
- Comps
- 1 within 2.0 mi
Projected returns pro-forma
-0.1% appreciation · 0.0% rent growth · sell at horizon
- IRR
- -1.8%
- Equity multiple
- 0.92×
- Total profit
- $-77,091
- Equity at exit
- $927,385
- IRR
- 1.8%
- Equity multiple
- 1.18×
- Total profit
- $161,964
- Equity at exit
- $1,101,825
Cash invested: $910,000 (down + closing). Projections, not guarantees.
Landlord ↔ Tenant lean methodology
- Overall (STATE)
- 18 Strongly Tenant-Friendly
- State California
- 18 Strongly Tenant-Friendly · D+13
- County
- — inherits STATE
- City
- — inherits STATE
ZIP-level market 90403
- Home prices YoY
- -0.0%
- Rents YoY
- -0.1%
- Active inventory
- 93
- Price-to-rent
- 55.2×
Monthly cashflow live
- Estimated rent
- $29,438 high interval (Pro) →
- Mortgage (P&I)
- −$17,043
- Tax from tax record
- −$2,977 /mo · $35,728/yr
- Insurance
- −$1,354
- HOA
- −$0
- Vacancy / Maint / Mgmt
- −$6,182
- Net cashflow
- $1,881
Break-even live
6-unit breakdown (identical units grouped — click to expand)
| Units | Beds | Baths | Est. rent |
|---|---|---|---|
| 6× units | 2 | 2 | $29,436 |
| #1 | 2 | 2 | $4,906 |
| #2 | 2 | 2 | $4,906 |
| #3 | 2 | 2 | $4,906 |
| #4 | 2 | 2 | $4,906 |
| #5 | 2 | 2 | $4,906 |
| #6 | 2 | 2 | $4,906 |
| Total (6 units) | $29,438 | ||
UW: 25.0% down · 7.5% · 30yr · 1.5% tax · 5.0% vac · 8.0% maint · 8.0% mgmt
Financing live
Cash to close
- Down payment
- $812,500
- Closing costs
- $97,500
- Reserves months
- —
- Total cash needed
- —
Loan-product check · same deal, 3 products live
Conventional
25% down · 7.5% · 30yr
- Down + closing
- —
- Monthly P&I
- —
- Monthly cashflow
- —
- DSCR
- —
- Eligible?
- —
Personal DTI + credit; lowest rate.
DSCR
20% down · 8.5% · 30yr
- Down + closing
- —
- Monthly P&I
- —
- Monthly cashflow
- —
- DSCR
- —
- Eligible?
- —
No personal income docs; deal must DSCR.
Hard money
10% down · 12.0% · 12mo
- Down + closing
- —
- Monthly P&I
- —
- Monthly cashflow
- —
- DSCR
- —
- Eligible?
- —
Short-term bridge; refi at stabilization.
Rent comps 40 comps
| Address | Beds | Baths | Sqft | Rent | $/sqft | DOM | Units | Dist |
|---|---|---|---|---|---|---|---|---|
| 1517 Idaho Ave Santa Monica, CA | 2.0 | 1.0 | 600 | $3,450 | $5.75 | 44d | 1 | 0.07mi |
| 751 18th St Unit A Santa Monica, CA | 1.0 | 1.0 | 750 | $5,950 | $7.93 | 25d | 1 | 0.20mi |
| 832 Euclid St #104 Santa Monica, CA | 2.0 | 2.0 | 1035 | $5,050 | $4.88 | 44d | 1 | 0.23mi |
| 923 Euclid St #302 Santa Monica, CA | 1.0 | 2.0 | 1077 | $4,000 | $3.71 | 17d | 1 | 0.23mi |
| 900 Euclid St Santa Monica, CA | 1.0–2.0 | 1.0–2.0 | 1100 | $5,500 | $5.00 | 3d | 2 | 0.24mi |
| 1037 Euclid St Unit D Santa Monica, CA | 1.0 | 1.0 | 714 | $2,690 | $3.77 | 44d | 1 | 0.34mi |
| 913 20th St Unit 1 Santa Monica, CA | 2.0 | 1.0 | 900 | $3,295 | $3.66 | 11d | 1 | 0.36mi |
| 824 11th St Unit 180-7 Santa Monica, CA | 1.0 | 1.0 | 675 | $2,595 | $3.84 | 44d | 1 | 0.37mi |
| 1025 Idaho Ave Unit 6 Santa Monica, CA | 2.0 | 2.0 | 1100 | $3,695 | $3.36 | 44d | 1 | 0.38mi |
| 1025 Idaho Ave Unit 9 Santa Monica, CA | 1.0 | 1.0 | 800 | $2,950 | $3.69 | 4d | 1 | 0.38mi |
| 1025 Idaho Ave Unit 9 Santa Monica, CA | 1.0 | 1.0 | 750 | $2,950 | $3.93 | 6d | 1 | 0.38mi |
| 1025 Idaho Ave Unit 2 Santa Monica, CA | 1.0 | 1.0 | 800 | $3,100 | $3.88 | 44d | 1 | 0.39mi |
| 832 21st St Santa Monica, CA | 1.0 | 1.0 | 780 | $2,850 | $3.65 | 17d | 1 | 0.39mi |
| 2102 Montana Ave Unit 2102 Santa Monica, CA | 2.0 | 1.0 | 880 | $4,299 | $4.89 | 44d | 1 | 0.42mi |
| 2102 Montana Ave Unit 2106 Santa Monica, CA | 2.0 | 1.0 | 880 | $3,999 | $4.54 | 44d | 1 | 0.42mi |
| 1027 11th St Santa Monica, CA | 2.0 | 3.0 | 850 | $4,650 | $5.47 | 44d | 1 | 0.43mi |
| 1144 15th St Unit 7 Santa Monica, CA | 1.0 | 1.0 | 650 | $3,700 | $5.69 | 44d | 1 | 0.44mi |
| 1037 11th St Unit 1 Santa Monica, CA | 2.0 | 2.0 | 1000 | $4,195 | $4.20 | 8d | 1 | 0.44mi |
| 1111 12th St Santa Monica, CA | 1.0 | 1.0 | 550 | $2,595 | $4.72 | 22d | 1 | 0.46mi |
| 1111 12th St Santa Monica, CA | 1.0 | 1.0 | 550 | $2,595 | $4.72 | 21d | 1 | 0.46mi |
| 1045 20th St Apt E Santa Monica, CA | 1.0 | 1.0 | 690 | $2,290 | $3.32 | 25d | 1 | 0.46mi |
| 827 9th St Unit 7 Santa Monica, CA | 2.0 | 1.5 | 950 | $3,400 | $3.58 | 25d | 1 | 0.49mi |
| 1118 20th St Santa Monica, CA | 1.0 | 1.0 | 600 | $2,300 | $3.83 | 44d | 1 | 0.49mi |
| 1037 10th St Apt 203 Santa Monica, CA | 2.0 | 2.0 | 1100 | $3,695 | $3.36 | 44d | 1 | 0.50mi |
| 627 9th St Unit D Santa Monica, CA | 1.0 | 1.0 | 600 | $2,800 | $4.67 | 6d | 1 | 0.51mi |
| 1020 10th St Unit A Santa Monica, CA | 2.0 | 2.0 | 1100 | $5,950 | $5.41 | 5d | 1 | 0.51mi |
| 1138 12th St #5 Santa Monica, CA | 2.0 | 2.0 | 1045 | $5,000 | $4.78 | 8d | 1 | 0.52mi |
| 1137 11th St Santa Monica, CA | 2.0 | 2.0 | 860 | $3,695 | $4.30 | 44d | 1 | 0.54mi |
| 1117 10th St Unit 4 Santa Monica, CA | 1.0 | 1.0 | 600 | $2,195 | $3.66 | 21d | 1 | 0.57mi |
| 1123 10th St Unit E Santa Monica, CA | 1.0 | 1.0 | 615 | $3,500 | $5.69 | 4d | 1 | 0.57mi |
| 911 Lincoln Blvd Unit 10 Santa Monica, CA | 1.0 | 1.0 | 800 | $2,600 | $3.25 | 44d | 1 | 0.58mi |
| 917 Lincoln Blvd Unit 5 Santa Monica, CA | 1.0 | 1.0 | 600 | $3,350 | $5.58 | 15d | 1 | 0.58mi |
| 921 Lincoln Blvd Unit A Santa Monica, CA | 2.0 | 2.0 | 1000 | $3,800 | $3.80 | 44d | 1 | 0.58mi |
| 1018 9th St Apt 4 Santa Monica, CA | 3.0 | 2.0 | 1000 | $3,754 | $3.75 | 25d | 1 | 0.59mi |
| 1251 14th St Santa Monica, CA | 2.0 | 2.0 | 1024 | $3,598 | $3.51 | 2d | 3 | 0.60mi |
| 1251 14th St Santa Monica, CA | 2.0 | 2.0 | 1024 | $3,622 | $3.54 | 6d | 2 | 0.60mi |
| 1007 Lincoln Blvd Santa Monica, CA | 2.0 | 2.0 | 1000 | $3,395 | $3.40 | 25d | 1 | 0.61mi |
| 1244 Euclid St Apt 7 Santa Monica, CA | 1.0 | 1.0 | 799 | $2,695 | $3.37 | 8d | 1 | 0.61mi |
| 1044 9th St Unit 3 Santa Monica, CA | 2.0 | 2.0 | 1000 | $3,995 | $4.00 | 6d | 1 | 0.61mi |
| 1144 10th St #5 Santa Monica, CA | 2.0 | 2.0 | 1011 | $4,850 | $4.80 | 11d | 1 | 0.62mi |
Listing history 36 events
-
2026-06-18days on market $3,250,000 Active 77 DOM
-
2026-06-17days on market $3,250,000 Active 76 DOM
-
2026-06-16days on market $3,250,000 Active 75 DOM
-
2026-06-15days on market $3,250,000 Active 74 DOM
-
2026-06-13days on market $3,250,000 Active 72 DOM
-
2026-06-13days on market $3,250,000 Active 71 DOM
-
2026-06-09days on market $3,250,000 Active 68 DOM
-
2026-06-08days on market $3,250,000 Active 67 DOM
-
2026-06-07days on market $3,250,000 Active 66 DOM
-
2026-06-04days on market $3,250,000 Active 63 DOM
-
2026-06-03days on market $3,250,000 Active 62 DOM
-
2026-06-02days on market $3,250,000 Active 61 DOM
-
2026-06-01days on market $3,250,000 Active 60 DOM
-
2026-05-31days on market $3,250,000 Active 59 DOM
-
2026-04-22price $3,250,000 1023-char remark
Show marketing remark (1023 chars)
Located just off Montana Avenue in one of Santa Monica's most desirable and supply-constrained residential corridors, 817 16th Street presents a rare opportunity to acquire a fully entitled boutique, architectural townhouse-style condominium project in a high-demand neighborhood. The project is comprised of six market-rate residences plus two affordable units, over subterranean parking for ten vehicles and a formally approved subdivision tract map. Designed by Breakform Design, the plans reflect a refined, contemporary architectural vision aligned with the expectations of today's luxury Westside buyer. With Planning Commission approvals secured and the property removed from the rental market via the Ellis Act, a developer can step in and pivot directly into construction documents and plan check. A substantial portion of the entitlement timeline has been completed, creating a streamlined path to market and a compelling opportunity to capitalize on strong end-user demand in a premier Montana-adjacent location.
-
2026-04-02$3,750,000 Active 1023-char remark
Show marketing remark (1023 chars)
Located just off Montana Avenue in one of Santa Monica's most desirable and supply-constrained residential corridors, 817 16th Street presents a rare opportunity to acquire a fully entitled boutique, architectural townhouse-style condominium project in a high-demand neighborhood. The project is comprised of six market-rate residences plus two affordable units, over subterranean parking for ten vehicles and a formally approved subdivision tract map. Designed by Breakform Design, the plans reflect a refined, contemporary architectural vision aligned with the expectations of today's luxury Westside buyer. With Planning Commission approvals secured and the property removed from the rental market via the Ellis Act, a developer can step in and pivot directly into construction documents and plan check. A substantial portion of the entitlement timeline has been completed, creating a streamlined path to market and a compelling opportunity to capitalize on strong end-user demand in a premier Montana-adjacent location.
-
2020-09-21Active
-
2020-06-14historical Expired
-
2020-04-14price
-
2020-04-14Active
-
2020-04-03historical Canceled
-
2020-02-24Active
-
2018-10-10soldstatus $2,525,000
-
2018-10-10soldstatus $2,525,000
-
2018-08-07historical
-
2018-07-01$2,600,000
-
2018-07-01$2,600,000
-
2018-04-21status Pending
-
2018-04-20historical
-
2018-01-25Active
-
2018-01-25historical Expired
-
2018-01-25$2,750,000
-
2013-09-09soldstatus $2,125,000 Closed
-
2013-09-09soldstatus $2,125,000
-
2013-08-23status Pending
-
2013-08-01$1,795,000 Active
ⓘ Source: listings_history table (triggers on properties + properties_extension) + one-shot
backfill from property_details.listing_events for pre-trigger history.
Tax reassessment forecast CA · Resets to sale price
- Current annual tax
- $35,728 · $2,977/mo
- Projected year-2 tax
- $35,728 · $2,977/mo
- Expected delta
- $0/yr ($0/mo · 0.0%)
ⓘ Screening estimate from a state-policy table — verify with the county assessor before closing.
Climate risk First Street
- Flood 1/10 Low FEMA zone X (unshaded) · 0% chance over 30 yrs
- Wildfire 1/10 Low
- Heat 6/10 Major 7 d/yr ≥83°F today · 20 d/yr by 30 yrs out
- Wind 1/10 Low
- Air quality 4/10 Moderate 5 unhealthy d/yr today · 6 by 30 yrs out
Nearby sold comps map
Loading sold comps map…
Walkable amenities ~0.75 mi
Loading nearby amenities…
Taxation est. · year 1
- Rental income
- $353,256
- − Mortgage interest
- −$182,051
- − Property taxes
- −$35,728
- − Insurance
- −$16,250
- − Repairs & maintenance
- −$28,260
- − Management
- −$28,260
- − Depreciation
- −$94,545
- Taxable loss
- −$31,839
- Est. tax savings @ 24.0%
- +$7,641
- After-tax cash flow
- $30,215/yr
For passive investors: Depreciation is non-cash, so a rental often shows a tax loss while cash-flowing — sheltering income. Rental losses are passive: they offset passive income freely, and up to $25,000/yr can offset ordinary (W-2) income if you actively participate and your MAGI is under $100k (phasing out to $0 by $150k); unused losses carry forward. On sale, claimed depreciation is recaptured at up to 25%, and gains may owe capital-gains tax (a 1031 exchange can defer both). Figures are a year-1 estimate at your 24.0% rate — not tax advice; consult a CPA.
Schools (NCES district)
- District
- Santa Monica-Malibu Unified
- NCES district ID
- 0635700
- Math proficiency
- 61% ▬ 0.00%
- Reading proficiency
- 74% ▬ 0.00%
- Median HH income
- $81,489
- Composite
- 61.58/100
- National rank
- #1535
- State rank
- #123 of 1400 in CA
Livability — Santa Monica
- Score
- 72/100
- State rank
- #178
- US rank
- #5878
Category grades
Schools grade is shown separately in the Schools card above.
Census & demographics
- Census place
- Santa Monica, CA
- County
- Los Angeles County · 9,444,647 people
- City population
- 93,581
- Metro
- Los Angeles-Long Beach-Anaheim, CA
- Population (ZIP)
- 23,867
- Household income
- $121,925
- Rent vs Own
- Severe rent burden
- 2265.0
Population outlook (Los Angeles County) Hauer SSP2
- Today (2025)
- 10,940,515 people
- By 2030
- 11,256,481 · +2.9%
- By 2040
- 11,729,929 · +7.2%
- By 2050
- 11,948,407 · +9.2%
- By 2075
- 11,818,114 · +8.0%
- By 2100
- 10,842,928 · -0.9%
Race, ethnicity, and origin ACS 2023
- Neighborhood character
- Predominantly White (67%)
- Race & ethnicity
- White 67% Hispanic / Latino 12% Two or more races 12% Asian 11% Black 2%
- Hispanic origin (detail)
- Mexican 9%
- Common ancestry
- Italian 7% Romanian 5% Scotch-Irish 4%
- Foreign-born
- 24% · Canada, China, Dominican Republic
- Languages at home
- 75% English-only · Spanish 8% Other Indo-European 6% Russian/Polish/Slavic 4%
Political lean MEDSL · Los Angeles
- 2024 margin
- Solid D (+32.9) · D 64.8% · R 31.9% · Other 3.3%
- 2008→2024 swing
- -7.4pp toward R · 2008: 40.4pp · 2024: 32.9pp
- All cycles
- 2024: D+32.9 2020: D+44.2 2016: D+48.0 2012: D+40.0 2008: D+40.4
Not yet ingested
- Civics
- —
Market trends
- HPI YoY
- ▼ -0.10%
- Current HPI
- 310.2427
- Rent YoY
- ▼ -0.07%
- Metro
- Los Angeles-Long Beach-Anaheim, CA
- State GDP YoY
- ▲ 3.21%
- F500 in state
- 116
Industry mix (Fortune 500 HQ in CA)
| Industry | F500 HQs | Revenue |
|---|---|---|
| Technology | 27 | $1,492B |
|
||
| Financial Services | 3 | $174B |
|
||
| Retail | 3 | $44B |
|
||
| Insurance | 3 | $26B |
|
||
| Media / Entertainment | 2 | $115B |
|
||
| Pharmaceuticals / Biotech | 2 | $62B |
|
||
Price history
+81.1% since first listed22 events — show timeline
- 2026-04-22 Price Changed $3,250,000 TheMLS
- 2026-04-02 Listed $3,750,000 TheMLS
- 2020-09-21 Listed — TheMLS
- 2020-06-14 Delisted — TheMLS
- 2020-04-14 Price Changed — TheMLS
- 2020-04-14 Listed — TheMLS
- 2020-04-03 Delisted — TheMLS
- 2020-02-24 Listed — TheMLS
- 2018-10-10 Sold (MLS) $2,525,000 SDMLS
- 2018-10-10 Sold (MLS) $2,525,000 TheMLS
- 2018-08-07 Delisted — TheMLS
- 2018-07-01 Listed $2,600,000 SDMLS
- 2018-07-01 Listed $2,600,000 TheMLS
- 2018-04-21 Pending — TheMLS
- 2018-04-20 Listing Removed — SDMLS
- 2018-01-25 Listed $2,750,000 SDMLS
- 2018-01-25 Delisted — TheMLS
- 2018-01-25 Listed — TheMLS
- 2013-09-09 Sold (Public Records) $2,125,000 Public Records
- 2013-09-09 Sold (MLS) $2,125,000 TheMLS
- 2013-08-23 Pending — TheMLS
- 2013-08-01 Listed $1,795,000 TheMLS
Property tax history
+18.4%/yrLatest (2025): $35,728 · +6.5% YoY. Source: county tax records.
Cash-flow waterfall
monthlySold comps — $/sqft
last 12 mo · ≤1 miLoading sold comps…