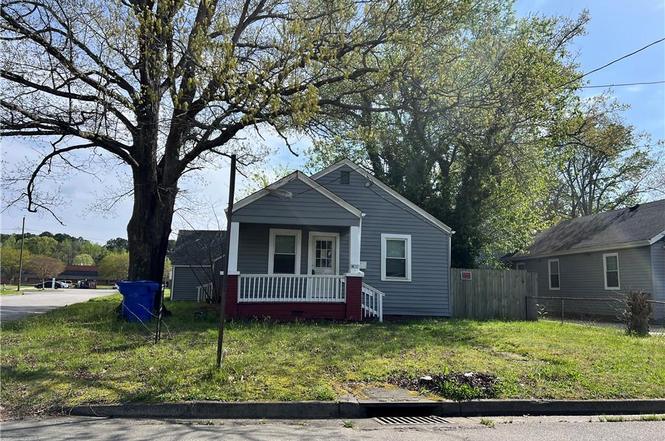
16 Rex Ave · Portsmouth, VA
Flood risk 5/10 · Moderate
- FEMA flood zone
- AE
- Chance of flooding over 30 yrs
- 0.43%
- Est. flood insurance / yr
- $1,737 – $8,500
Fire risk 1/10 · Minimal
- Est. fire insurance / yr
- $666 – $1,236
Heat risk 9/10 · Severe
- Hot days now (above 106°F)
- 7 days/yr
- Hot days in 30 yrs
- 16 days/yr
Wind risk 8/10 · Major
- Chance of severe wind over 30 yrs
- 80.0%
Air-quality risk 5/10 · Moderate
- Unhealthy air days now
- 6 days/yr
- Unhealthy air days in 30 yrs
- 7 days/yr
Risk factors via First Street. Map © Google.
Why this score? — see what drove the A grade
The composite is a weighted blend of 9 inputs, each scored 0–100. Each bar is that input's sub-score; the figure is the points it added to the 100-point composite (weight × sub-score).
- Cash flow +30.0/30.0
- ARV discount +15.0/15.0
- DSCR +10.0/10.0
- Appreciation +10.0/10.0
- 1% rule +9.1/10.0
- Schools +3.9/10.0
- Livability +3.7/5.0
- Rent growth +3.5/5.0
- Condition / age +2.5/5.0
$158,900
🖨 Deal sheet 📄 Offer letter ✓ Due diligence
Listing remarks
Check out this house with 4 bedrooms and 2 baths. In addition, the home is convenient to interstates, bases, beaches, shopping, and more. Short sale being professionally handled; home to be sold as-is.
Key facts
- Convenient to bases
- 2 parking spots
- Built 1952
Tags
Property features AI
Finance
- Other:
- Financial info:
- HOA & community: No HOA fees
Exterior
- Parking: Off-street parking; Driveway spaces (2 total)
- Security:
- Utilities: City/County water; City/County sewer; Electric water heater
- Home design: Detached ranch; Single-story; Crawl foundation; Simple ownership
- Construction: Vinyl siding; Asphalt shingle roof
- Exterior features: Corner lot; Back yard fenced with wood fence
Interior
- Kitchen:
- Bedrooms: Master bedroom on the first floor; First floor bedroom
- Flooring: Carpet; Laminate
- Bathrooms: 1 full bathroom; 1 half bathroom; Bedroom and full bathroom on the first floor
- Heating & cooling: Heat pump heating; Electric heating; Central air conditioning
- Interior features: Walk-in closet
- Laundry & utility: Washer hookup; Dryer hookup
Neighborhood map
What this means for you Summary
Snapshot
- This is a 4-bed/1.5-bath single-family listed at $159k.
Deal economics
- At list price, monthly cash flow is $239 ($3k/yr) — positive.
- The deal already cash-flows at list — no discount required.
- Meets the 1% rule at list price ($2k rent vs $159k).
- Recommended offer: $140k (12.0% below list) — sets the bar for market timing.
- Cap rate 11.3% vs local median 4.6% in Portsmouth — top-decile yield for the area; either an underpriced asset or a hidden risk that comps aren't pricing in. Stress-test before assuming the spread holds.
Location & tenants
- Location reads 73/100 on livability (#172 in VA) — a middle-class / working-renter tenant base. Strengths: amenities A+, cost of living A+, housing A+; Watch: employment C-, crime F, commute F.
- Portsmouth City Public School District (urban): math 34% / reading 58% proficiency, ranked #107 of 131 in VA (top 82%) — families likely to look elsewhere, expect single-tenant / working-renter base with shorter leases.
- Market conditions: Rents rising (+4.0%/yr); 64 active listings in the ZIP; 6 comparable units currently listed for rent nearby; rentals at typical pace (median 24d on market — plan ~3-4 weeks tenant-placement turnaround); 300 units permitted in Portsmouth city in 2024 (112 in 5+ unit buildings).
- At $2,245/mo this rent would consume 55% of the median local household income ($49k/yr) (locally 534% of renters already pay >50% of income on rent) — very limited rent-growth headroom before tenants either downsize or default.
Forward outlook
- In year one you build about $17k of equity ($1k loan paydown + $16k appreciation (10.0% local appreciation)).
- At projected returns (10.0% appreciation + 4.0% rent growth), your $44k cash investment doubles in ~3 years — after that, you're playing with house money.
- By year 3, paydown + projected appreciation supports a ~$43k cash-out refi (75% LTV) — recoverable capital for the next deal without selling this one.
Negotiation context
- It's been on market 160 days — a 12% lower offer ($140k) is reasonable based on typical stale-listing flexibility.
- 10 sale attempts since 7y ago; this cycle's ask is 6% above the opening price — seller raised mid-cycle; expect resistance to lowballs.
Risks & watch-outs
- Watch-outs: flood insurance adds $427/mo; built in 1952 — expect roof / HVAC / electrical / plumbing capex.
- Climate carrying-cost: in FEMA flood zone AE (mandatory federal flood insurance); severe wind risk, 80% chance of damaging wind over 30y; extreme-heat days projected 7→16/yr by 2055 (HVAC capex compounding) — expect insurance premiums to compound above CPI over the hold.
Questions for the listing agent
- It's been on market 160 days. Have you received any prior offers? Is the seller open to a 12% concession, seller financing, or rate buy-down credit?
- Built in 1952 — when were the roof, HVAC, electrical panel, plumbing, and water heater last replaced?
- What's the actual annual flood-insurance premium (NFIP or private), and is the property in a SFHA with mandatory coverage?
- Why hasn't it sold? Are there any deal-killer items the seller is aware of (foundation, flood, title, zoning, code violations)?
- Is there a deadline driving the sale (1031 exchange, divorce, estate, relocation)? That informs how much negotiation room exists.
- Schools are B-rated — typically a magnet for longer-tenancy family renters. What's the average tenant stay here, and is there a school-zone premium baked into asking?
- Crime grade is F in this area — have there been break-ins, vandalism, or insurance claims at this property in the last 3 years? What carrier currently insures it and at what premium?
- What's the average days-on-market for RENTAL listings here right now (not sales)? A rising rental-DOM trend means longer vacancies and softer asking-rent achievability than the comps imply.
- What's the recent tenant-quality profile in this submarket — average credit score on applications, eviction rate, late-payment / NSF rate, and stable-employment percentage? A property-management company in the area should have these aggregated.
- How much new for-sale + rental construction is in the pipeline within 1–3 miles? Heavy new supply typically softens prices + rents 12–24 months out; constrained supply supports both.
Investment metrics
- 1% rule
- 1.41% ✓
- Cap rate
- 11.32%
- Cash-on-cash
- 17.96%
- DSCR
- 1.80
- GRM
- 5.9
CMA / ARV
- ARV (on-the-fly)
- $217,300
- Comps found
- 12
Show comp detail 12 sales within ~0.75 mi
| Address | Dist | Beds/Ba | Sqft | Sold | Price | $/sf | Match |
|---|---|---|---|---|---|---|---|
| 100 Dahlgren Ave Unit B | 0.05mi | 3/1.0 (-1) | 1,078 (+2%) | 1mo | $194,700 | $181 | 87 |
| 132 Afton Pkwy | 0.29mi | 3/2.0 (-1) | 1,056 (-0%) | 3mo | $244,900 | $232 | 76 |
| 12 Oakcrest St | 0.23mi | 3/1.0 (-1) | 1,115 (+5%) | 3mo | $120,000 | $108 | 71 |
| 93 Nicholson St | 0.15mi | 3/1.5 (-1) | 1,200 (+13%) | 7mo | $221,500 | $185 | 60 |
| 14 Woodland St | 0.60mi | 3/2.0 (-1) | 1,040 (-2%) | 7mo | $240,000 | $231 | 56 |
| 171 Gillis Rd | 0.61mi | 3/2.0 (-1) | 1,040 (-2%) | 9mo | $240,000 | $231 | 54 |
| 25 Fiske St | 0.49mi | 3/1.5 (-1) | 1,148 (+8%) | 6mo | $235,000 | $205 | 53 |
| 5 Rodgers Pl | 0.67mi | 3/1.0 (-1) | 1,072 (+1%) | 9mo | $223,000 | $208 | 52 |
| 59 Bainbridge Ave | 0.36mi | 3/1.0 (-1) | 1,214 (+14%) | 3mo | $120,000 | $99 | 50 |
| 3 Prospect Pkwy | 0.47mi | 3/2.0 (-1) | 1,216 (+15%) | 2mo | $126,000 | $104 | 45 |
| 1512 Boxwood Dr | 0.72mi | 3/2.0 (-1) | 1,208 (+14%) | 2mo | $365,000 | $302 | 34 |
| 1905 Redgate Dr | 0.64mi | 3/1.0 (-1) | 920 (-13%) | 8mo | $175,000 | $190 | 34 |
Match score weights: distance 35% · size 25% · config 20% · recency 20%. Top-matched comps best support the ARV.
Projected returns pro-forma
10.0% appreciation · 3.97% rent growth · sell at horizon
- IRR
- 29.6%
- Equity multiple
- 3.34×
- Total profit
- $104,299
- Equity at exit
- $143,150
- IRR
- 26.1%
- Equity multiple
- 7.75×
- Total profit
- $300,428
- Equity at exit
- $308,708
Cash invested: $44,492 (down + closing). Projections, not guarantees.
Landlord ↔ Tenant lean methodology
- Overall (STATE)
- 55 Moderately Landlord-Leaning
- State Virginia
- 55 Moderately Landlord-Leaning · D+2
- County
- — inherits STATE
- City
- — inherits STATE
ZIP-level market 23702
- Home prices YoY
- 5.2%
- Rents YoY
- 4.0%
- Active inventory
- 64
- Price-to-rent
- 5.9×
Monthly cashflow live
- Estimated rent
- $2,245 high interval (Pro) →
- Mortgage (P&I)
- −$833
- Tax from tax record
- −$208 /mo · $2,502/yr
- Insurance
- −$66
- Flood insurance flood zone
- −$427 /mo · $5,118/yr
- HOA
- −$0
- Vacancy / Maint / Mgmt
- −$472
- Net cashflow
- $239
Break-even live
UW: 25.0% down · 7.5% · 30yr · 1.5% tax · 5.0% vac · 8.0% maint · 8.0% mgmt
Financing live
Cash to close
- Down payment
- $39,725
- Closing costs
- $4,767
- Reserves months
- —
- Total cash needed
- —
Loan-product check · same deal, 3 products live
Conventional
25% down · 7.5% · 30yr
- Down + closing
- —
- Monthly P&I
- —
- Monthly cashflow
- —
- DSCR
- —
- Eligible?
- —
Personal DTI + credit; lowest rate.
DSCR
20% down · 8.5% · 30yr
- Down + closing
- —
- Monthly P&I
- —
- Monthly cashflow
- —
- DSCR
- —
- Eligible?
- —
No personal income docs; deal must DSCR.
Hard money
10% down · 12.0% · 12mo
- Down + closing
- —
- Monthly P&I
- —
- Monthly cashflow
- —
- DSCR
- —
- Eligible?
- —
Short-term bridge; refi at stabilization.
Rent comps 6 comps
| Address | Beds | Baths | Sqft | Rent | $/sqft | DOM | Units | Dist |
|---|---|---|---|---|---|---|---|---|
| 134 Monmouth St Portsmouth, VA | 3.0 | 2.5 | 1440 | $2,450 | $1.70 | 43d | 1 | 0.83mi |
| 35 Fairview Cir S Portsmouth, VA | 4.0 | 1.5 | 1462 | $2,100 | $1.44 | 12d | 1 | 1.18mi |
| 2750 Greenwood Dr Portsmouth, VA | 3.0 | 2.0 | 1200 | $1,700 | $1.42 | 23d | 1 | 1.32mi |
| 251 Independence St Portsmouth, VA | 3.0 | 2.5 | 1294 | $2,550 | $1.97 | 23d | 1 | 1.44mi |
| 1314 Summit Ave Portsmouth, VA | 3.0 | 1.5 | 1152 | $1,750 | $1.52 | 43d | 1 | 1.44mi |
| 213 Beacon Rd Portsmouth, VA | 3.0 | 2.0 | 1280 | $2,300 | $1.80 | 23d | 1 | 1.48mi |
Listing history 42 events
-
2026-06-16statusdays on market $158,900 Under Contract 160 DOM
-
2026-06-15days on market $158,900 Active Under Contract 159 DOM
-
2026-06-13days on market $158,900 Active Under Contract 157 DOM
-
2026-06-09days on market $158,900 Active Under Contract 153 DOM
-
2026-06-08days on market $158,900 Active Under Contract 152 DOM
-
2026-06-07days on market $158,900 Active Under Contract 151 DOM
-
2026-06-03days on market $158,900 Active Under Contract 147 DOM
-
2026-06-02days on market $158,900 Active Under Contract 146 DOM
-
2026-06-01days on market $158,900 Active Under Contract 145 DOM
-
2026-05-31days on market $158,900 Active Under Contract 144 DOM
-
2026-04-22historical Active Under Contract
-
2026-04-13price $158,900
-
2026-04-13status Active
-
2026-01-12historical Active Under Contract
-
2026-01-07$150,000 Active
-
2025-10-16historical
-
2025-09-24price $180,800
-
2025-06-27price $180,900
-
2025-06-19status Active
-
2025-04-25historical Active Under Contract
-
2025-04-10$150,000 Active
-
2021-12-06soldstatus $189,900
-
2021-11-15status Under Contract
-
2021-11-03historical Active Under Contract
-
2021-10-21$189,900 Active
-
2021-10-21historical
-
2021-10-05price $193,900
-
2021-09-17status Active
-
2021-09-17price $200,000
-
2021-08-16historical Active Under Contract
-
2021-08-12price $189,900
-
2021-08-11$199,900 Active
-
2020-06-05status Under Contract
-
2020-06-02status Active
-
2020-05-31historical
-
2020-01-21historical Active Under Contract
-
2020-01-16$29,900 Active
-
2019-08-19historical
-
2019-07-02price $89,900
-
2019-05-20price $99,000
-
2019-04-19$109,000 Active
-
2005-09-28soldstatus $92,000
ⓘ Source: listings_history table (triggers on properties + properties_extension) + one-shot
backfill from property_details.listing_events for pre-trigger history.
Tax reassessment forecast VA · Resets to sale price
- Current annual tax
- $2,502 · $208/mo
- Projected year-2 tax
- $2,502 · $208/mo
- Expected delta
- $0/yr ($0/mo · 0.0%)
ⓘ Screening estimate from a state-policy table — verify with the county assessor before closing.
Climate risk First Street
- Flood 5/10 Major FEMA zone AE · 43% chance over 30 yrs
- Wildfire 1/10 Low
- Heat 9/10 Extreme 7 d/yr ≥106°F today · 16 d/yr by 30 yrs out
- Wind 8/10 Severe 80% chance of damaging wind over 30 yrs
- Air quality 5/10 Major 6 unhealthy d/yr today · 7 by 30 yrs out
Nearby sold comps map
Loading sold comps map…
Walkable amenities ~0.75 mi
Loading nearby amenities…
Taxation est. · year 1
- Rental income
- $26,945
- − Mortgage interest
- −$8,901
- − Property taxes
- −$2,502
- − Insurance
- −$5,913
- − Repairs & maintenance
- −$2,156
- − Management
- −$2,156
- − Depreciation
- −$4,623
- Taxable income
- $695
- Est. tax owed @ 24.0%
- −$167
- After-tax cash flow
- $2,705/yr
For passive investors: Depreciation is non-cash, so a rental often shows a tax loss while cash-flowing — sheltering income. Rental losses are passive: they offset passive income freely, and up to $25,000/yr can offset ordinary (W-2) income if you actively participate and your MAGI is under $100k (phasing out to $0 by $150k); unused losses carry forward. On sale, claimed depreciation is recaptured at up to 25%, and gains may owe capital-gains tax (a 1031 exchange can defer both). Figures are a year-1 estimate at your 24.0% rate — not tax advice; consult a CPA.
Schools (NCES district)
- District
- Portsmouth City Public School District
- NCES district ID
- 5103000
- Math proficiency
- 34% ▼ -40.00%
- Reading proficiency
- 58% ▼ -12.00%
- Median HH income
- $46,152
- Composite
- 39.01/100
- National rank
- #4071
- State rank
- #107 of 131 in VA
Livability — Portsmouth
- Score
- 73/100
- State rank
- #172
- US rank
- #5381
Category grades
Schools grade is shown separately in the Schools card above.
Census & demographics
- Census place
- Portsmouth, VA
- County
- Portsmouth City · 96,366 people
- City population
- 96,366
- Metro
- Virginia Beach-Norfolk-Newport News, VA-NC
- Population (ZIP)
- 12,485
- Household income
- $48,835
- Rent vs Own
- Severe rent burden
- 534.0
Population outlook (Portsmouth County) Hauer SSP2
- Today (2025)
- 96,730 people
- By 2030
- 96,760 · +0.0%
- By 2040
- 96,573 · -0.2%
- By 2050
- 95,606 · -1.2%
- By 2075
- 93,579 · -3.3%
- By 2100
- 83,756 · -13.4%
Race, ethnicity, and origin ACS 2023
- Neighborhood character
- Diverse neighborhood (Simpson 0.62)
- Race & ethnicity
- Black 50% White 35% Two or more races 9% Hispanic / Latino 8%
- Hispanic origin (detail)
- Mexican 2% Puerto Rican 3%
- Common ancestry
- Lithuanian 1% Italian 1% Slovak 1%
- Foreign-born
- 4% · Canada, South Korea
- Languages at home
- 95% English-only · Spanish 4%
Political lean MEDSL · Portsmouth
- 2024 margin
- Solid D (+38.6) · D 68.6% · R 30.0% · Other 1.4%
- 2008→2024 swing
- -0.7pp no change · 2008: 39.3pp · 2024: 38.6pp
- All cycles
- 2024: D+38.6 2020: D+40.8 2016: D+36.5 2012: D+39.6 2008: D+39.3
Not yet ingested
- Civics
- —
Market trends
- HPI YoY
- ▲ 16.70%
- Current HPI
- 340.0817
- Rent YoY
- ▲ 3.97%
- Metro
- Virginia Beach-Norfolk-Newport News, VA-NC
- State GDP YoY
- ▲ 2.40%
- F500 in state
- 50
Industry mix (Fortune 500 HQ in VA)
| Industry | F500 HQs | Revenue |
|---|---|---|
| Aerospace / Defense | 4 | $236B |
|
||
| Technology / Defense | 3 | $32B |
|
||
| Financial Services | 2 | $176B |
|
||
| Utilities | 2 | $27B |
|
||
| Insurance | 2 | $25B |
|
||
| Technology | 2 | $15B |
|
||
Price history
+72.7% since first listed32 events — show timeline
- 2026-04-22 Contingent — REINMLS
- 2026-04-13 Price Changed $158,900 REINMLS
- 2026-04-13 Relisted — REINMLS
- 2026-01-12 Contingent — REINMLS
- 2026-01-07 Listed $150,000 REINMLS
- 2025-10-16 Listing Removed — REINMLS
- 2025-09-24 Price Changed $180,800 REINMLS
- 2025-06-27 Price Changed $180,900 REINMLS
- 2025-06-19 Relisted — REINMLS
- 2025-04-25 Contingent — REINMLS
- 2025-04-10 Listed $150,000 REINMLS
- 2021-12-06 Sold (Public Records) $189,900 Public Records
- 2021-11-15 Pending — REINMLS
- 2021-11-03 Contingent — REINMLS
- 2021-10-21 Listing Removed — REINMLS
- 2021-10-21 Listed $189,900 REINMLS
- 2021-10-05 Price Changed $193,900 REINMLS
- 2021-09-17 Relisted — REINMLS
- 2021-09-17 Price Changed $200,000 REINMLS
- 2021-08-16 Contingent — REINMLS
- 2021-08-12 Price Changed $189,900 REINMLS
- 2021-08-11 Listed $199,900 REINMLS
- 2020-06-05 Pending — REINMLS
- 2020-06-02 Relisted — REINMLS
- 2020-05-31 Listing Removed — REINMLS
- 2020-01-21 Contingent — REINMLS
- 2020-01-16 Listed $29,900 REINMLS
- 2019-08-19 Listing Removed — REINMLS
- 2019-07-02 Price Changed $89,900 REINMLS
- 2019-05-20 Price Changed $99,000 REINMLS
- 2019-04-19 Listed $109,000 REINMLS
- 2005-09-28 Sold (Public Records) $92,000 Public Records
Property tax history
+3.7%/yrLatest (2025): $2,502 · +1.4% YoY. Source: county tax records.
Cash-flow waterfall
monthlySold comps — $/sqft
last 12 mo · ≤1 miLoading sold comps…