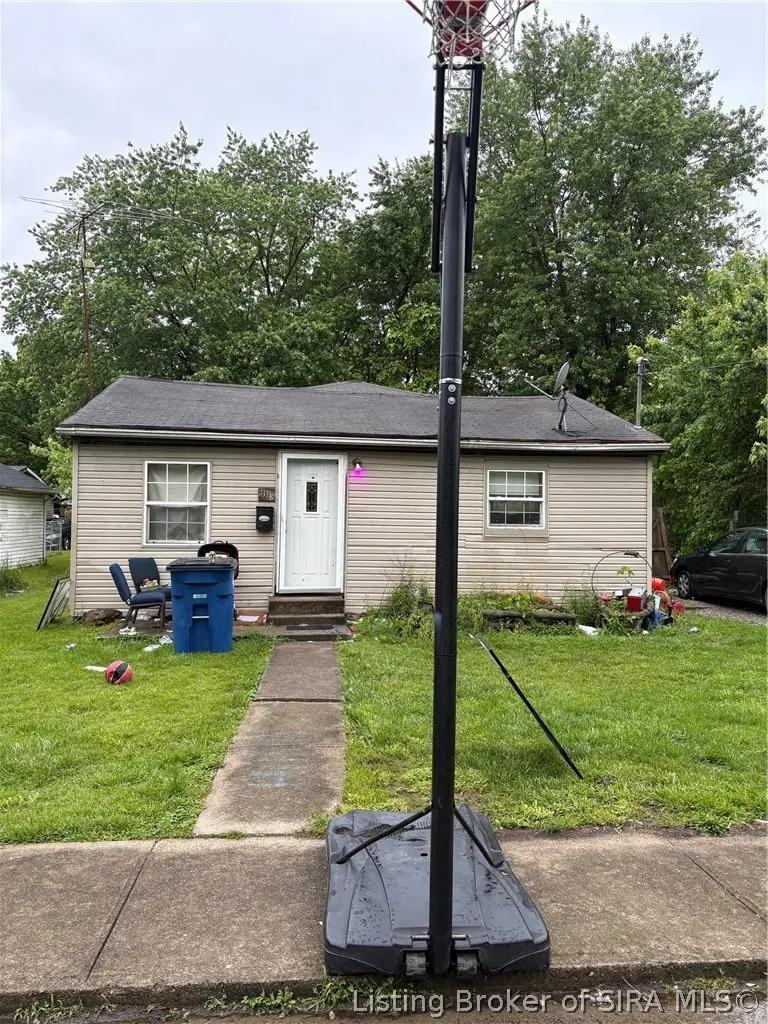
1118 Wade St · Austin, IN
Flood risk 1/10 · Minimal
- FEMA flood zone
- X (unshaded)
- Chance of flooding over 30 yrs
- 0.0%
- Est. flood insurance / yr
- $507 – $1,088
Fire risk 1/10 · Minimal
- Est. fire insurance / yr
- $717 – $1,331
Heat risk 5/10 · Moderate
- Hot days now (above 104°F)
- 7 days/yr
- Hot days in 30 yrs
- 19 days/yr
Wind risk 2/10 · Minimal
- Chance of severe wind over 30 yrs
- 1.0%
Air-quality risk 2/10 · Minimal
- Unhealthy air days now
- 0 days/yr
- Unhealthy air days in 30 yrs
- 1 days/yr
Risk factors via First Street. Map © Google.
Why this score? — see what drove the B- grade
The composite is a weighted blend of 9 inputs, each scored 0–100. Each bar is that input's sub-score; the figure is the points it added to the 100-point composite (weight × sub-score).
- Cash flow +30.0/30.0
- 1% rule +10.0/10.0
- DSCR +10.0/10.0
- ARV discount +7.5/15.0
- Livability +3.0/5.0
- Rent growth +2.5/5.0
- Condition / age +2.5/5.0
- Schools +1.7/10.0
- Appreciation +0.0/10.0
$35,000
🖨 Deal sheet (PDF) 📄 Offer letter ✓ Due diligence
Listing remarks MLS
Investment opportunity at 1118 Wade St in Austin, Indiana! This 3 bedroom, 1 bathroom home offers approximately 1,176 square feet and is now VACANT! Built in 1950, the property has had some floor joists replaced by the seller and the home does include an electric HVAC system. This home is being sold AS-IS at closing. Seller is motivated and prefers cash offers. Great opportunity to add to your investment portfolio!
Key facts
- 7,405 sq ft lot
- Built 1950
- Listed 4 days
Property features AI
Exterior
- Parking: Gravel parking
- Utilities: Public water; Municipal sewer
- Home design: Single-family residence; One story; Fixer condition
- Construction: Vinyl siding; Block foundation
- Exterior features: Lot smaller than 1/4 acre (approximately 0.17 acre)
Interior
- Kitchen: Kitchen (12 x 10)
- Bedrooms: 3 bedrooms on the main level
- Bathrooms: 1 full bathroom
- Heating & cooling: Electric forced-air heating; Central air conditioning
- Interior features: Attic access
- Laundry & utility: Laundry area (other)
Neighborhood map
What this means for you Summary
Snapshot
- This is a 3-bed/1.0-bath single-family listed at $35k.
Deal economics
- At list price, monthly cash flow is $494 ($6k/yr) — positive.
- The deal already cash-flows at list — no discount required.
- Meets the 1% rule at list price ($928 rent vs $35k).
- Cap rate 23.2% vs local median 4.2% in Austin — top-decile yield for the area; either an underpriced asset or a hidden risk that comps aren't pricing in. Stress-test before assuming the spread holds.
Location & tenants
- Location reads 60/100 on livability (#523 in IN) — a middle-class / working-renter tenant base. Strengths: crime A+, cost of living A+; Watch: health & safety D, amenities F, commute F.
- Scott County School District 1 (town): math 16% / reading 26% proficiency, ranked #274 of 301 in IN (top 91%) — low school quality limits family demand, transient renter base, plan for 1-2y turnover; 63% free/reduced lunch — lower-income household profile, screen leases tightly.
- Zoned schools: Austin Elementary School (math 23% / reading 20%, grade F, #803 of 994 statewide, top 81%, 612 students, 64% FRL); Austin Middle School (math 10% / reading 26%, grade F, #279 of 330 statewide, top 86%, 275 students, 56% FRL); Austin High School (math 12% / reading 47%, grade F, #308 of 369 statewide, top 84%, 432 students, 52% FRL).
- Market conditions: 54 active listings in the ZIP; 2 comparable units currently listed for rent nearby; 73 units permitted in Scott County in 2024 (0 in 5+ unit buildings).
Forward outlook
- Local home prices are declining (-3.0%/yr); year-one equity from $242 of loan paydown is wiped out by about $1k of value loss. Plan a longer hold.
- Scott County population projected at -23% by 2050 — secular population decline; favor cash flow + early exit over multi-decade hold.
- At projected returns (-3.0% appreciation + 3.0% rent growth), your $10k cash investment doubles in ~2 years — after that, you're playing with house money.
Negotiation context
- Only 4 days on market — expect competitive offers; lowballing is unlikely to land.
- 2 sale attempts with the ask held roughly flat each time — persistent listings suggest the price (not the market) is what's stuck; bring a comps-based counter.
- Current owner paid $30k; 17% above their basis — modest negotiation headroom, anchor on the comps not their cost.
Risks & watch-outs
- Watch-outs: built in 1950 — expect roof / HVAC / electrical / plumbing capex.
- Climate carrying-cost: extreme-heat days projected 7→19/yr by 2055 (HVAC capex compounding) — expect insurance premiums to compound above CPI over the hold.
Questions for the listing agent
- Built in 1950 — when were the roof, HVAC, electrical panel, plumbing, and water heater last replaced?
- Is there a deadline driving the sale (1031 exchange, divorce, estate, relocation)? That informs how much negotiation room exists.
- Schools are F-rated, which usually means shorter tenancies and higher turnover. Who's the typical renter profile here, and what's been the actual vacancy rate?
- What's the average days-on-market for RENTAL listings here right now (not sales)? A rising rental-DOM trend means longer vacancies and softer asking-rent achievability than the comps imply.
- What's the recent tenant-quality profile in this submarket — average credit score on applications, eviction rate, late-payment / NSF rate, and stable-employment percentage? A property-management company in the area should have these aggregated.
- How much new for-sale + rental construction is in the pipeline within 1–3 miles? Heavy new supply typically softens prices + rents 12–24 months out; constrained supply supports both.
Investment metrics
- 1% rule
- 2.65% ✓
- Cap rate
- 23.23%
- Cash-on-cash
- 60.48%
- DSCR
- 3.69
- GRM
- 3.1
CMA / ARV
- ARV (median comp)
- $147,197
- List price
- $35,000
- Delta
- -66.10%
- Verdict
- UNDERPRICED
- Comps
- 20 within 1.0 mi
Show comp detail 12 sales within ~0.75 mi
| Address | Dist | Beds/Ba | Sqft | Sold | Price | $/sf | Match |
|---|---|---|---|---|---|---|---|
| 1118 Wade St | 0.00mi | 3/1.0 | 1,176 (0%) | 0mo | $30,000 | $26 | 100 |
| 733 Mann Ave | 0.28mi | 3/1.0 | 1,176 (0%) | 4mo | $105,000 | $89 | 84 |
| 639 Mann Ave | 0.07mi | 3/2.0 | 1,232 (+5%) | 2mo | $164,900 | $134 | 83 |
| 880 Mann Ave | 0.20mi | 3/2.0 | 1,104 (-6%) | 1mo | $159,900 | $145 | 76 |
| 1105 Pearl St | 0.14mi | 3/2.0 | 1,092 (-7%) | 6mo | $179,900 | $165 | 73 |
| 147 Paulanna Ave | 0.41mi | 3/2.0 | 1,117 (-5%) | 1mo | $169,600 | $152 | 68 |
| 560 North St | 0.13mi | 2/1.0 (-1) | 1,013 (-14%) | 1mo | $29,900 | $30 | 65 |
| 139 Factory Dr | 0.53mi | 3/2.0 | 1,218 (+4%) | 5mo | $185,000 | $152 | 61 |
| 37 Rural St | 0.53mi | 3/2.0 | 1,115 (-5%) | 3mo | $160,000 | $143 | 60 |
| 982 N Third St | 0.34mi | 3/2.0 | 1,340 (+14%) | 1mo | $184,900 | $138 | 56 |
| 96 Hill St | 0.49mi | 3/2.0 | 1,292 (+10%) | 4mo | $174,000 | $135 | 54 |
| 746 Goodin Dr | 0.32mi | 3/2.0 | 1,343 (+14%) | 5mo | $180,000 | $134 | 53 |
Match score weights: distance 35% · size 25% · config 20% · recency 20%. Top-matched comps best support the ARV.
Projected returns pro-forma
-3.0% appreciation · 3.0% rent growth · sell at horizon
- IRR
- 59.3%
- Equity multiple
- 3.63×
- Total profit
- $25,797
- Equity at exit
- $5,219
- IRR
- 64.0%
- Equity multiple
- 7.43×
- Total profit
- $63,018
- Equity at exit
- $3,026
Cash invested: $9,800 (down + closing). Projections, not guarantees.
Landlord ↔ Tenant lean methodology
- Overall (STATE)
- 90 Strongly Landlord-Friendly
- State Indiana
- 90 Strongly Landlord-Friendly · R+11
- County
- — inherits STATE
- City
- — inherits STATE
ZIP-level market 47102
- Home prices YoY
- -8.9%
- Active inventory
- 54
- Price-to-rent
- 3.1×
Monthly cashflow live
- Estimated rent
- $928 medium interval (Pro) →
- Mortgage (P&I)
- −$184
- Tax from tax record
- −$41 /mo · $490/yr
- Insurance
- −$15
- HOA
- −$0
- Vacancy / Maint / Mgmt
- −$195
- Net cashflow
- $494
Break-even live
Sensitivity live
| Price | -10% $514 | -5% $504 | +0% $494 | +5% $484 | +10% $474 |
|---|---|---|---|---|---|
| Rent | -10% $421 | -5% $457 | +0% $494 | +5% $531 | +10% $567 |
| Rate | -1.0pp $512 | -0.5pp $503 | base $494 | +0.5pp $485 | +1.0pp $476 |
UW: 25.0% down · 7.5% · 30yr · 1.5% tax · 5.0% vac · 8.0% maint · 8.0% mgmt
Financing live
Cash to close
- Down payment
- $8,750
- Closing costs
- $1,050
- Reserves months
- —
- Total cash needed
- —
Loan-product check · same deal, 3 products live
Conventional
25% down · 7.5% · 30yr
- Down + closing
- —
- Monthly P&I
- —
- Monthly cashflow
- —
- DSCR
- —
- Eligible?
- —
Personal DTI + credit; lowest rate.
DSCR
20% down · 8.5% · 30yr
- Down + closing
- —
- Monthly P&I
- —
- Monthly cashflow
- —
- DSCR
- —
- Eligible?
- —
No personal income docs; deal must DSCR.
Hard money
10% down · 12.0% · 12mo
- Down + closing
- —
- Monthly P&I
- —
- Monthly cashflow
- —
- DSCR
- —
- Eligible?
- —
Short-term bridge; refi at stabilization.
Rent comps 2 comps
| Address | Beds | Baths | Sqft | Rent | $/sqft | DOM | Units | Dist |
|---|---|---|---|---|---|---|---|---|
| 20 Red Oak Way Austin, IN | 2.0 | 2.0 | 1080 | $929 | $0.86 | 45d | 1 | 0.54mi |
| 527 W Cherry St Austin, IN | 2.0 | 1.0 | 1080 | $925 | $0.86 | 45d | 1 | 1.13mi |
Listing history 6 events
-
2026-06-01status $35,000 Pending 4 DOM
Show marketing remark (418 chars)
Investment opportunity at 1118 Wade St in Austin, Indiana! This 3 bedroom, 1 bathroom home offers approximately 1,176 square feet and is now VACANT! Built in 1950, the property has had some floor joists replaced by the seller and the home does include an electric HVAC system. This home is being sold AS-IS at closing. Seller is motivated and prefers cash offers. Great opportunity to add to your investment portfolio!
-
2026-06-01days on market $35,000 Active 4 DOM
Show marketing remark (418 chars)
Investment opportunity at 1118 Wade St in Austin, Indiana! This 3 bedroom, 1 bathroom home offers approximately 1,176 square feet and is now VACANT! Built in 1950, the property has had some floor joists replaced by the seller and the home does include an electric HVAC system. This home is being sold AS-IS at closing. Seller is motivated and prefers cash offers. Great opportunity to add to your investment portfolio!
-
2026-05-31days on market $35,000 Active 3 DOM
-
2026-05-31days on market $35,000 Active 2 DOM
-
2026-05-12price $49,900 522-char remark
Show marketing remark (418 chars)
Investment opportunity at 1118 Wade St in Austin, Indiana! This 3 bedroom, 1 bathroom home offers approximately 1,176 square feet and is now VACANT! Built in 1950, the property has had some floor joists replaced by the seller and the home does include an electric HVAC system. This home is being sold AS-IS at closing. Seller is motivated and prefers cash offers. Great opportunity to add to your investment portfolio!
-
2026-05-05$59,900 Active 522-char remark
Show marketing remark (418 chars)
Investment opportunity at 1118 Wade St in Austin, Indiana! This 3 bedroom, 1 bathroom home offers approximately 1,176 square feet and is now VACANT! Built in 1950, the property has had some floor joists replaced by the seller and the home does include an electric HVAC system. This home is being sold AS-IS at closing. Seller is motivated and prefers cash offers. Great opportunity to add to your investment portfolio!
ⓘ Source: listings_history table (triggers on properties + properties_extension) + one-shot
backfill from property_details.listing_events for pre-trigger history.
Tax reassessment forecast IN · Partial reset (capped growth)
- Current annual tax
- $490 · $41/mo
- Projected year-2 tax
- $490 · $41/mo
- Expected delta
- $0/yr ($0/mo · 0.0%)
ⓘ Screening estimate from a state-policy table — verify with the county assessor before closing.
Climate risk First Street
- Flood 1/10 Low FEMA zone X (unshaded) · 0% chance over 30 yrs
- Wildfire 1/10 Low
- Heat 5/10 Major 7 d/yr ≥104°F today · 19 d/yr by 30 yrs out
- Wind 2/10 Low 100% chance of damaging wind over 30 yrs
- Air quality 2/10 Low 0 unhealthy d/yr today · 1 by 30 yrs out
Nearby sold comps map
Loading sold comps map…
Walkable amenities ~0.75 mi
Loading nearby amenities…
Taxation est. · year 1
- Rental income
- $11,132
- − Mortgage interest
- −$1,961
- − Property taxes
- −$490
- − Insurance
- −$175
- − Repairs & maintenance
- −$891
- − Management
- −$891
- − Depreciation
- −$1,018
- Taxable income
- $5,707
- Est. tax owed @ 24.0%
- −$1,370
- After-tax cash flow
- $4,557/yr
For passive investors: Depreciation is non-cash, so a rental often shows a tax loss while cash-flowing — sheltering income. Rental losses are passive: they offset passive income freely, and up to $25,000/yr can offset ordinary (W-2) income if you actively participate and your MAGI is under $100k (phasing out to $0 by $150k); unused losses carry forward. On sale, claimed depreciation is recaptured at up to 25%, and gains may owe capital-gains tax (a 1031 exchange can defer both). Figures are a year-1 estimate at your 24.0% rate — not tax advice; consult a CPA.
Schools (NCES district)
- District
- Scott County School District 1
- NCES district ID
- 1809990
- Math proficiency
- 16% ▼ -21.00%
- Reading proficiency
- 26% ▼ -10.00%
- Median HH income
- $36,972
- Composite
- 17.46/100
- National rank
- #9062
- State rank
- #274 of 301 in IN
Livability — Austin
- Score
- 60/100
- State rank
- #523
- US rank
- #18774
Category grades
Schools grade is shown separately in the Schools card above.
Census & demographics
- Census place
- Austin, IN
- City population
- 6,647
- Population (ZIP)
- 6,647
Population outlook (Scott County) Hauer SSP2
- Today (2025)
- 22,525 people
- By 2030
- 21,609 · -4.1%
- By 2040
- 19,536 · -13.3%
- By 2050
- 17,370 · -22.9%
- By 2075
- 12,862 · -42.9%
- By 2100
- 9,340 · -58.5%
Race, ethnicity, and origin ACS 2023
- Neighborhood character
- Predominantly White (96%)
- Race & ethnicity
- White 96% Hispanic / Latino 2% Two or more races 2%
- Common ancestry
- Slovak 2% Lithuanian 2% Italian 1%
- Foreign-born
- 1% · Canada
Political lean MEDSL · Scott
- 2024 margin
- Solid R (+51.5) · D 23.4% · R 74.9% · Other 1.6%
- 2008→2024 swing
- -49.5pp toward R · 2008: -2.0pp · 2024: -51.5pp
- All cycles
- 2024: R+51.5 2020: R+45.6 2016: R+37.9 2012: R+6.2 2008: R+2.0
Not yet ingested
- Civics
- —
Market trends
- HPI YoY
- ▼ -25.77%
- Current HPI
- 263.604
- Rent YoY
- —
- Metro
- —
- State GDP YoY
- ▲ 2.90%
- F500 in state
- 18
Industry mix (Fortune 500 HQ in IN)
| Industry | F500 HQs | Revenue |
|---|---|---|
| Industrial Machinery | 2 | $37B |
|
||
| Healthcare | 1 | $177B |
|
||
| Pharmaceuticals | 1 | $45B |
|
||
| Metals / Steel | 1 | $18B |
|
||
| Agriculture | 1 | $17B |
|
||
| Packaging | 1 | $12B |
|
||
Price history
-49.9% since first listed8 events — show timeline
- 2026-06-09 Sold (MLS) $30,000 SIRA
- 2026-06-09 Sold (MLS) $30,000 MIBOR as Distributed by MLS Grid
- 2026-06-01 Delisted — SIRA
- 2026-06-01 Pending — MIBOR as Distributed by MLS Grid
- 2026-05-28 Price Changed $35,000 SIRA
- 2026-05-28 Listed $35,000 MIBOR as Distributed by MLS Grid
- 2026-05-12 Price Changed $49,900 SIRA
- 2026-05-05 Listed $59,900 SIRA
Property tax history
-7.5%/yrLatest (2024): $490 · -9.1% YoY. Source: county tax records.
Cash-flow waterfall
monthlySold comps — $/sqft
last 12 mo · ≤1 miLoading sold comps…