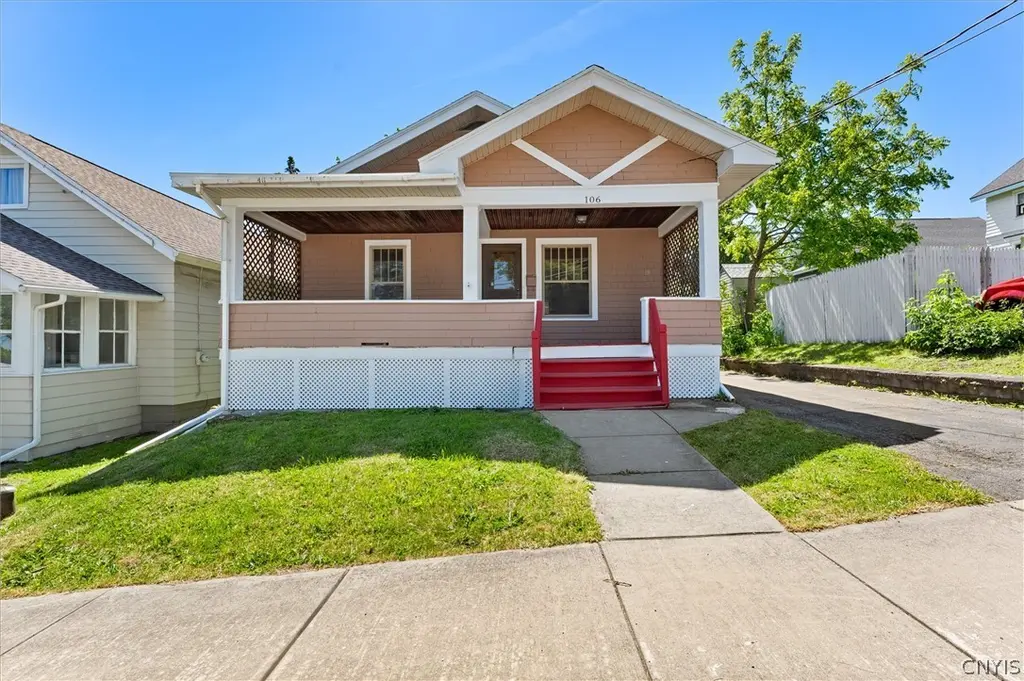
106 Orwood Pl · Syracuse, NY
Flood risk 1/10 · Minimal
- FEMA flood zone
- X (unshaded)
- Chance of flooding over 30 yrs
- 0.0%
- Est. flood insurance / yr
- $473 – $860
Fire risk 1/10 · Minimal
- Est. fire insurance / yr
- $691 – $1,283
Heat risk 3/10 · Minor
- Hot days now (above 95°F)
- 7 days/yr
- Hot days in 30 yrs
- 16 days/yr
Wind risk 1/10 · Minimal
- Chance of severe wind over 30 yrs
- 0.0%
Air-quality risk 2/10 · Minimal
- Unhealthy air days now
- 0 days/yr
- Unhealthy air days in 30 yrs
- 1 days/yr
Risk factors via First Street. Map © Google.
Why this score? — see what drove the C- grade
The composite is a weighted blend of 9 inputs, each scored 0–100. Each bar is that input's sub-score; the figure is the points it added to the 100-point composite (weight × sub-score).
- Cash flow +14.7/30.0
- ARV discount +10.9/15.0
- Appreciation +10.0/10.0
- DSCR +4.5/10.0
- 1% rule +4.1/10.0
- Livability +3.9/5.0
- Rent growth +2.5/5.0
- Condition / age +2.2/5.0
- Schools +1.8/10.0
$164,900
🖨 Deal sheet (PDF) 📄 Offer letter ✓ Due diligence
Listing remarks MLS
You’ll make yourself right at home in this adorable, updated 2 bedroom 1 bath home! Starting with it’s fabulous curb appeal- including a lovely, welcoming, “rocking chair” front porch- you will see all the love and care that has been put into this wonderful home over the past several years. You’ll appreciate numerous updates including a beautifully updated bathroom, new interior and exterior paint, new washer and dryer, glass block basement windows, a new sewer line, new ceiling fans and more! In addition, the 1-car detached garage offers great storage and convenient parking. You’ll also have tons of fun in your fully-fenced back yard. Nothing to do but unpack and move in and enjoy all that 106 Orwood Place has to offer- welcome home!
Key facts
- Fenced in backyard
- Red front porch
- New roof
Tags
Property features AI
Exterior
- Parking: Detached garage (1 car)
- Utilities: Public water (connected); Sewer connected
- Home design: Single-story home; Existing structure
- Construction: Wood siding; Shake siding; Block foundation
- Exterior features: Covered porch; Blacktop driveway; Near public transit; Irregular, residential lot; City street frontage; Lot dimensions approximately 40 x 160
Interior
- Kitchen: Gas oven; Gas range; Refrigerator
- Bedrooms: 2 main-level bedrooms
- Flooring: Hardwood; Resilient flooring; Tile; Varied flooring
- Bathrooms: 1 full bathroom (main level)
- Heating & cooling: Gas heating; Hot water heating
- Interior features: Separate/formal dining room; Bedroom on main level; Full basement
Neighborhood map
What this means for you Summary
Snapshot
- This is a 2-bed/1.0-bath single-family listed at $165k. Condition is rated fair.
Deal economics
- At list price, monthly cash flow is $43 ($510/yr) — positive.
- The deal already cash-flows at list — no discount required.
- To meet the 1% rule (rent ≥ 1% of price), the offer needs to be $150k (9.3% below list).
- Recommended offer: $150k (9.3% below list) — sets the bar for 1% rule.
Location & tenants
- Location reads 77/100 on livability (#187 in NY, #2,869 nationally) — a middle-class / working-renter tenant base. Strengths: amenities A+, commute A+, cost of living A+; Watch: schools D+, crime F, employment D-.
- Syracuse City School District (urban): math 18% / reading 26% proficiency, ranked #590 of 590 in NY (top 100%) — low school quality limits family demand, transient renter base, plan for 1-2y turnover; 74% free/reduced lunch — lower-income household profile, screen leases tightly.
- Market conditions: 99 active listings in the ZIP; 16 comparable units currently listed for rent nearby; rentals lingering (median 45d on market — plan ~5-8 weeks vacancy on turnover, expect pricing pressure); 56% of comp listings sitting > 30 days — soft ceiling on asking rent; lower-income renter base — watch delinquency; 616 units permitted in Onondaga County in 2024 (256 in 5+ unit buildings).
- This rent runs 40% of the median local income ($45k/yr) — at the standard rent-burdened threshold; future hikes will face affordability resistance.
Forward outlook
- In year one you build about $18k of equity ($1k loan paydown + $16k appreciation (10.0% local appreciation)).
- Onondaga County population projected to shrink 9% by 2050 — rents likely to lag national; underwrite the cash flow, not the appreciation.
- At projected returns (10.0% appreciation + 3.0% rent growth), your $46k cash investment doubles in ~3 years — after that, you're playing with house money.
- By year 3, paydown + projected appreciation supports a ~$45k cash-out refi (75% LTV) — recoverable capital for the next deal without selling this one.
Negotiation context
- Only 5 days on market — expect competitive offers; lowballing is unlikely to land.
- 6 sale attempts since 11y ago with the ask held roughly flat each time — persistent listings suggest the price (not the market) is what's stuck; bring a comps-based counter.
- Current owner paid $85k; list at $165k implies a 94% gain — meaningful room to come down on a strong offer.
Risks & watch-outs
- Watch-outs: built in 1926 — expect roof / HVAC / electrical / plumbing capex.
Questions for the listing agent
- Have any recent inspections been done? Can we get a copy of the seller's disclosures and any deferred-maintenance estimates?
- Built in 1926 — when were the roof, HVAC, electrical panel, plumbing, and water heater last replaced?
- Is there a deadline driving the sale (1031 exchange, divorce, estate, relocation)? That informs how much negotiation room exists.
- Schools are D-rated, which usually means shorter tenancies and higher turnover. Who's the typical renter profile here, and what's been the actual vacancy rate?
- Crime grade is F in this area — have there been break-ins, vandalism, or insurance claims at this property in the last 3 years? What carrier currently insures it and at what premium?
- What's the average days-on-market for RENTAL listings here right now (not sales)? A rising rental-DOM trend means longer vacancies and softer asking-rent achievability than the comps imply.
- What's the recent tenant-quality profile in this submarket — average credit score on applications, eviction rate, late-payment / NSF rate, and stable-employment percentage? A property-management company in the area should have these aggregated.
- How much new for-sale + rental construction is in the pipeline within 1–3 miles? Heavy new supply typically softens prices + rents 12–24 months out; constrained supply supports both.
Investment metrics
- 1% rule
- 0.91% ✗
- Cap rate
- 6.60%
- Cash-on-cash
- 1.10%
- DSCR
- 1.05
- GRM
- 9.2
CMA / ARV
- ARV (on-the-fly)
- $178,192
- Comps found
- 12
Show comp detail 12 sales within ~0.75 mi
| Address | Dist | Beds/Ba | Sqft | Sold | Price | $/sf | Match |
|---|---|---|---|---|---|---|---|
| 497 Pleasantview Ave | 0.11mi | 3/1.5 (+1) | 1,056 (+2%) | 1mo | $189,900 | $180 | 84 |
| 307 Malverne Dr | 0.44mi | 2/1.0 | 1,056 (+2%) | 4mo | $170,000 | $161 | 74 |
| 400 Kenwick Dr | 0.10mi | 3/1.5 (+1) | 1,106 (+7%) | 6mo | $189,900 | $172 | 72 |
| 164 Berkshire Ave | 0.33mi | 3/1.0 (+1) | 1,073 (+4%) | 2mo | $116,900 | $109 | 72 |
| 222 Darlington Rd | 0.31mi | 3/1.0 (+1) | 1,080 (+4%) | 5mo | $168,500 | $156 | 69 |
| 232 Malverne Dr | 0.38mi | 3/1.5 (+1) | 1,142 (+10%) | 1mo | $224,900 | $197 | 58 |
| 1108 Wadsworth St | 0.40mi | 3/1.0 (+1) | 1,168 (+13%) | 2mo | $165,000 | $141 | 54 |
| 606 Roxford Rd S | 0.52mi | 2/1.5 | 1,162 (+12%) | 1mo | $210,000 | $181 | 53 |
| 211 Merrill St | 0.74mi | 2/1.0 | 1,125 (+9%) | 3mo | $180,000 | $160 | 49 |
| 319 Loma Ave | 0.50mi | 3/1.0 (+1) | 1,152 (+11%) | 6mo | $200,000 | $174 | 48 |
| 352 Roxford Rd N | 0.58mi | 3/1.5 (+1) | 1,164 (+12%) | 0mo | $209,500 | $180 | 45 |
| 502 Cadillac St | 0.57mi | 3/1.5 (+1) | 1,152 (+11%) | 7mo | $176,000 | $153 | 42 |
Match score weights: distance 35% · size 25% · config 20% · recency 20%. Top-matched comps best support the ARV.
Projected returns pro-forma
10.0% appreciation · 3.0% rent growth · sell at horizon
- IRR
- 25.1%
- Equity multiple
- 3.00×
- Total profit
- $92,539
- Equity at exit
- $148,555
- IRR
- 22.1%
- Equity multiple
- 6.86×
- Total profit
- $270,428
- Equity at exit
- $320,364
Cash invested: $46,172 (down + closing). Projections, not guarantees.
Landlord ↔ Tenant lean methodology
- Overall (STATE)
- 15 Strongly Tenant-Friendly
- State New York
- 15 Strongly Tenant-Friendly · D+10
- County
- — inherits STATE
- City
- — inherits STATE
ZIP-level market 13208
- Home prices YoY
- 8.4%
- Active inventory
- 99
- Price-to-rent
- 9.2×
Monthly cashflow live
- Estimated rent
- $1,496 high interval (Pro) →
- Mortgage (P&I)
- −$865
- Tax est. 1.5%
- −$206 /mo · $2,474/yr
- Insurance
- −$69
- HOA
- −$0
- Vacancy / Maint / Mgmt
- −$314
- Net cashflow
- $43
Break-even live
Sensitivity live
| Price | -10% $156 | -5% $99 | +0% $43 | +5% $-14 | +10% $-71 |
|---|---|---|---|---|---|
| Rent | -10% $-76 | -5% $-17 | +0% $43 | +5% $102 | +10% $161 |
| Rate | -1.0pp $126 | -0.5pp $84 | base $43 | +0.5pp $0 | +1.0pp $-44 |
UW: 25.0% down · 7.5% · 30yr · 1.5% tax · 5.0% vac · 8.0% maint · 8.0% mgmt
Financing live
Cash to close
- Down payment
- $41,225
- Closing costs
- $4,947
- Reserves months
- —
- Total cash needed
- —
Loan-product check · same deal, 3 products live
Conventional
25% down · 7.5% · 30yr
- Down + closing
- —
- Monthly P&I
- —
- Monthly cashflow
- —
- DSCR
- —
- Eligible?
- —
Personal DTI + credit; lowest rate.
DSCR
20% down · 8.5% · 30yr
- Down + closing
- —
- Monthly P&I
- —
- Monthly cashflow
- —
- DSCR
- —
- Eligible?
- —
No personal income docs; deal must DSCR.
Hard money
10% down · 12.0% · 12mo
- Down + closing
- —
- Monthly P&I
- —
- Monthly cashflow
- —
- DSCR
- —
- Eligible?
- —
Short-term bridge; refi at stabilization.
Rent comps 16 comps
| Address | Beds | Baths | Sqft | Rent | $/sqft | DOM | Units | Dist |
|---|---|---|---|---|---|---|---|---|
| 286 Ross Park Syracuse, NY | 3.0 | 1.0 | 1100 | $1,500 | $1.36 | 45d | 1 | 0.53mi |
| 126 Woodruff Ave Syracuse, NY | 3.0 | 1.0 | 1200 | $1,675 | $1.40 | 44d | 1 | 0.75mi |
| 212 Dorchester Ave Syracuse, NY | 1.0–2.0 | 1.0 | 640 | $1,420 | $2.22 | 14d | 15 | 0.92mi |
| 1140 Wolf St Apt 3 Syracuse, NY | 2.0 | 1.0 | 800 | $1,200 | $1.50 | 44d | 1 | 0.97mi |
| 1132 Wolf St Unit 4 Syracuse, NY | 3.0 | 1.0 | 1041 | $1,350 | $1.30 | 44d | 1 | 0.97mi |
| 106 Harrington St Syracuse, NY | 3.0 | 1.0 | 1168 | $1,875 | $1.61 | 44d | 1 | 1.03mi |
| 2802 Lemoyne Ave Unit 1 Syracuse, NY | 3.0 | 1.0 | 988 | $1,700 | $1.72 | 14d | 1 | 1.20mi |
| 912 Park St Unit 1 Syracuse, NY | 3.0 | 1.0 | 1040 | $1,200 | $1.15 | 44d | 1 | 1.20mi |
| 1801 James St #2 Syracuse, NY | 3.0 | 1.0 | 1244 | $1,800 | $1.45 | 14d | 1 | 1.24mi |
| 1618 James St #3 Syracuse, NY | 2.0 | 1.0 | 1150 | $2,200 | $1.91 | 14d | 1 | 1.29mi |
| 117 Edtim Rd Syracuse, NY | 1.0–2.0 | 1.0 | 545 | $1,295 | $2.37 | 14d | 1 | 1.30mi |
| 205 Beecher St Unit 3 Syracuse, NY | 2.0 | 1.0 | 815 | $1,100 | $1.35 | 44d | 1 | 1.34mi |
| 746 E Laurel St Unit 2F Syracuse, NY | 2.0 | 1.0 | 800 | $1,100 | $1.38 | 44d | 1 | 1.35mi |
| 610 E Division St Unit F2 Syracuse, NY | 2.0 | 1.0 | 900 | $1,150 | $1.28 | 44d | 1 | 1.38mi |
| 225 Marlborough Rd Syracuse, NY | 2.0 | 1.0 | 1040 | $1,800 | $1.73 | 14d | 1 | 1.41mi |
| 297 Norwood Ave Syracuse, NY | 3.0 | 1.0 | 1188 | $2,050 | $1.73 | 22d | 1 | 1.44mi |
Listing history 6 events
-
2026-06-10status $164,900 Pending 5 DOM
-
2026-06-09days on market $164,900 Active 5 DOM
-
2026-06-08days on market $164,900 Active 4 DOM
-
2026-06-07days on market $164,900 Active 3 DOM
-
2026-06-05remarks 645-char remark
-
2026-06-05$164,900 Active 1 DOM
ⓘ Source: listings_history table (triggers on properties + properties_extension) + one-shot
backfill from property_details.listing_events for pre-trigger history.
Climate risk First Street
- Flood 1/10 Low FEMA zone X (unshaded) · 0% chance over 30 yrs
- Wildfire 1/10 Low
- Heat 3/10 Moderate 7 d/yr ≥95°F today · 16 d/yr by 30 yrs out
- Wind 1/10 Low 0% chance of damaging wind over 30 yrs
- Air quality 2/10 Low 0 unhealthy d/yr today · 1 by 30 yrs out
Nearby sold comps map
Loading sold comps map…
Walkable amenities ~0.75 mi
Loading nearby amenities…
Taxation est. · year 1
- Rental income
- $17,956
- − Mortgage interest
- −$9,237
- − Property taxes
- −$2,474
- − Insurance
- −$824
- − Repairs & maintenance
- −$1,436
- − Management
- −$1,436
- − Depreciation
- −$4,797
- Taxable loss
- −$2,249
- Est. tax savings @ 24.0%
- +$540
- After-tax cash flow
- $1,050/yr
For passive investors: Depreciation is non-cash, so a rental often shows a tax loss while cash-flowing — sheltering income. Rental losses are passive: they offset passive income freely, and up to $25,000/yr can offset ordinary (W-2) income if you actively participate and your MAGI is under $100k (phasing out to $0 by $150k); unused losses carry forward. On sale, claimed depreciation is recaptured at up to 25%, and gains may owe capital-gains tax (a 1031 exchange can defer both). Figures are a year-1 estimate at your 24.0% rate — not tax advice; consult a CPA.
Condition & rehab AI · 13 photos
This bungalow requires moderate renovations to improve its condition and increase its value. Key areas for improvement include the kitchen, flooring, and HVAC system.
Repairs flagged
- Major Kitchen cabinets — Older cabinets with visible wear and tear.
- Major Appliances — Outdated and possibly non-functional.
- Major Flooring — Worn hardwood flooring in living areas.
- Major Paint — Painted walls with visible wear and tear.
- Major HVAC system — Older system with possible inefficiency.
Value-add opportunities
- Resale Kitchen renovation — Modern kitchen with updated appliances and cabinetry can significantly increase the home's appeal.
- Rental HVAC system replacement — A new HVAC system can improve energy efficiency and reduce utility costs, making the home more attractive to renters.
Renovation cost estimate screening
| Repair item | Severity | Est. cost |
|---|---|---|
| Kitchen cabinets · Older cabinets with visible wear and tear. | Major | $15,000–50,000 |
| Appliances · Outdated and possibly non-functional. | Major | $15,000–50,000 |
| Flooring · Worn hardwood flooring in living areas. | Major | $15,000–50,000 |
| Paint · Painted walls with visible wear and tear. | Major | $15,000–50,000 |
| HVAC system · Older system with possible inefficiency. | Major | $15,000–50,000 |
| Total estimated repair cost · 5 items | $75,000–250,000 |
Value-add ROI direction
- Resale Kitchen renovation — Modern kitchen with updated appliances and cabinetry can significantly increase the home's appeal. ↑
- Rental HVAC system replacement — A new HVAC system can improve energy efficiency and reduce utility costs, making the home more attractive to renters. ↑
ⓘ Cost ranges are severity-bucket heuristics (US national rule-of-thumb). Get contractor quotes + a written scope before underwriting a rehab budget.
Schools (NCES district)
- District
- Syracuse City School District
- NCES district ID
- 3628590
- Math proficiency
- 18% ▼ -5.00%
- Reading proficiency
- 26% ▬ 0.00%
- Median HH income
- $32,097
- Composite
- 17.83/100
- National rank
- #9007
- State rank
- #590 of 590 in NY
Livability — Syracuse
- Score
- 77/100
- State rank
- #187
- US rank
- #2869
Category grades
Schools grade is shown separately in the Schools card above.
Census & demographics
- Census place
- Syracuse, NY
- County
- Onondaga County · 247,257 people
- City population
- 152,627
- Metro
- Syracuse, NY
- Population (ZIP)
- 22,993
- Household income
- $44,712
- Rent vs Own
- Severe rent burden
- 1437.0
Population outlook (Onondaga County) Hauer SSP2
- Today (2025)
- 467,894 people
- By 2030
- 463,381 · -1.0%
- By 2040
- 447,697 · -4.3%
- By 2050
- 426,399 · -8.9%
- By 2075
- 373,661 · -20.1%
- By 2100
- 307,967 · -34.2%
Race, ethnicity, and origin ACS 2023
- Neighborhood character
- Highly diverse neighborhood (Simpson 0.70)
- Race & ethnicity
- White 46% Black 24% Asian 14% Two or more races 10% Hispanic / Latino 6%
- Hispanic origin (detail)
- Puerto Rican 4% Dominican 1%
- Common ancestry
- Romanian 3% Swedish 3% Italian 1%
- Foreign-born
- 22% · Vietnam, Philippines, Canada
- Languages at home
- 70% English-only · Spanish 6% Other Asian/Pacific 5% Vietnamese 4%
Political lean MEDSL · Onondaga
- 2024 margin
- D (+17.3) · D 58.6% · R 41.4%
- 2008→2024 swing
- -3.0pp toward R · 2008: 20.3pp · 2024: 17.3pp
- All cycles
- 2024: D+17.3 2020: D+20.6 2016: D+12.8 2012: D+21.1 2008: D+20.3
Not yet ingested
- Civics
- —
Market trends
- HPI YoY
- ▲ 30.91%
- Current HPI
- 399.3284
- Rent YoY
- —
- Metro
- Syracuse, NY
- State GDP YoY
- ▲ 2.60%
- F500 in state
- 92
Industry mix (Fortune 500 HQ in NY)
| Industry | F500 HQs | Revenue |
|---|---|---|
| Financial Services | 10 | $950B |
|
||
| Consumer Goods | 9 | $162B |
|
||
| Insurance | 4 | $225B |
|
||
| Telecommunications | 2 | $144B |
|
||
| Pharmaceuticals | 2 | $112B |
|
||
| Media / Entertainment | 2 | $69B |
|
||
Price history
+159.3% since first listed15 events — show timeline
- 2026-06-04 Listed $164,900 CNYIS
- 2018-12-18 Sold (MLS) $85,000 CNYIS
- 2018-10-31 Pending — CNYIS
- 2018-10-23 Contingent — CNYIS
- 2018-10-18 Price Changed $86,900 CNYIS
- 2018-09-08 Relisted — CNYIS
- 2018-08-24 Pending — CNYIS
- 2018-08-08 Listed $90,000 CNYIS
- 2016-03-03 Sold (MLS) $63,600 CNYIS
- 2016-02-21 Pending — CNYIS
- 2016-01-18 Contingent — CNYIS
- 2015-12-28 Relisted — CNYIS
- 2015-11-07 Contingent — CNYIS
- 2015-10-06 Relisted — CNYIS
- 2015-10-06 Listed — CNYIS
Cash-flow waterfall
monthlySold comps — $/sqft
last 12 mo · ≤1 miLoading sold comps…