12283 Hideout Pass · Huntertown, IN
Flood risk No data
- FEMA flood zone
- —
- Chance of flooding over 30 yrs
- —
- Est. flood insurance / yr
- —
Fire risk No data
- Est. fire insurance / yr
- —
Heat risk No data
- Hot days now (above threshold)
- —
- Hot days in 30 yrs
- —
Wind risk No data
- Chance of severe wind over 30 yrs
- —
Air-quality risk No data
- Unhealthy air days now
- —
- Unhealthy air days in 30 yrs
- —
Risk factors via First Street. Map © Google.
Why this score? — see what drove the D grade
The composite is a weighted blend of 9 inputs, each scored 0–100. Each bar is that input's sub-score; the figure is the points it added to the 100-point composite (weight × sub-score).
- ARV discount +14.6/15.0
- Cash flow +9.2/30.0
- Schools +4.9/10.0
- Rent growth +4.4/5.0
- Livability +3.5/5.0
- 1% rule +3.0/10.0
- DSCR +2.6/10.0
- Condition / age +2.5/5.0
- Appreciation +0.0/10.0
$299,900
🖨 Deal sheet (PDF) 📄 Offer letter ✓ Due diligence
Listing remarks
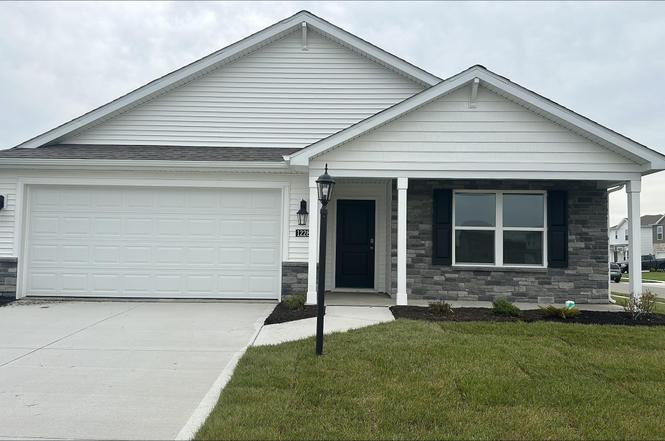
Welcome to 12283 Hideout Pass in Fort Wayne, a stunning new home in our Grasslands at Broad Acres neighborhood. This single-story home sits on a spacious corner homesite. As you step through the front door, two secondary bedrooms and a full bathroom are tucked just off the foyer. Continue down the hallway and you’ll find the third secondary bedroom across from the laundry room. At the heart of the home, the great room, dining area, and kitchen are all connected in a spacious open-concept layout ideal for everyday living and entertaining. The kitchen is designed for both beauty and function. It features white shaker cabinetry, miami vena quartz countertops, and stainless steel applianc
Key facts
- Corner homesite
- Open-concept layout
- Walk-in pantry
Tags
Property features AI
Finance
- HOA & community: Homeowners association with $550 annual fee (about $45.83/month); Community sidewalks; Subdivision: Grasslands at Broad Acres
Exterior
- Parking: Attached concrete garage with 2 parking spaces
- Utilities: Public water; Public sewer
- Home design: Single-family residence, site-built; One story; Built by DR Horton
- Construction: Stone and vinyl siding exterior; Shingle roof; Slab foundation with concrete perimeter; Home warranty included
- Exterior features: Patio (covered); Front porch; Level lot
Interior
- Kitchen: Dishwasher; Microwave; Refrigerator; Gas range
- Bedrooms: Bedrooms located on main level
- Flooring: Carpet; Vinyl
- Bathrooms: 2 full bathrooms
- Heating & cooling: Central air conditioning; Natural gas forced air heating
- Interior features: Walk-in closets; Eat-in kitchen; Kitchen island; Open floorplan; Primary suite on main level; One fireplace
- Laundry & utility: Washer hookup on main level; Electric dryer hookup; Electric water heater
Neighborhood map
What this means for you Summary
Snapshot
- This is a 4-bed/2.0-bath single-family listed at $300k.
Deal economics
- At list price, monthly cash flow is $-224 ($-3k/yr) — negative.
- To cash-flow at today's rent, offer at most $267k (10.8% below list).
- To meet the 1% rule (rent ≥ 1% of price), the offer needs to be $240k (20.0% below list).
- Recommended offer: $240k (20.0% below list) — sets the bar for 1% rule.
- Cap rate 5.4% vs local median 4.1% in Huntertown — top-decile yield for the area; either an underpriced asset or a hidden risk that comps aren't pricing in. Stress-test before assuming the spread holds.
Location & tenants
- Location reads 70/100 on livability (#159 in IN) — a middle-class / working-renter tenant base. Strengths: employment A+, cost of living A+, housing A+; Watch: amenities F, commute F, health & safety F.
- Northwest Allen County Schools (rural): math 51% / reading 58% proficiency, ranked #25 of 301 in IN (top 8%) — acceptable for families but not a draw, mixed tenant base, ~2y average lease; only 11% free/reduced lunch — higher-income household profile.
- Zoned schools: Arcola School (math 72% / reading 62%, grade B+, #55 of 994 statewide, top 6%, 216 students, 33% FRL); Carroll Middle School (math 39% / reading 55%, grade D+, #65 of 330 statewide, top 21%, 994 students, 29% FRL); Carroll High School (math 59% / reading 86%, grade B+, #10 of 369 statewide, top 3%, 2,554 students, 21% FRL) — zoned schools average 28% FRL vs 11% district-wide (17 pts higher); higher-poverty schools than district average — tighter screening recommended.
- Market conditions: Rents rising fast (+7.6%/yr); 327 active listings in the ZIP; 3 comparable units currently listed for rent nearby; rentals at typical pace (median 15d on market — plan ~3-4 weeks tenant-placement turnaround); solid renter incomes; 1,861 units permitted in Allen County in 2024 (576 in 5+ unit buildings).
- This rent runs 35% of the median local income ($81k/yr) — at the standard rent-burdened threshold; future hikes will face affordability resistance.
Forward outlook
- Local home prices are declining (-3.0%/yr); year-one equity from $2k of loan paydown is wiped out by about $9k of value loss. Plan a longer hold.
- Allen County population projected at +10% by 2050 — modest demand growth; plan on rents tracking national, not racing it.
Negotiation context
- It's been on market 46 days — a 3% lower offer ($291k) is reasonable based on typical stale-listing flexibility.
- 2 sale attempts; this cycle's ask has dropped $20k (6%) from the opening price — seller is motivated, your offer sets the floor, not the list.
Questions for the listing agent
- What do current leases actually rent for vs. the listed asking? Can we see a recent rent roll and the last 12 months of T-12 income?
- It's been on market 46 days. Have you received any prior offers? Is the seller open to a 20% concession, seller financing, or rate buy-down credit?
- What does the HOA fee cover, when was the last increase, and are there any pending special assessments or reserve-fund shortfalls?
- Is there a deadline driving the sale (1031 exchange, divorce, estate, relocation)? That informs how much negotiation room exists.
- The area grade is low — what's the realistic commute time and amenity access for the typical tenant pool here? Any planned neighborhood developments (good or bad) we should know about?
- What's the average days-on-market for RENTAL listings here right now (not sales)? A rising rental-DOM trend means longer vacancies and softer asking-rent achievability than the comps imply.
- What's the recent tenant-quality profile in this submarket — average credit score on applications, eviction rate, late-payment / NSF rate, and stable-employment percentage? A property-management company in the area should have these aggregated.
- How much new for-sale + rental construction is in the pipeline within 1–3 miles? Heavy new supply typically softens prices + rents 12–24 months out; constrained supply supports both.
Investment metrics
- 1% rule
- 0.80% ✗
- Cap rate
- 5.40%
- Cash-on-cash
- -3.20%
- DSCR
- 0.86
- GRM
- 10.4
CMA / ARV
- ARV (on-the-fly)
- $355,971
- Comps found
- 12
Show comp detail 12 sales within ~0.75 mi
| Address | Dist | Beds/Ba | Sqft | Sold | Price | $/sf | Match |
|---|---|---|---|---|---|---|---|
| 12283 Hideout Pass | 0.00mi | 4/2.0 | 1,771 (0%) | 1mo | $295,115 | $167 | 99 |
| 5116 Mountain Sky Cv | 0.33mi | 4/2.5 | 1,818 (+3%) | 0mo | $374,800 | $206 | 78 |
| 5091 Sickle Cv | 0.26mi | 3/2.0 (-1) | 1,703 (-4%) | 0mo | $342,200 | $201 | 76 |
| 5207 Mountain Sky Cv | 0.27mi | 4/2.5 | 1,900 (+7%) | 2mo | $338,000 | $178 | 72 |
| 4684 Hammock Dr | 0.45mi | 3/2.0 (-1) | 1,724 (-3%) | 2mo | $327,000 | $190 | 68 |
| 12005 Swather Ct | 0.41mi | 4/2.5 | 1,900 (+7%) | 2mo | $360,000 | $189 | 65 |
| 5591 Broad Fields Cv | 0.67mi | 3/2.0 (-1) | 1,775 (+0%) | 0mo | $386,300 | $218 | 63 |
| 5029 Whittlebury Dr | 0.54mi | 4/2.5 | 1,938 (+9%) | 1mo | $352,900 | $182 | 56 |
| 4725 Silverstone Psge | 0.70mi | 3/2.0 (-1) | 1,716 (-3%) | 2mo | $379,900 | $221 | 56 |
| 4840 Whittlebury Dr | 0.61mi | 3/2.0 (-1) | 1,639 (-8%) | 1mo | $359,227 | $219 | 54 |
| 5599 Broad Fields Cv | 0.68mi | 3/2.0 (-1) | 1,665 (-6%) | 1mo | $384,900 | $231 | 53 |
| 4874 Whittlebury Dr | 0.63mi | 4/2.5 | 1,994 (+13%) | 1mo | $375,000 | $188 | 47 |
Match score weights: distance 35% · size 25% · config 20% · recency 20%. Top-matched comps best support the ARV.
Projected returns pro-forma
-3.0% appreciation · 7.64% rent growth · sell at horizon
- IRR
- -16.5%
- Equity multiple
- 0.39×
- Total profit
- $-51,092
- Equity at exit
- $44,716
- IRR
- -1.4%
- Equity multiple
- 0.88×
- Total profit
- $-9,681
- Equity at exit
- $25,930
Cash invested: $83,972 (down + closing). Projections, not guarantees.
Landlord ↔ Tenant lean methodology
- Overall (STATE)
- 90 Strongly Landlord-Friendly
- State Indiana
- 90 Strongly Landlord-Friendly · R+11
- County
- — inherits STATE
- City
- — inherits STATE
ZIP-level market 46818
- Rents YoY
- 7.6%
- Active inventory
- 327
- Price-to-rent
- 10.4×
Monthly cashflow live
- Estimated rent
- $2,398 medium interval (Pro) →
- Mortgage (P&I)
- −$1,573
- Tax est. 1.5%
- −$375 /mo · $4,498/yr
- Insurance
- −$125
- HOA
- −$46
- Vacancy / Maint / Mgmt
- −$504
- Net cashflow
- $-224
Break-even live
Sensitivity live
| Price | -10% $-17 | -5% $-121 | +0% $-224 | +5% $-328 | +10% $-431 |
|---|---|---|---|---|---|
| Rent | -10% $-414 | -5% $-319 | +0% $-224 | +5% $-129 | +10% $-35 |
| Rate | -1.0pp $-73 | -0.5pp $-148 | base $-224 | +0.5pp $-302 | +1.0pp $-381 |
UW: 25.0% down · 7.5% · 30yr · 1.5% tax · 5.0% vac · 8.0% maint · 8.0% mgmt
Financing live
Cash to close
- Down payment
- $74,975
- Closing costs
- $8,997
- Reserves months
- —
- Total cash needed
- —
Loan-product check · same deal, 3 products live
Conventional
25% down · 7.5% · 30yr
- Down + closing
- —
- Monthly P&I
- —
- Monthly cashflow
- —
- DSCR
- —
- Eligible?
- —
Personal DTI + credit; lowest rate.
DSCR
20% down · 8.5% · 30yr
- Down + closing
- —
- Monthly P&I
- —
- Monthly cashflow
- —
- DSCR
- —
- Eligible?
- —
No personal income docs; deal must DSCR.
Hard money
10% down · 12.0% · 12mo
- Down + closing
- —
- Monthly P&I
- —
- Monthly cashflow
- —
- DSCR
- —
- Eligible?
- —
Short-term bridge; refi at stabilization.
Rent comps 3 comps
| Address | Beds | Baths | Sqft | Rent | $/sqft | DOM | Units | Dist |
|---|---|---|---|---|---|---|---|---|
| 5045 Portney Pl Fort Wayne, IN | 4.0 | 2.5 | 2226 | $2,300 | $1.03 | 44d | 1 | 0.31mi |
| 4722 Whittlebury Dr Fort Wayne, IN | 4.0 | 2.0 | 1650 | $1,999 | $1.21 | 14d | 1 | 0.53mi |
| 3115 Carroll Rd Fort Wayne, IN | 3.0 | 2.0 | 1244 | $2,300 | $1.85 | 14d | 1 | 1.39mi |
HOA detail
- Monthly dues
- $46 · $552/yr
Listing history 5 events
-
2026-05-13status Pending
-
2026-05-13status Active
-
2026-02-24status Pending
-
2026-02-04price $299,900
-
2026-01-09$319,880 Active
ⓘ Source: listings_history table (triggers on properties + properties_extension) + one-shot
backfill from property_details.listing_events for pre-trigger history.
Nearby sold comps map
Loading sold comps map…
Walkable amenities ~0.75 mi
Loading nearby amenities…
Taxation est. · year 1
- Rental income
- $28,775
- − Mortgage interest
- −$16,799
- − Property taxes
- −$4,498
- − Insurance
- −$1,500
- − Repairs & maintenance
- −$2,302
- − Management
- −$2,302
- − HOA
- −$552
- − Depreciation
- −$8,724
- Taxable loss
- −$7,902
- Est. tax savings @ 24.0%
- +$1,897
- After-tax cash flow
- $-794/yr
For passive investors: Depreciation is non-cash, so a rental often shows a tax loss while cash-flowing — sheltering income. Rental losses are passive: they offset passive income freely, and up to $25,000/yr can offset ordinary (W-2) income if you actively participate and your MAGI is under $100k (phasing out to $0 by $150k); unused losses carry forward. On sale, claimed depreciation is recaptured at up to 25%, and gains may owe capital-gains tax (a 1031 exchange can defer both). Figures are a year-1 estimate at your 24.0% rate — not tax advice; consult a CPA.
Schools (NCES district)
- District
- Northwest Allen County Schools
- NCES district ID
- 1808250
- Math proficiency
- 51% ▼ -6.00%
- Reading proficiency
- 58% ▼ -5.00%
- Median HH income
- $78,952
- Composite
- 49.26/100
- National rank
- #2027
- State rank
- #25 of 301 in IN
Livability — Huntertown
- Score
- 70/100
- State rank
- #159
- US rank
- #7771
Category grades
Schools grade is shown separately in the Schools card above.
Census & demographics
- County
- Allen County · 326,813 people
- Metro
- Fort Wayne, IN
- Population (ZIP)
- 21,954
- Household income
- $81,066
- Rent vs Own
- Severe rent burden
- 101.0
Population outlook (Allen County) Hauer SSP2
- Today (2025)
- 394,020 people
- By 2030
- 405,128 · +2.8%
- By 2040
- 423,476 · +7.5%
- By 2050
- 435,137 · +10.4%
- By 2075
- 450,293 · +14.3%
- By 2100
- 424,101 · +7.6%
Race, ethnicity, and origin ACS 2023
- Neighborhood character
- Predominantly White (79%)
- Race & ethnicity
- White 79% Two or more races 8% Hispanic / Latino 7% Black 4% Asian 3%
- Hispanic origin (detail)
- Mexican 6%
- Common ancestry
- Italian 4% Slovak 3% Romanian 2%
- Foreign-born
- 8% · Canada, Vietnam, Philippines
- Languages at home
- 90% English-only · Spanish 4% Other Asian/Pacific 1% Vietnamese 1%
Political lean MEDSL · Allen
- 2024 margin
- R (+12.5) · D 42.9% · R 55.4% · Other 1.7%
- 2008→2024 swing
- -8.1pp toward R · 2008: -4.3pp · 2024: -12.5pp
- All cycles
- 2024: R+12.5 2020: R+11.2 2016: R+19.6 2012: R+16.8 2008: R+4.3
Not yet ingested
- Civics
- —
Market trends
- HPI YoY
- ▼ -217.71%
- Current HPI
- 228.1539
- Rent YoY
- ▲ 7.64%
- Metro
- Fort Wayne, IN
- State GDP YoY
- ▲ 2.90%
- F500 in state
- 18
Industry mix (Fortune 500 HQ in IN)
| Industry | F500 HQs | Revenue |
|---|---|---|
| Industrial Machinery | 2 | $37B |
|
||
| Healthcare | 1 | $177B |
|
||
| Pharmaceuticals | 1 | $45B |
|
||
| Metals / Steel | 1 | $18B |
|
||
| Agriculture | 1 | $17B |
|
||
| Packaging | 1 | $12B |
|
||
Price history
-6.2% since first listed5 events — show timeline
- 2026-05-13 Pending — IRMLS
- 2026-05-13 Relisted — IRMLS
- 2026-02-24 Pending — IRMLS
- 2026-02-04 Price Changed $299,900 IRMLS
- 2026-01-09 Listed $319,880 IRMLS
Cash-flow waterfall
monthlySold comps — $/sqft
last 12 mo · ≤1 miLoading sold comps…