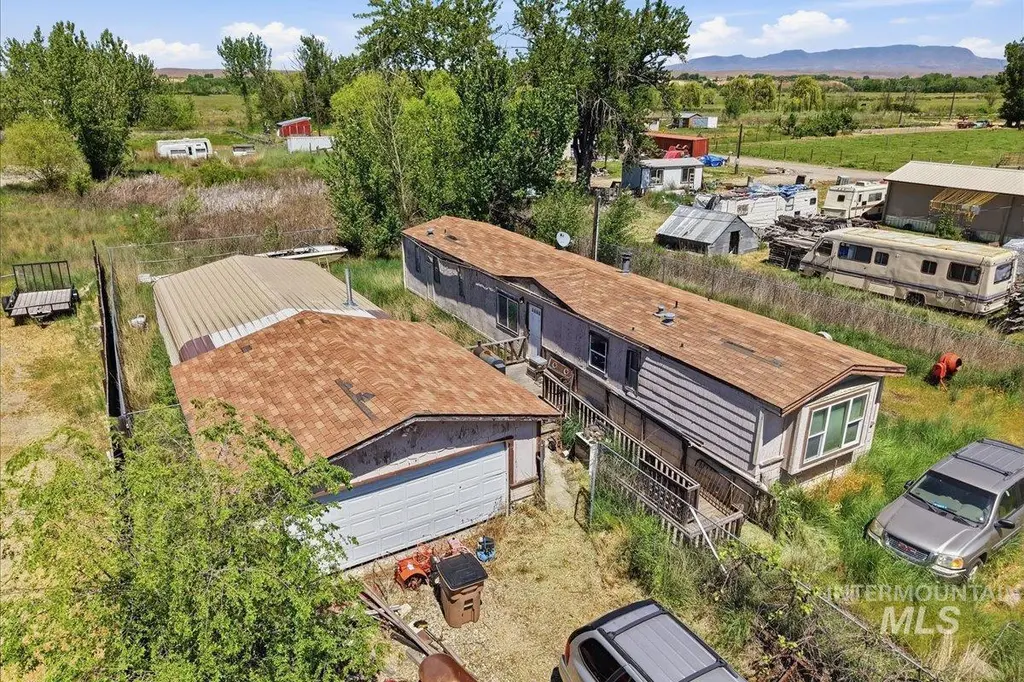
8383 Florence St · Letha, ID
Flood risk 2/10 · Minimal
- FEMA flood zone
- X (unshaded)
- Chance of flooding over 30 yrs
- 0.05%
- Est. flood insurance / yr
- $507 – $1,088
Fire risk 1/10 · Minimal
- Est. fire insurance / yr
- $584 – $1,086
Heat risk 5/10 · Moderate
- Hot days now (above 97°F)
- 7 days/yr
- Hot days in 30 yrs
- 19 days/yr
Wind risk 1/10 · Minimal
- Chance of severe wind over 30 yrs
- —
Air-quality risk 8/10 · Major
- Unhealthy air days now
- 13 days/yr
- Unhealthy air days in 30 yrs
- 17 days/yr
Risk factors via First Street. Map © Google.
Why this score? — see what drove the B- grade
The composite is a weighted blend of 9 inputs, each scored 0–100. Each bar is that input's sub-score; the figure is the points it added to the 100-point composite (weight × sub-score).
- Cash flow +25.7/30.0
- ARV discount +15.0/15.0
- DSCR +8.5/10.0
- 1% rule +6.8/10.0
- Schools +3.2/10.0
- Rent growth +2.5/5.0
- Livability +2.5/5.0
- Condition / age +2.5/5.0
- Appreciation +0.0/10.0
$124,900
🖨 Deal sheet (PDF) 📄 Offer letter ✓ Due diligence
Listing remarks
Welcome to 8383 Florence St in the quiet rural community of Emmett near Letha — an affordable country property offering small-town living with room to spread out. Public records and past listings highlight a move-in-ready manufactured home featuring an open floor plan, spacious living area, breakfast bar kitchen, pantry, and included appliances, along with forced-air heat, central air, and a cozy wood-burning stove for year-round comfort. Situated on an approximately 10,000+ sq ft lot, the property offers plenty of parking, RV space, a large detached two-car garage/shop, garden space, and room to enjoy Idaho’s wide-open lifestyle. Located just minutes from Emmett amenities, scho
Key facts
- Pantry
- Open floor plan
- Included appliances
Tags
Property features AI
Exterior
- Parking: Detached 2-car garage; RV access/parking; 2 covered parking spaces
- Utilities: Well water; Sewer connected
- Home design: Manufactured on land; Built in 1985
- Construction: Composition roof
- Exterior features: Full fencing; Garden
Interior
- Bedrooms: 2 bedrooms (both on the main level)
- Bathrooms: 1 bathroom
- Heating & cooling: Electric forced-air heating; Central air conditioning
- Interior features: Wood-burning stove fireplace
Neighborhood map
What this means for you Summary
Snapshot
- This is a 2-bed/1.0-bath manufactured listed at $125k.
Deal economics
- At list price, monthly cash flow is $298 ($4k/yr) — positive.
- The deal already cash-flows at list — no discount required.
- Meets the 1% rule at list price ($1k rent vs $125k).
- Recommended offer: $123k (1.5% below list) — sets the bar for market timing.
Location & tenants
- Location reads: area grade B — affects rentability + tenant quality, not the cash-flow math above.
- Emmett Independent District (town): math 33% / reading 43% proficiency, ranked #73 of 92 in ID (top 79%) — families likely to look elsewhere, expect single-tenant / working-renter base with shorter leases.
- Zoned schools: Shadow Butte Elementary School (math 41% / reading 35%, grade F, #251 of 357 statewide, top 71%, 463 students, 40% FRL); Emmett Middle School (math 30% / reading 45%, grade F, #75 of 109 statewide, top 69%, 533 students, 39% FRL); Emmett High School (math 42% / reading 67%, grade C-, #26 of 169 statewide, top 17%, 737 students, 23% FRL) — zoned schools average 34% FRL vs 49% district-wide (15 pts lower); this property's tenant base skews higher-income than the district average.
- Market conditions: 335 active listings in the ZIP; 198 units permitted in Gem County in 2024 (0 in 5+ unit buildings).
Forward outlook
- Local home prices are declining (-3.0%/yr); year-one equity from $864 of loan paydown is wiped out by about $4k of value loss. Plan a longer hold.
- Gem County population projected to shrink 4% by 2050 — rents likely to lag national; underwrite the cash flow, not the appreciation.
Negotiation context
- It's been on market 18 days — a 2% lower offer ($123k) is reasonable based on typical stale-listing flexibility.
- 2 sale attempts since 12y ago with the ask held roughly flat each time — persistent listings suggest the price (not the market) is what's stuck; bring a comps-based counter.
Risks & watch-outs
- Climate carrying-cost: extreme-heat days projected 7→19/yr by 2055 (HVAC capex compounding) — expect insurance premiums to compound above CPI over the hold.
Questions for the listing agent
- Is there a deadline driving the sale (1031 exchange, divorce, estate, relocation)? That informs how much negotiation room exists.
- What's the average days-on-market for RENTAL listings here right now (not sales)? A rising rental-DOM trend means longer vacancies and softer asking-rent achievability than the comps imply.
- What's the recent tenant-quality profile in this submarket — average credit score on applications, eviction rate, late-payment / NSF rate, and stable-employment percentage? A property-management company in the area should have these aggregated.
- How much new for-sale + rental construction is in the pipeline within 1–3 miles? Heavy new supply typically softens prices + rents 12–24 months out; constrained supply supports both.
Investment metrics
- 1% rule
- 1.18% ✓
- Cap rate
- 9.15%
- Cash-on-cash
- 10.22%
- DSCR
- 1.45
- GRM
- 7.1
CMA / ARV
- ARV (on-the-fly)
- $195,888
- Comps found
- 1
Show comp detail 1 sale within ~0.75 mi
| Address | Dist | Beds/Ba | Sqft | Sold | Price | $/sf | Match |
|---|---|---|---|---|---|---|---|
| 8389 Florence St | 0.15mi | 2/1.0 | 938 (+2%) | 20mo | $199,000 | $212 | 74 |
Match score weights: distance 35% · size 25% · config 20% · recency 20%. Top-matched comps best support the ARV.
Projected returns pro-forma
-3.0% appreciation · 3.0% rent growth · sell at horizon
- IRR
- -0.9%
- Equity multiple
- 0.96×
- Total profit
- $-1,256
- Equity at exit
- $18,623
- IRR
- 8.7%
- Equity multiple
- 1.67×
- Total profit
- $23,412
- Equity at exit
- $10,799
Cash invested: $34,972 (down + closing). Projections, not guarantees.
Landlord ↔ Tenant lean methodology
- Overall (STATE)
- 91 Strongly Landlord-Friendly
- State Idaho
- 91 Strongly Landlord-Friendly · R+18
- County
- — inherits STATE
- City
- — inherits STATE
ZIP-level market 83617
- Active inventory
- 335
- Price-to-rent
- 7.1×
Monthly cashflow live
- Estimated rent
- $1,469 medium interval (Pro) →
- Mortgage (P&I)
- −$655
- Tax est. 1.5%
- −$156 /mo · $1,874/yr
- Insurance
- −$52
- HOA
- −$0
- Vacancy / Maint / Mgmt
- −$309
- Net cashflow
- $298
Break-even live
Sensitivity live
| Price | -10% $384 | -5% $341 | +0% $298 | +5% $255 | +10% $211 |
|---|---|---|---|---|---|
| Rent | -10% $182 | -5% $240 | +0% $298 | +5% $356 | +10% $414 |
| Rate | -1.0pp $361 | -0.5pp $329 | base $298 | +0.5pp $265 | +1.0pp $232 |
UW: 25.0% down · 7.5% · 30yr · 1.5% tax · 5.0% vac · 8.0% maint · 8.0% mgmt
Financing live
Cash to close
- Down payment
- $31,225
- Closing costs
- $3,747
- Reserves months
- —
- Total cash needed
- —
Loan-product check · same deal, 3 products live
Conventional
25% down · 7.5% · 30yr
- Down + closing
- —
- Monthly P&I
- —
- Monthly cashflow
- —
- DSCR
- —
- Eligible?
- —
Personal DTI + credit; lowest rate.
DSCR
20% down · 8.5% · 30yr
- Down + closing
- —
- Monthly P&I
- —
- Monthly cashflow
- —
- DSCR
- —
- Eligible?
- —
No personal income docs; deal must DSCR.
Hard money
10% down · 12.0% · 12mo
- Down + closing
- —
- Monthly P&I
- —
- Monthly cashflow
- —
- DSCR
- —
- Eligible?
- —
Short-term bridge; refi at stabilization.
Listing history 4 events
-
2026-05-12$124,900 Active
-
2014-08-07soldstatus
-
2014-05-15$42,500
-
2012-03-01soldstatus
ⓘ Source: listings_history table (triggers on properties + properties_extension) + one-shot
backfill from property_details.listing_events for pre-trigger history.
Climate risk First Street
- Flood 2/10 Low FEMA zone X (unshaded) · 5% chance over 30 yrs
- Wildfire 1/10 Low
- Heat 5/10 Major 7 d/yr ≥97°F today · 19 d/yr by 30 yrs out
- Wind 1/10 Low
- Air quality 8/10 Severe 13 unhealthy d/yr today · 17 by 30 yrs out
Nearby sold comps map
Loading sold comps map…
Walkable amenities ~0.75 mi
Loading nearby amenities…
Taxation est. · year 1
- Rental income
- $17,633
- − Mortgage interest
- −$6,996
- − Property taxes
- −$1,874
- − Insurance
- −$624
- − Repairs & maintenance
- −$1,411
- − Management
- −$1,411
- − Depreciation
- −$3,633
- Taxable income
- $1,684
- Est. tax owed @ 24.0%
- −$404
- After-tax cash flow
- $3,168/yr
For passive investors: Depreciation is non-cash, so a rental often shows a tax loss while cash-flowing — sheltering income. Rental losses are passive: they offset passive income freely, and up to $25,000/yr can offset ordinary (W-2) income if you actively participate and your MAGI is under $100k (phasing out to $0 by $150k); unused losses carry forward. On sale, claimed depreciation is recaptured at up to 25%, and gains may owe capital-gains tax (a 1031 exchange can defer both). Figures are a year-1 estimate at your 24.0% rate — not tax advice; consult a CPA.
Schools (NCES district)
- District
- Emmett Independent District
- NCES district ID
- 1601020
- Math proficiency
- 33% ▼ -2.00%
- Reading proficiency
- 43% ▼ -2.00%
- Median HH income
- $42,067
- Composite
- 32.04/100
- National rank
- #5823
- State rank
- #73 of 92 in ID
Livability — Letha
No livability data for this city. (Only ~50 U.S. cities are tracked.)
Census & demographics
- Census place
- Letha, ID
- Population (ZIP)
- 17,333
Population outlook (Gem County) Hauer SSP2
- Today (2025)
- 17,343 people
- By 2030
- 17,416 · +0.4%
- By 2040
- 17,236 · -0.6%
- By 2050
- 16,613 · -4.2%
- By 2075
- 15,111 · -12.9%
- By 2100
- 12,472 · -28.1%
Race, ethnicity, and origin ACS 2023
- Neighborhood character
- Predominantly White (83%)
- Race & ethnicity
- White 83% Hispanic / Latino 10% Two or more races 9%
- Hispanic origin (detail)
- Mexican 8%
- Common ancestry
- Slovak 6% Portuguese 4% Lithuanian 4%
- Foreign-born
- 5% · Canada
- Languages at home
- 90% English-only · Spanish 7% Russian/Polish/Slavic 2%
Political lean MEDSL · Gem
- 2024 margin
- Solid R (+66.0) · D 16.0% · R 82.0% · Other 2.0%
- 2008→2024 swing
- -23.0pp toward R · 2008: -43.0pp · 2024: -66.0pp
- All cycles
- 2024: R+66.0 2020: R+61.7 2016: R+59.7 2012: R+44.8 2008: R+43.0
Not yet ingested
- Civics
- —
Market trends
- HPI YoY
- ▼ -186.67%
- Current HPI
- 265.361
- Rent YoY
- —
- Metro
- —
- State GDP YoY
- ▲ 4.51%
- F500 in state
- 6
Industry mix (Fortune 500 HQ in ID)
| Industry | F500 HQs | Revenue |
|---|---|---|
| Retail | 1 | $79B |
|
||
| Technology | 1 | $25B |
|
||
| Food / Agriculture | 1 | $6B |
|
||
Price history
+193.9% since first listed4 events — show timeline
- 2026-05-12 Listed $124,900 IMLS
- 2014-08-07 Sold (Public Records) — Public Records
- 2014-05-15 Listed $42,500 IMLS
- 2012-03-01 Sold (Public Records) — Public Records
Property tax history
-3.4%/yrLatest (2025): $190 · +1.9% YoY. Source: county tax records.
Cash-flow waterfall
monthlySold comps — $/sqft
last 12 mo · ≤1 miLoading sold comps…