 🏷️ Likely Rental
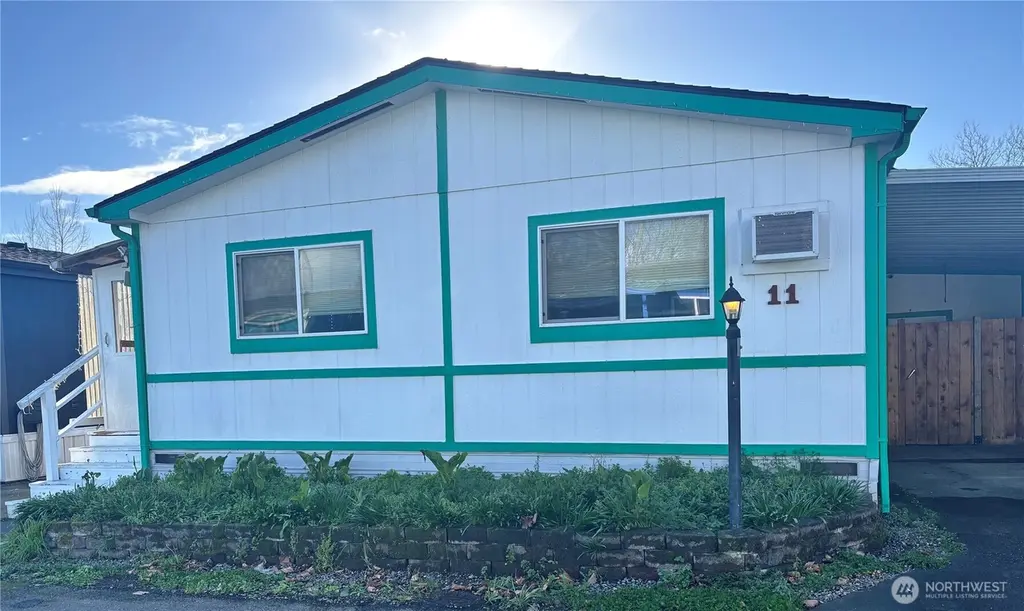
111 99th St S #11 · Tacoma, WA
Flood risk 6/10 · Moderate
- FEMA flood zone
- X (unshaded)
- Chance of flooding over 30 yrs
- 0.74%
- Est. flood insurance / yr
- $507 – $1,088
Fire risk 1/10 · Minimal
- Est. fire insurance / yr
- $604 – $1,122
Heat risk 3/10 · Minor
- Hot days now (above 87°F)
- 7 days/yr
- Hot days in 30 yrs
- 14 days/yr
Wind risk 1/10 · Minimal
- Chance of severe wind over 30 yrs
- —
Air-quality risk 7/10 · Major
- Unhealthy air days now
- 10 days/yr
- Unhealthy air days in 30 yrs
- 12 days/yr
Risk factors via First Street. Map © Google.
Why this score? — see what drove the A grade
The composite is a weighted blend of 9 inputs, each scored 0–100. Each bar is that input's sub-score; the figure is the points it added to the 100-point composite (weight × sub-score).
- Cash flow +30.0/30.0
- ARV discount +15.0/15.0
- 1% rule +10.0/10.0
- DSCR +10.0/10.0
- Appreciation +10.0/10.0
- Schools +3.9/10.0
- Livability +3.9/5.0
- Rent growth +3.2/5.0
- Condition / age +2.5/5.0
$84,950
🖨 Deal sheet (PDF) 📄 Offer letter ✓ Due diligence
Listing remarks
New Price and Motivated Seller! Welcome to Crystal Vista Park with easy access to freeways and amenities. This 2 bed 2 bath home gives you plenty of living space as well as storage. With an attached covered carport and enclosed patio, you have privacy and protection from weather. The interior has ample space for a dining area and living room, including A/C to keep you comfortable. Appliances to stay, plus a new roof was installed in 2021 with all new sheeting and plywood, giving you peace of mind. Come and see how convenient living can be! Monthly rent is $1099 and includes water, sewer and garbage.
Key facts
- New roof installed
- Enclosed patio
- Built 1991
Tags
Neighborhood map
What this means for you Summary
Snapshot
- This is a 2-bed/2.0-bath manufactured listed at $85k.
Deal economics
- At list price, monthly cash flow is $756 ($9k/yr) — positive.
- The deal already cash-flows at list — no discount required.
- Meets the 1% rule at list price ($2k rent vs $85k).
- Recommended offer: $80k (6.0% below list) — sets the bar for market timing.
- Cap rate 17.0% vs local median 2.9% in Tacoma — top-decile yield for the area; either an underpriced asset or a hidden risk that comps aren't pricing in. Stress-test before assuming the spread holds.
Location & tenants
- Location reads 78/100 on livability (#127 in WA, #2,535 nationally) — a middle-class / working-renter tenant base. Strengths: amenities A+, commute A+, housing A+; Watch: cost of living D, crime F.
- Franklin Pierce School District (suburban): math 35% / reading 51% proficiency, ranked #197 of 291 in WA (top 68%) — families likely to look elsewhere, expect single-tenant / working-renter base with shorter leases.
- Market conditions: Rents rising (+2.9%/yr); 158 active listings in the ZIP; 40 comparable units currently listed for rent nearby; rentals at typical pace (median 16d on market — plan ~3-4 weeks tenant-placement turnaround); 3,209 units permitted in Pierce County in 2024 (1,269 in 5+ unit buildings).
- This rent runs 31% of the median local income ($65k/yr) — at the standard rent-burdened threshold; future hikes will face affordability resistance.
Forward outlook
- In year one you build about $9k of equity ($588 loan paydown + $8k appreciation (10.0% local appreciation)).
- Pierce County population projected at +26% by 2050 — long-run rental-demand tailwind backs the buy-and-hold thesis.
- At projected returns (10.0% appreciation + 2.9% rent growth), your $24k cash investment doubles in ~2 years — after that, you're playing with house money.
- By year 4, paydown + projected appreciation supports a ~$32k cash-out refi (75% LTV) — recoverable capital for the next deal without selling this one.
Negotiation context
- It's been on market 83 days — a 6% lower offer ($80k) is reasonable based on typical stale-listing flexibility.
- 4 sale attempts since 13y ago; this cycle's ask has dropped $5k (6%) from the opening price — seller is motivated, your offer sets the floor, not the list.
Risks & watch-outs
- Climate carrying-cost: major flood risk — expect insurance premiums to compound above CPI over the hold.
Questions for the listing agent
- It's been on market 83 days. Have you received any prior offers? Is the seller open to a 6% concession, seller financing, or rate buy-down credit?
- Why hasn't it sold? Are there any deal-killer items the seller is aware of (foundation, flood, title, zoning, code violations)?
- Is there a deadline driving the sale (1031 exchange, divorce, estate, relocation)? That informs how much negotiation room exists.
- Schools are B-rated — typically a magnet for longer-tenancy family renters. What's the average tenant stay here, and is there a school-zone premium baked into asking?
- Crime grade is F in this area — have there been break-ins, vandalism, or insurance claims at this property in the last 3 years? What carrier currently insures it and at what premium?
- What's the average days-on-market for RENTAL listings here right now (not sales)? A rising rental-DOM trend means longer vacancies and softer asking-rent achievability than the comps imply.
- What's the recent tenant-quality profile in this submarket — average credit score on applications, eviction rate, late-payment / NSF rate, and stable-employment percentage? A property-management company in the area should have these aggregated.
- How much new for-sale + rental construction is in the pipeline within 1–3 miles? Heavy new supply typically softens prices + rents 12–24 months out; constrained supply supports both.
Investment metrics
- 1% rule
- 2.00% ✓
- Cap rate
- 16.98%
- Cash-on-cash
- 38.16%
- DSCR
- 2.70
- GRM
- 4.2
CMA / ARV
- ARV (median comp)
- $153,976
- List price
- $84,950
- Delta
- -44.83%
- Verdict
- UNDERPRICED
- Comps
- 4 within 2.0 mi
Projected returns pro-forma
10.0% appreciation · 2.93% rent growth · sell at horizon
- IRR
- 53.7%
- Equity multiple
- 4.97×
- Total profit
- $94,351
- Equity at exit
- $76,530
- IRR
- 47.2%
- Equity multiple
- 11.08×
- Total profit
- $239,767
- Equity at exit
- $165,039
Cash invested: $23,786 (down + closing). Projections, not guarantees.
Landlord ↔ Tenant lean methodology
- Overall (STATE)
- 28 Tenant-Leaning
- State Washington
- 28 Tenant-Leaning · D+8
- County
- — inherits STATE
- City
- — inherits STATE
ZIP-level market 98444
- Home prices YoY
- 3.6%
- Rents YoY
- 2.9%
- Active inventory
- 158
- Price-to-rent
- 4.2×
Monthly cashflow live
- Estimated rent
- $1,698 high interval (Pro) →
- Mortgage (P&I)
- −$445
- Tax from tax record
- −$104 /mo · $1,252/yr
- Insurance
- −$35
- HOA
- −$0
- Vacancy / Maint / Mgmt
- −$357
- Net cashflow
- $756
Break-even live
Sensitivity live
| Price | -10% $805 | -5% $781 | +0% $756 | +5% $732 | +10% $708 |
|---|---|---|---|---|---|
| Rent | -10% $622 | -5% $689 | +0% $756 | +5% $824 | +10% $891 |
| Rate | -1.0pp $799 | -0.5pp $778 | base $756 | +0.5pp $734 | +1.0pp $712 |
UW: 25.0% down · 7.5% · 30yr · 1.5% tax · 5.0% vac · 8.0% maint · 8.0% mgmt
Financing live
Cash to close
- Down payment
- $21,238
- Closing costs
- $2,548
- Reserves months
- —
- Total cash needed
- —
Loan-product check · same deal, 3 products live
Conventional
25% down · 7.5% · 30yr
- Down + closing
- —
- Monthly P&I
- —
- Monthly cashflow
- —
- DSCR
- —
- Eligible?
- —
Personal DTI + credit; lowest rate.
DSCR
20% down · 8.5% · 30yr
- Down + closing
- —
- Monthly P&I
- —
- Monthly cashflow
- —
- DSCR
- —
- Eligible?
- —
No personal income docs; deal must DSCR.
Hard money
10% down · 12.0% · 12mo
- Down + closing
- —
- Monthly P&I
- —
- Monthly cashflow
- —
- DSCR
- —
- Eligible?
- —
Short-term bridge; refi at stabilization.
Rent comps 40 comps
| Address | Beds | Baths | Sqft | Rent | $/sqft | DOM | Units | Dist |
|---|---|---|---|---|---|---|---|---|
| 319 104th St E Tacoma, WA | 3.0 | 1.0 | 990 | $2,285 | $2.31 | 5d | 1 | 0.36mi |
| 10419 Barnes Ln S Unit 1/2 Tacoma, WA | 2.0 | 1.5 | 900 | $2,100 | $2.33 | 44d | 1 | 0.71mi |
| 10925 Park Ave S Tacoma, WA | 2.0 | 1.0 | 709 | $1,775 | $2.50 | 25d | 5 | 0.72mi |
| 10925 Park Ave S Tacoma, WA | 3.0 | 1.0–2.0 | 838 | $1,880 | $2.24 | 0d | 11 | 0.72mi |
| 8624 Pacific Ave S Apt 6 Tacoma, WA | 2.0 | 1.5 | 900 | $1,475 | $1.64 | 3d | 1 | 0.78mi |
| 1111 99th Street Ct E Tacoma, WA | 1.0–2.0 | 1.0 | 775 | $1,450 | $1.87 | 44d | 4 | 0.83mi |
| 416 111th St Ct E Tacoma, WA | 1.0–3.0 | 1.0–2.0 | 925 | $2,038 | $2.20 | 0d | 51 | 0.84mi |
| 8445 Pacific Ave Tacoma, WA | 1.0–2.0 | 1.0–2.0 | 820 | $1,975 | $2.41 | 0d | 2 | 0.85mi |
| 8402 S C St Tacoma, WA | 2.0 | 2.5 | 1058 | $1,886 | $1.78 | 0d | 1 | 0.89mi |
| 1106 106th St E Tacoma, WA | 2.0 | 1.0 | 1100 | $2,175 | $1.98 | 44d | 1 | 0.95mi |
| 150 S 84th St Unit B Tacoma, WA | 2.0 | 1.0 | 1000 | $1,700 | $1.70 | 3d | 1 | 0.95mi |
| 806 112th St E Parkland, WA | 1.0–2.0 | 1.0–2.0 | 800 | $1,500 | $1.88 | 44d | 1 | 0.98mi |
| 11424 A St S Tacoma, WA | 2.0 | 1.0 | 925 | $1,750 | $1.89 | 44d | 1 | 1.03mi |
| 11424 A St S Unit 202 Tacoma, WA | 2.0 | 1.0 | 925 | $1,450 | $1.57 | 25d | 1 | 1.03mi |
| 1017 110th Street Ct E Tacoma, WA | 2.0 | 2.0 | 902 | $1,762 | $1.95 | 5d | 3 | 1.03mi |
| 8412 E McKinley Ave Unit 7 Tacoma, WA | 1.0 | 1.0 | 784 | $1,150 | $1.47 | 25d | 1 | 1.05mi |
| 8402 E McKinley Ave Unit Iola Apartments-6 Tacoma, WA | 1.0 | 1.0 | 700 | $1,150 | $1.64 | 25d | 1 | 1.06mi |
| 1015 112th St E Tacoma, WA | 3.0 | 1.0–2.0 | 833 | $1,938 | $2.33 | 3d | 15 | 1.07mi |
| 8324 Park Ave S Tacoma, WA | 1.0 | 1.0 | 680 | $1,350 | $1.99 | 18d | 1 | 1.11mi |
| 8015 Pacific Ave Unit 20 Tacoma, WA | 2.0 | 1.5 | 1100 | $1,995 | $1.81 | 25d | 1 | 1.18mi |
| 1122 Lafayette St S Tacoma, WA | 1.0 | 1.0 | 650 | $1,450 | $2.23 | 5d | 1 | 1.20mi |
| 11302 10th Avenue Ct E Tacoma, WA | 3.0 | 1.0–2.0 | 869 | $2,037 | $2.34 | 5d | 16 | 1.23mi |
| 7843 Pacific Ave Tacoma, WA | 1.0 | 1.0 | 600 | $1,695 | $2.83 | 25d | 1 | 1.24mi |
| 7904 Pacific Ave Tacoma, WA | 1.0–2.0 | 1.0–2.0 | 647 | $1,749 | $2.70 | 0d | 12 | 1.25mi |
| 7823 Pacific Ave Tacoma, WA | 1.0–2.0 | 1.0 | 699 | $1,629 | $2.33 | 0d | 4 | 1.30mi |
| 1420 112th St S Tacoma, WA | 1.0 | 1.0 | 550 | $1,200 | $2.18 | 5d | 1 | 1.31mi |
| 702 119th St S Unit B Tacoma, WA | 2.0 | 1.0 | 800 | $1,795 | $2.24 | 44d | 1 | 1.32mi |
| 10710 17th Ave S Tacoma, WA | 1.0–2.0 | 1.0–2.0 | 911 | $2,025 | $2.22 | 0d | 15 | 1.33mi |
| 7645 Pacific Ave Tacoma, WA | 2.0 | 1.0 | 932 | $1,650 | $1.77 | 8d | 2 | 1.36mi |
| 1756 106th St S Tacoma, WA | 1.0–2.0 | 1.0 | 662 | $1,338 | $2.02 | 0d | 2 | 1.40mi |
| 1627 112th St S Tacoma, WA | 2.0 | 1.0 | 814 | $2,195 | $2.70 | 44d | 1 | 1.40mi |
| 7637 Pacific Ave Tacoma, WA | 1.0–2.0 | 1.0–2.0 | 700 | $1,600 | $2.29 | 5d | 6 | 1.41mi |
| 9315 S Ash St Tacoma, WA | 2.0 | 1.5 | 828 | $1,550 | $1.87 | 17d | 1 | 1.41mi |
| 7611 Pacific Ave Unit A-1 Tacoma, WA | 1.0 | 1.0 | 576 | $1,300 | $2.26 | 25d | 1 | 1.43mi |
| 7611 Pacific Ave Unit A-1 Tacoma, WA | 1.0 | 1.0 | 576 | $1,300 | $2.26 | 15d | 1 | 1.43mi |
| 7611 Pacific Ave Tacoma, WA | 1.0 | 1.0 | 576 | $1,300 | $2.26 | 17d | 1 | 1.43mi |
| 323 Garfield St S Tacoma, WA | 1.0 | 1.0 | 549 | $1,595 | $2.91 | 3d | 3 | 1.44mi |
| 7603 Pacific Ave Unit 9 Tacoma, WA | 1.0 | 1.0 | 570 | $1,095 | $1.92 | 25d | 1 | 1.45mi |
| 7605 S C St Apt 7 Tacoma, WA | 2.0 | 1.0 | 800 | $1,445 | $1.81 | 8d | 1 | 1.45mi |
| 7603 Pacific Ave Unit 301 Tacoma, WA | 2.0 | 1.0 | 880 | $1,250 | $1.42 | 25d | 1 | 1.45mi |
Listing history 25 events
-
2026-06-18days on market $84,950 Active 83 DOM
-
2026-06-17days on market $84,950 Active 82 DOM
-
2026-06-16days on market $84,950 Active 81 DOM
-
2026-06-15days on market $84,950 Active 80 DOM
-
2026-06-13days on market $84,950 Active 78 DOM
-
2026-06-13days on market $84,950 Active 77 DOM
-
2026-06-09days on market $84,950 Active 74 DOM
-
2026-06-08days on market $84,950 Active 73 DOM
-
2026-06-07days on market $84,950 Active 72 DOM
-
2026-06-04days on market $84,950 Active 69 DOM
-
2026-06-03days on market $84,950 Active 68 DOM
-
2026-06-02days on market $84,950 Active 67 DOM
-
2026-06-01days on market $84,950 Active 66 DOM
-
2026-05-31days on market $84,950 Active 65 DOM
-
2026-04-24price $84,950
-
2026-03-27$90,000 Active
-
2022-12-09soldstatus $110,000 Closed
-
2022-11-28status Pending
-
2022-11-17price $119,000
-
2022-10-20price $130,000
-
2022-09-12$150,000 Active
-
2014-03-03soldstatus $12,000 Sold
-
2013-11-21status Active
-
2013-11-15status Pending Inspection
-
2013-11-05$19,500 Active
ⓘ Source: listings_history table (triggers on properties + properties_extension) + one-shot
backfill from property_details.listing_events for pre-trigger history.
Tax reassessment forecast WA · Resets to sale price
- Current annual tax
- $1,252 · $104/mo
- Projected year-2 tax
- $1,252 · $104/mo
- Expected delta
- $0/yr ($0/mo · 0.0%)
ⓘ Screening estimate from a state-policy table — verify with the county assessor before closing.
Climate risk First Street
- Flood 6/10 Major FEMA zone X (unshaded) · 74% chance over 30 yrs
- Wildfire 1/10 Low
- Heat 3/10 Moderate 7 d/yr ≥87°F today · 14 d/yr by 30 yrs out
- Wind 1/10 Low
- Air quality 7/10 Severe 10 unhealthy d/yr today · 12 by 30 yrs out
Nearby sold comps map
Loading sold comps map…
Walkable amenities ~0.75 mi
Loading nearby amenities…
Taxation est. · year 1
- Rental income
- $20,380
- − Mortgage interest
- −$4,759
- − Property taxes
- −$1,252
- − Insurance
- −$425
- − Repairs & maintenance
- −$1,630
- − Management
- −$1,630
- − Depreciation
- −$2,471
- Taxable income
- $8,213
- Est. tax owed @ 24.0%
- −$1,971
- After-tax cash flow
- $7,107/yr
For passive investors: Depreciation is non-cash, so a rental often shows a tax loss while cash-flowing — sheltering income. Rental losses are passive: they offset passive income freely, and up to $25,000/yr can offset ordinary (W-2) income if you actively participate and your MAGI is under $100k (phasing out to $0 by $150k); unused losses carry forward. On sale, claimed depreciation is recaptured at up to 25%, and gains may owe capital-gains tax (a 1031 exchange can defer both). Figures are a year-1 estimate at your 24.0% rate — not tax advice; consult a CPA.
Schools (NCES district)
- District
- Franklin Pierce School District
- NCES district ID
- 5302940
- Math proficiency
- 35% ▬ 0.00%
- Reading proficiency
- 51% ▲ 2.00%
- Median HH income
- $49,240
- Composite
- 39.18/100
- National rank
- #8227
- State rank
- #197 of 291 in WA
Livability — Tacoma
- Score
- 78/100
- State rank
- #127
- US rank
- #2535
Category grades
Schools grade is shown separately in the Schools card above.
Census & demographics
- Census place
- Tacoma, WA
- County
- Pierce County · 788,257 people
- City population
- 212,935
- Metro
- Seattle-Tacoma-Bellevue, WA
- Population (ZIP)
- 35,754
- Household income
- $65,342
- Rent vs Own
- Severe rent burden
- 2169.0
Population outlook (Pierce County) Hauer SSP2
- Today (2025)
- 956,648 people
- By 2030
- 1,010,862 · +5.7%
- By 2040
- 1,113,170 · +16.4%
- By 2050
- 1,206,524 · +26.1%
- By 2075
- 1,436,425 · +50.2%
- By 2100
- 1,563,654 · +63.5%
Race, ethnicity, and origin ACS 2023
- Neighborhood character
- Highly diverse neighborhood (Simpson 0.77)
- Race & ethnicity
- White 40% Hispanic / Latino 19% Two or more races 17% Black 16% Asian 11% Pacific Islander 4% Native American 1%
- Hispanic origin (detail)
- Mexican 13% Puerto Rican 1%
- Common ancestry
- Portuguese 3% Scotch-Irish 2% Swedish 1%
- Foreign-born
- 21% · Canada, South Korea, Vietnam
- Languages at home
- 68% English-only · Spanish 13% Other Asian/Pacific 6% Korean 3%
Political lean MEDSL · Pierce
- 2024 margin
- D (+10.8) · D 53.9% · R 43.1% · Other 3.0%
- 2008→2024 swing
- -1.4pp toward R · 2008: 12.2pp · 2024: 10.8pp
- All cycles
- 2024: D+10.8 2020: D+11.2 2016: D+7.5 2012: D+11.0 2008: D+12.2
Not yet ingested
- Civics
- —
Market trends
- HPI YoY
- ▲ 45.01%
- Current HPI
- 1297.51
- Rent YoY
- ▲ 2.93%
- Metro
- Seattle-Tacoma-Bellevue, WA
- State GDP YoY
- ▲ 4.65%
- F500 in state
- 22
Industry mix (Fortune 500 HQ in WA)
| Industry | F500 HQs | Revenue |
|---|---|---|
| Retail | 2 | $269B |
|
||
| Technology / Retail | 1 | $638B |
|
||
| Technology | 1 | $245B |
|
||
| Telecommunications | 1 | $38B |
|
||
| Food / Beverage | 1 | $36B |
|
||
| Automotive / Trucks | 1 | $34B |
|
||
Price history
+335.6% since first listed11 events — show timeline
- 2026-04-24 Price Changed $84,950 NWMLS as Distributed by MLS Grid
- 2026-03-27 Listed $90,000 NWMLS as Distributed by MLS Grid
- 2022-12-09 Sold (MLS) $110,000 NWMLS as Distributed by MLS Grid
- 2022-11-28 Pending — NWMLS as Distributed by MLS Grid
- 2022-11-17 Price Changed $119,000 NWMLS as Distributed by MLS Grid
- 2022-10-20 Price Changed $130,000 NWMLS as Distributed by MLS Grid
- 2022-09-12 Listed $150,000 NWMLS as Distributed by MLS Grid
- 2014-03-03 Sold (MLS) $12,000 NWMLS as Distributed by MLS Grid
- 2013-11-21 Relisted — NWMLS as Distributed by MLS Grid
- 2013-11-15 Pending — NWMLS as Distributed by MLS Grid
- 2013-11-05 Listed $19,500 NWMLS as Distributed by MLS Grid
Property tax history
+8.8%/yrLatest (2026): $1,252 · +6.7% YoY. Source: county tax records.
Cash-flow waterfall
monthlySold comps — $/sqft
last 12 mo · ≤1 miLoading sold comps…