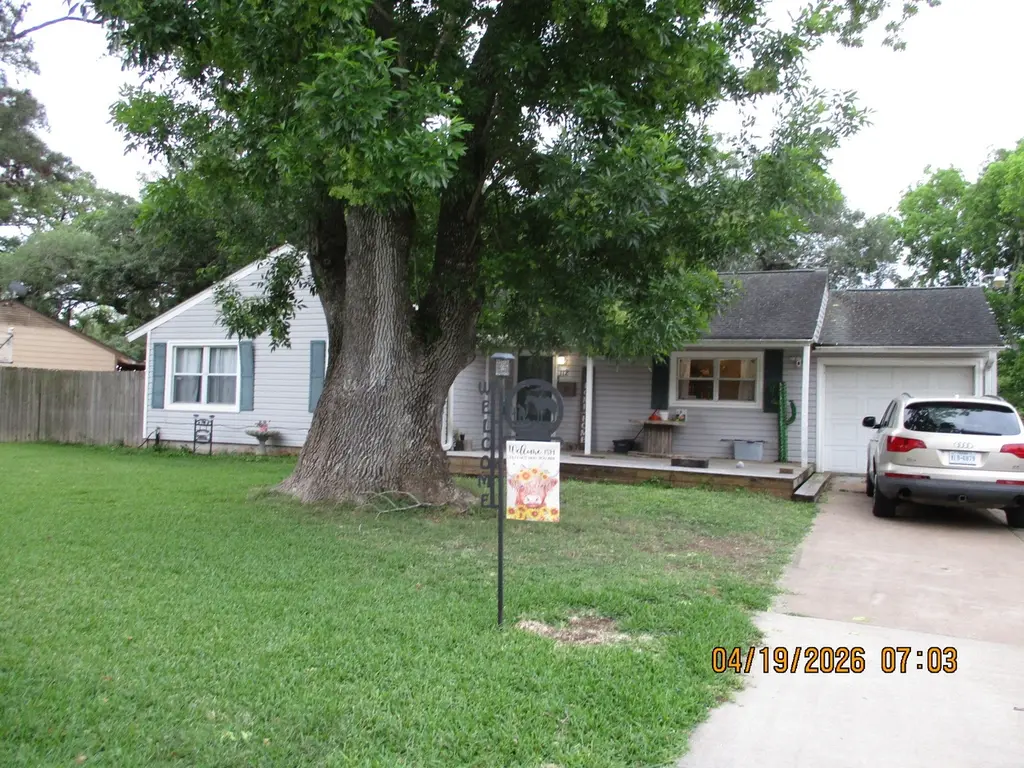
112 Chinaberry St · Lake Jackson, TX
Flood risk 6/10 · Moderate
- FEMA flood zone
- X
- Chance of flooding over 30 yrs
- 0.7%
- Est. flood insurance / yr
- $507 – $1,088
Fire risk 2/10 · Minimal
- Est. fire insurance / yr
- $1,222 – $2,270
Heat risk 10/10 · Severe
- Hot days now (above 114°F)
- 7 days/yr
- Hot days in 30 yrs
- 26 days/yr
Wind risk 9/10 · Severe
- Chance of severe wind over 30 yrs
- 99.0%
Air-quality risk 2/10 · Minimal
- Unhealthy air days now
- 1 days/yr
- Unhealthy air days in 30 yrs
- 1 days/yr
Risk factors via First Street. Map © Google.
Why this score? — see what drove the D grade
The composite is a weighted blend of 9 inputs, each scored 0–100. Each bar is that input's sub-score; the figure is the points it added to the 100-point composite (weight × sub-score).
- Cash flow +13.1/30.0
- ARV discount +8.8/15.0
- 1% rule +4.2/10.0
- DSCR +3.9/10.0
- Livability +3.9/5.0
- Schools +3.7/10.0
- Condition / age +2.5/5.0
- Rent growth +2.2/5.0
- Appreciation +0.0/10.0
$215,000
🖨 Deal sheet (PDF) 📄 Offer letter ✓ Due diligence
Listing remarks
Special Lake Jackson home. MOTIVATED SELLERS. Added on master bath with walk in closet in 262 sq ft extension of master bedroom. Kitchen has vinyl flooring, master bedroom has carpet, master bath is ceramic tile, hardwood in other bedrooms and hall area. Property has a separate room that can be used as a study/office, inside laundry room. Outside is a she shed that is currently being used as a 4th bedroom, room is finished, enclosed and has a window a/c unit' Covered patio area, large back yard. Property backs up to LJ owned property Property is owned by the Realtor's son
Key facts
- Master bath
- Covered patio
- Large back yard
Tags
Property features AI
Finance
- Other: Lot approximately 0.313 acres
Exterior
- Utilities: Public water; Public sewer
- Home design: Residential property; Full ownership; Slab foundation
- Construction: Built in 1960; Vinyl siding; Wood siding; Composition roof
- Exterior features: Located in a subdivision
Interior
- Kitchen: Gas oven; Gas range; Pantry
- Bedrooms: Primary bedroom (First floor) — approximately 14x20; Bedroom (First floor) — approximately 14x12; Bedroom (First floor) — approximately 12x12; Office (First floor) — approximately 8x12; Dining room (First floor) — approximately 12x14; Kitchen (First floor) — approximately 12x6; Primary bathroom (First floor) — approximately 12x12
- Flooring: Carpet; Tile; Vinyl; Wood
- Bathrooms: 2 full bathrooms
- Heating & cooling: Central heating (Gas); Central electric air conditioning
- Interior features: Double vanity; Jetted tub; Separate shower; Tub/shower combination; Pantry; One fireplace; Total of 7 rooms
- Laundry & utility: Washer hookup; Electric dryer hookup; Gas dryer hookup
Neighborhood map
What this means for you Summary
Snapshot
- This is a 3-bed/2.0-bath single-family listed at $215k.
Deal economics
- At list price, monthly cash flow is $-9 ($-106/yr) — negative.
- To cash-flow at today's rent, offer at most $213k (0.7% below list).
- To meet the 1% rule (rent ≥ 1% of price), the offer needs to be $198k (8.1% below list).
- Recommended offer: $198k (8.1% below list) — sets the bar for 1% rule.
- Cap rate 6.2% vs local median 3.8% in Lake Jackson — top-decile yield for the area; either an underpriced asset or a hidden risk that comps aren't pricing in. Stress-test before assuming the spread holds.
Location & tenants
- Location reads 78/100 on livability (#76 in TX, #2,709 nationally) — a middle-class / working-renter tenant base. Strengths: employment A+, cost of living A+, housing A+; Watch: amenities C-, commute F.
- Brazosport ISD (suburban): math 43% / reading 41% proficiency, ranked #305 of 826 in TX (top 37%) — families likely to look elsewhere, expect single-tenant / working-renter base with shorter leases.
- Zoned schools: A P Beutel El (math 55% / reading 56%, grade C, #587 of 4,322 statewide, top 14%, 539 students, 60% FRL); Rasco Middle (math 45% / reading 50%, grade C-, #408 of 1,662 statewide, top 25%, 731 students, 58% FRL); Brazoswood H S (math 38% / reading 44%, grade F, #774 of 1,632 statewide, top 49%, 2,398 students, 54% FRL) — zoned schools at 57% FRL track the district average.
- Market conditions: Rents soft (-1.1%/yr); 231 active listings in the ZIP; 3 comparable units currently listed for rent nearby; rentals lingering (median 46d on market — plan ~5-8 weeks vacancy on turnover, expect pricing pressure); 100% of comp listings sitting > 30 days — soft ceiling on asking rent; solid renter incomes; 3,960 units permitted in Brazoria County in 2024 (593 in 5+ unit buildings).
Forward outlook
- Local home prices are declining (-3.0%/yr); year-one equity from $1k of loan paydown is wiped out by about $6k of value loss. Plan a longer hold.
- Brazoria County population projected at +44% by 2050 — long-run rental-demand tailwind backs the buy-and-hold thesis.
Negotiation context
- It's been on market 61 days — a 6% lower offer ($202k) is reasonable based on typical stale-listing flexibility.
Risks & watch-outs
- Climate carrying-cost: major flood risk; severe wind risk, 99% chance of damaging wind over 30y; extreme-heat days projected 7→26/yr by 2055 (HVAC capex compounding) — expect insurance premiums to compound above CPI over the hold.
Questions for the listing agent
- What do current leases actually rent for vs. the listed asking? Can we see a recent rent roll and the last 12 months of T-12 income?
- It's been on market 61 days. Have you received any prior offers? Is the seller open to a 8% concession, seller financing, or rate buy-down credit?
- Built in 1960 — when were the roof, HVAC, electrical panel, plumbing, and water heater last replaced?
- Why hasn't it sold? Are there any deal-killer items the seller is aware of (foundation, flood, title, zoning, code violations)?
- Is there a deadline driving the sale (1031 exchange, divorce, estate, relocation)? That informs how much negotiation room exists.
- The area grade is low — what's the realistic commute time and amenity access for the typical tenant pool here? Any planned neighborhood developments (good or bad) we should know about?
- What's the average days-on-market for RENTAL listings here right now (not sales)? A rising rental-DOM trend means longer vacancies and softer asking-rent achievability than the comps imply.
- What's the recent tenant-quality profile in this submarket — average credit score on applications, eviction rate, late-payment / NSF rate, and stable-employment percentage? A property-management company in the area should have these aggregated.
- How much new for-sale + rental construction is in the pipeline within 1–3 miles? Heavy new supply typically softens prices + rents 12–24 months out; constrained supply supports both.
Investment metrics
- 1% rule
- 0.92% ✗
- Cap rate
- 6.24%
- Cash-on-cash
- -0.18%
- DSCR
- 0.99
- GRM
- 9.1
CMA / ARV
- ARV (median comp)
- $221,267
- List price
- $215,000
- Delta
- -2.83%
- Verdict
- FAIR
- Comps
- 20 within 1.0 mi
Show comp detail 12 sales within ~0.75 mi
| Address | Dist | Beds/Ba | Sqft | Sold | Price | $/sf | Match |
|---|---|---|---|---|---|---|---|
| 58 Plantation Ct | 0.46mi | 3/2.0 | 2,112 (-2%) | 4mo | $320,000 | $152 | 71 |
| 607 Magnolia St | 0.39mi | 3/2.5 | 2,100 (-3%) | 13mo | $279,000 | $133 | 65 |
| 244 Narcissus St | 0.30mi | 4/2.0 (+1) | 2,248 (+4%) | 12mo | $265,000 | $118 | 64 |
| 232 Laurel St | 0.08mi | 4/2.0 (+1) | 1,834 (-15%) | 4mo | $239,999 | $131 | 63 |
| 520 Sycamore St | 0.54mi | 3/2.0 | 1,971 (-8%) | 4mo | $285,000 | $145 | 58 |
| 542 Sycamore St | 0.51mi | 4/2.0 (+1) | 1,937 (-10%) | 1mo | $249,900 | $129 | 54 |
| 412 Narcissus St | 0.65mi | 4/3.0 (+1) | 2,219 (+3%) | 2mo | $315,000 | $142 | 53 |
| 107 Sage St | 0.66mi | 4/3.0 (+1) | 2,096 (-3%) | 8mo | $245,000 | $117 | 49 |
| 513 Magnolia St | 0.53mi | 4/2.0 (+1) | 1,833 (-15%) | 0mo | $225,000 | $123 | 45 |
| 119 Bois D'arc | 0.57mi | 4/2.5 (+1) | 1,845 (-14%) | 1mo | $219,000 | $119 | 42 |
| 810 Center Way St | 0.75mi | 3/3.5 | 2,054 (-5%) | 13mo | $349,900 | $170 | 41 |
| 205 Nasturtium St | 0.44mi | 4/2.5 (+1) | 2,471 (+15%) | 10mo | $260,000 | $105 | 39 |
Match score weights: distance 35% · size 25% · config 20% · recency 20%. Top-matched comps best support the ARV.
Projected returns pro-forma
-3.0% appreciation · 0.0% rent growth · sell at horizon
- IRR
- -20.2%
- Equity multiple
- 0.32×
- Total profit
- $-41,113
- Equity at exit
- $32,057
- IRR
- -22.3%
- Equity multiple
- 0.03×
- Total profit
- $-58,576
- Equity at exit
- $18,589
Cash invested: $60,200 (down + closing). Projections, not guarantees.
Landlord ↔ Tenant lean methodology
- Overall (STATE)
- 87 Strongly Landlord-Friendly
- State Texas
- 87 Strongly Landlord-Friendly · R+5
- County
- — inherits STATE
- City
- — inherits STATE
ZIP-level market 77566
- Home prices YoY
- -25.2%
- Rents YoY
- -1.1%
- Active inventory
- 231
- Price-to-rent
- 9.1×
Monthly cashflow live
- Estimated rent
- $1,976 medium interval (Pro) →
- Mortgage (P&I)
- −$1,127
- Tax from tax record
- −$353 /mo · $4,236/yr
- Insurance
- −$90
- HOA
- −$0
- Vacancy / Maint / Mgmt
- −$415
- Net cashflow
- $-9
Break-even live
Sensitivity live
| Price | -10% $113 | -5% $52 | +0% $-9 | +5% $-70 | +10% $-131 |
|---|---|---|---|---|---|
| Rent | -10% $-165 | -5% $-87 | +0% $-9 | +5% $69 | +10% $147 |
| Rate | -1.0pp $99 | -0.5pp $46 | base $-9 | +0.5pp $-65 | +1.0pp $-121 |
UW: 25.0% down · 7.5% · 30yr · 1.5% tax · 5.0% vac · 8.0% maint · 8.0% mgmt
Financing live
Cash to close
- Down payment
- $53,750
- Closing costs
- $6,450
- Reserves months
- —
- Total cash needed
- —
Loan-product check · same deal, 3 products live
Conventional
25% down · 7.5% · 30yr
- Down + closing
- —
- Monthly P&I
- —
- Monthly cashflow
- —
- DSCR
- —
- Eligible?
- —
Personal DTI + credit; lowest rate.
DSCR
20% down · 8.5% · 30yr
- Down + closing
- —
- Monthly P&I
- —
- Monthly cashflow
- —
- DSCR
- —
- Eligible?
- —
No personal income docs; deal must DSCR.
Hard money
10% down · 12.0% · 12mo
- Down + closing
- —
- Monthly P&I
- —
- Monthly cashflow
- —
- DSCR
- —
- Eligible?
- —
Short-term bridge; refi at stabilization.
Rent comps 3 comps
| Address | Beds | Baths | Sqft | Rent | $/sqft | DOM | Units | Dist |
|---|---|---|---|---|---|---|---|---|
| 301 Cypress St Lake Jackson, TX | 3.0 | 2.5 | 1878 | $2,000 | $1.06 | 45d | 1 | 0.44mi |
| 214 Oleander St Lake Jackson, TX | 3.0 | 2.0 | 1423 | $2,000 | $1.41 | 45d | 1 | 0.77mi |
| 523 Wisteria St Lake Jackson, TX | 3.0 | 1.5 | 1508 | $1,775 | $1.18 | 45d | 1 | 0.94mi |
Listing history 18 events
-
2026-06-22price $215,000 Active 61 DOM
-
2026-06-21days on market $225,000 Active 61 DOM
-
2026-06-18days on market $225,000 Active 58 DOM
-
2026-06-17days on market $225,000 Active 57 DOM
-
2026-06-16days on market $225,000 Active 56 DOM
-
2026-06-15days on market $225,000 Active 55 DOM
-
2026-06-13days on market $225,000 Active 53 DOM
-
2026-06-09days on market $225,000 Active 49 DOM
-
2026-06-08days on market $225,000 Active 48 DOM
-
2026-06-07days on market $225,000 Active 47 DOM
-
2026-06-04days on market $225,000 Active 44 DOM
-
2026-06-03days on market $225,000 Active 43 DOM
-
2026-06-02days on market $225,000 Active 42 DOM
-
2026-06-01days on market $225,000 Active 41 DOM
-
2026-05-31days on market $225,000 Active 40 DOM
-
2026-05-11price $225,000 588-char remark
-
2026-04-21$240,000 Active 588-char remark
-
2002-10-17soldstatus
ⓘ Source: listings_history table (triggers on properties + properties_extension) + one-shot
backfill from property_details.listing_events for pre-trigger history.
Tax reassessment forecast TX · Resets to sale price
- Current annual tax
- $4,236 · $353/mo
- Projected year-2 tax
- $4,236 · $353/mo
- Expected delta
- $0/yr ($0/mo · 0.0%)
ⓘ Screening estimate from a state-policy table — verify with the county assessor before closing.
Climate risk First Street
- Flood 6/10 Major FEMA zone X · 70% chance over 30 yrs
- Wildfire 2/10 Low
- Heat 10/10 Extreme 7 d/yr ≥114°F today · 26 d/yr by 30 yrs out
- Wind 9/10 Extreme 99% chance of damaging wind over 30 yrs
- Air quality 2/10 Low 1 unhealthy d/yr today · 1 by 30 yrs out
Nearby sold comps map
Loading sold comps map…
Walkable amenities ~0.75 mi
Loading nearby amenities…
Taxation est. · year 1
- Rental income
- $23,715
- − Mortgage interest
- −$12,043
- − Property taxes
- −$4,236
- − Insurance
- −$1,075
- − Repairs & maintenance
- −$1,897
- − Management
- −$1,897
- − Depreciation
- −$6,255
- Taxable loss
- −$3,688
- Est. tax savings @ 24.0%
- +$885
- After-tax cash flow
- $779/yr
For passive investors: Depreciation is non-cash, so a rental often shows a tax loss while cash-flowing — sheltering income. Rental losses are passive: they offset passive income freely, and up to $25,000/yr can offset ordinary (W-2) income if you actively participate and your MAGI is under $100k (phasing out to $0 by $150k); unused losses carry forward. On sale, claimed depreciation is recaptured at up to 25%, and gains may owe capital-gains tax (a 1031 exchange can defer both). Figures are a year-1 estimate at your 24.0% rate — not tax advice; consult a CPA.
Schools (NCES district)
- District
- Brazosport ISD
- NCES district ID
- 4811190
- Math proficiency
- 43% ▼ -6.00%
- Reading proficiency
- 41% ▼ -2.00%
- Median HH income
- $57,024
- Composite
- 36.84/100
- National rank
- #4557
- State rank
- #305 of 826 in TX
Livability — Lake Jackson
- Score
- 78/100
- State rank
- #76
- US rank
- #2709
Category grades
Schools grade is shown separately in the Schools card above.
Census & demographics
- Census place
- Lake Jackson, TX
- County
- Brazoria County · 374,982 people
- City population
- 30,246
- Metro
- Houston-The Woodlands-Sugar Land, TX
- Population (ZIP)
- 30,246
- Household income
- $92,586
- Rent vs Own
- Severe rent burden
- 1126.0
Population outlook (Brazoria County) Hauer SSP2
- Today (2025)
- 420,414 people
- By 2030
- 457,585 · +8.8%
- By 2040
- 532,232 · +26.6%
- By 2050
- 605,399 · +44.0%
- By 2075
- 779,358 · +85.4%
- By 2100
- 883,759 · +110.2%
Race, ethnicity, and origin ACS 2023
- Neighborhood character
- Diverse neighborhood (Simpson 0.56)
- Race & ethnicity
- White 60% Hispanic / Latino 28% Two or more races 16% Black 7% Asian 2%
- Hispanic origin (detail)
- Mexican 24%
- Common ancestry
- Lithuanian 3% Serbian 2% Italian 1%
- Foreign-born
- 8% · Canada, South Korea
- Languages at home
- 83% English-only · Spanish 15% Arabic 1% Tagalog/Filipino 1%
Political lean MEDSL · Brazoria
- 2024 margin
- R (+19.7) · D 39.5% · R 59.2% · Other 1.3%
- 2008→2024 swing
- +9.9pp toward D · 2008: -29.6pp · 2024: -19.7pp
- All cycles
- 2024: R+19.7 2020: R+18.2 2016: R+24.6 2012: R+34.2 2008: R+29.6
Not yet ingested
- Civics
- —
Market trends
- HPI YoY
- ▼ -84.81%
- Current HPI
- 251.8234
- Rent YoY
- ▼ -1.11%
- Metro
- Houston-The Woodlands-Sugar Land, TX
- State GDP YoY
- ▲ 3.95%
- F500 in state
- 110
Industry mix (Fortune 500 HQ in TX)
| Industry | F500 HQs | Revenue |
|---|---|---|
| Energy | 16 | $1,198B |
|
||
| Technology | 5 | $198B |
|
||
| Engineering / Construction | 4 | $72B |
|
||
| Energy Services | 3 | $60B |
|
||
| Utilities | 3 | $41B |
|
||
| Healthcare | 2 | $330B |
|
||
Price history
-10.4% since first listed4 events — show timeline
- 2026-06-22 Price Changed $215,000 HARMLS
- 2026-05-11 Price Changed $225,000 HARMLS
- 2026-04-21 Listed $240,000 HARMLS
- 2002-10-17 Sold (Public Records) — Public Records
Property tax history
+5.6%/yrLatest (2025): $4,236 · -3.6% YoY. Source: county tax records.
Cash-flow waterfall
monthlySold comps — $/sqft
last 12 mo · ≤1 miLoading sold comps…