102 Golf Course Drive Dr · Armstrong, IA
Flood risk 1/10 · Minimal
- FEMA flood zone
- X (unshaded)
- Chance of flooding over 30 yrs
- 0.0%
- Est. flood insurance / yr
- $473 – $860
Fire risk 3/10 · Minor
- Est. fire insurance / yr
- $902 – $1,676
Heat risk 2/10 · Minimal
- Hot days now (above 100°F)
- 7 days/yr
- Hot days in 30 yrs
- 16 days/yr
Wind risk 2/10 · Minimal
- Chance of severe wind over 30 yrs
- —
Air-quality risk 2/10 · Minimal
- Unhealthy air days now
- 1 days/yr
- Unhealthy air days in 30 yrs
- 1 days/yr
Risk factors via First Street. Map © Google.
Why this score? — see what drove the D grade
The composite is a weighted blend of 9 inputs, each scored 0–100. Each bar is that input's sub-score; the figure is the points it added to the 100-point composite (weight × sub-score).
- Cash flow +8.5/30.0
- ARV discount +7.5/15.0
- Appreciation +7.3/10.0
- Schools +6.4/10.0
- Livability +3.6/5.0
- Rent growth +2.5/5.0
- Condition / age +2.5/5.0
- DSCR +2.3/10.0
- 1% rule +2.2/10.0
$149,900
🖨 Deal sheet 📄 Offer letter ✓ Due diligence
Listing remarks
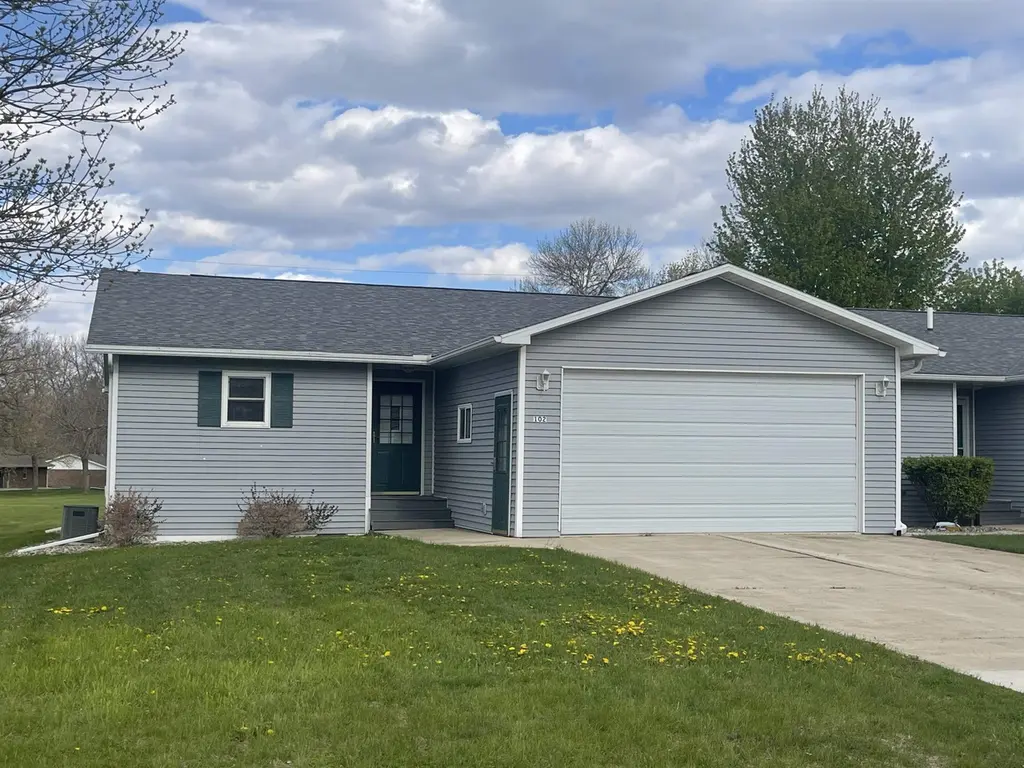
Enjoy small-town comfort with room to spread out in this 3-bedroom, 2 bath townhouse set right on the golf course in Armstrong by hole 2. With highly desired features including no exterior steps and convenient main floor laundry, this home is designed for comfort and accessibility. Inside, you will find generous storage throughout and an open layout that makes everyday life feel effortless. Relax on the deck with peaceful fairway views and enjoy a home that truly offers space, function, and ease.
Key facts
- Generous storage
- Main floor laundry
- Open layout
Tags
Property features AI
Exterior
- Parking: Attached concrete garage with automatic opener; 2 garage spaces
- Security: Smoke detector(s)
- Utilities: Public water; Public sewer
- Home design: Residential townhouse; One level / single-story
- Construction: Vinyl siding; Asphalt roof; Built with full basement
- Exterior features: Deck; Located on a golf course
Interior
- Kitchen: Dishwasher; Microwave; Refrigerator; Water purifier
- Bathrooms: Two 3/4 bathrooms
- Heating & cooling: Natural gas forced air heating; Central air conditioning
- Interior features: Walk-in closet(s); Window coverings; Partially finished full basement with sump pump
- Laundry & utility: Washer; Dryer; Main level laundry
Neighborhood map
What this means for you Summary
Snapshot
- This is a 4-bed/1.5-bath townhouse listed at $150k.
Deal economics
- At list price, monthly cash flow is $-131 ($-2k/yr) — negative.
- To cash-flow at today's rent, offer at most $127k (15.5% below list).
- To meet the 1% rule (rent ≥ 1% of price), the offer needs to be $108k (28.2% below list).
- Recommended offer: $108k (28.2% below list) — sets the bar for 1% rule.
Location & tenants
- Location reads 71/100 on livability (#352 in IA) — a middle-class / working-renter tenant base. Strengths: cost of living A+, housing A+, health & safety A+; Watch: employment D, amenities F, commute F.
- North Union Community School District (rural): math 68% / reading 83% proficiency, ranked #73 of 289 in IA (top 25%) — strong family-tenant draw, lease renewals of 3-5y typical.
- Market conditions: 6 active listings in the ZIP; 11 units permitted in Emmet County in 2024 (0 in 5+ unit buildings).
Forward outlook
- In year one you build about $8k of equity ($1k loan paydown + $7k appreciation (4.6% local appreciation)).
- Emmet County population projected at -23% by 2050 — secular population decline; favor cash flow + early exit over multi-decade hold.
- By year 5, paydown + projected appreciation supports a ~$35k cash-out refi (75% LTV) — recoverable capital for the next deal without selling this one.
Negotiation context
- It's been on market 32 days — a 3% lower offer ($145k) is reasonable based on typical stale-listing flexibility.
Questions for the listing agent
- What do current leases actually rent for vs. the listed asking? Can we see a recent rent roll and the last 12 months of T-12 income?
- It's been on market 32 days. Have you received any prior offers? Is the seller open to a 28% concession, seller financing, or rate buy-down credit?
- Is there a deadline driving the sale (1031 exchange, divorce, estate, relocation)? That informs how much negotiation room exists.
- Schools are B-rated — typically a magnet for longer-tenancy family renters. What's the average tenant stay here, and is there a school-zone premium baked into asking?
- The area grade is low — what's the realistic commute time and amenity access for the typical tenant pool here? Any planned neighborhood developments (good or bad) we should know about?
- What's the average days-on-market for RENTAL listings here right now (not sales)? A rising rental-DOM trend means longer vacancies and softer asking-rent achievability than the comps imply.
- What's the recent tenant-quality profile in this submarket — average credit score on applications, eviction rate, late-payment / NSF rate, and stable-employment percentage? A property-management company in the area should have these aggregated.
- How much new for-sale + rental construction is in the pipeline within 1–3 miles? Heavy new supply typically softens prices + rents 12–24 months out; constrained supply supports both.
Investment metrics
- 1% rule
- 0.72% ✗
- Cap rate
- 5.24%
- Cash-on-cash
- -3.76%
- DSCR
- 0.83
- GRM
- 11.6
CMA / ARV
No comps found within radius.
Projected returns pro-forma
4.64% appreciation · 3.0% rent growth · sell at horizon
- IRR
- 8.7%
- Equity multiple
- 1.55×
- Total profit
- $23,105
- Equity at exit
- $81,693
- IRR
- 10.6%
- Equity multiple
- 2.87×
- Total profit
- $78,584
- Equity at exit
- $138,371
Cash invested: $41,972 (down + closing). Projections, not guarantees.
Landlord ↔ Tenant lean methodology
- Overall (STATE)
- 83 Strongly Landlord-Friendly
- State Iowa
- 83 Strongly Landlord-Friendly · R+6
- County
- — inherits STATE
- City
- — inherits STATE
ZIP-level market 50514
- Home prices YoY
- 2.8%
- Active inventory
- 6
- Price-to-rent
- 11.6×
Monthly cashflow live
- Estimated rent
- $1,076 medium interval (Pro) →
- Mortgage (P&I)
- −$786
- Tax from tax record
- −$133 /mo · $1,594/yr
- Insurance
- −$62
- HOA
- −$0
- Vacancy / Maint / Mgmt
- −$226
- Net cashflow
- $-131
Break-even live
UW: 25.0% down · 7.5% · 30yr · 1.5% tax · 5.0% vac · 8.0% maint · 8.0% mgmt
Financing live
Cash to close
- Down payment
- $37,475
- Closing costs
- $4,497
- Reserves months
- —
- Total cash needed
- —
Loan-product check · same deal, 3 products live
Conventional
25% down · 7.5% · 30yr
- Down + closing
- —
- Monthly P&I
- —
- Monthly cashflow
- —
- DSCR
- —
- Eligible?
- —
Personal DTI + credit; lowest rate.
DSCR
20% down · 8.5% · 30yr
- Down + closing
- —
- Monthly P&I
- —
- Monthly cashflow
- —
- DSCR
- —
- Eligible?
- —
No personal income docs; deal must DSCR.
Hard money
10% down · 12.0% · 12mo
- Down + closing
- —
- Monthly P&I
- —
- Monthly cashflow
- —
- DSCR
- —
- Eligible?
- —
Short-term bridge; refi at stabilization.
Listing history 10 events
-
2026-06-09status $149,900 Pending 32 DOM
-
2026-06-08days on market $149,900 Active 32 DOM
-
2026-06-07days on market $149,900 Active 31 DOM
-
2026-06-07days on market $149,900 Active 30 DOM
-
2026-06-04days on market $149,900 Active 27 DOM
-
2026-06-02days on market $149,900 Active 26 DOM
-
2026-06-01days on market $149,900 Active 25 DOM
-
2026-05-31days on market $149,900 Active 24 DOM
-
2026-05-31days on market $149,900 Active 23 DOM
-
2026-05-07$149,900 Active 502-char remark
ⓘ Source: listings_history table (triggers on properties + properties_extension) + one-shot
backfill from property_details.listing_events for pre-trigger history.
Tax reassessment forecast IA · Partial reset (capped growth)
- Current annual tax
- $1,594 · $133/mo
- Projected year-2 tax
- $1,974 · $164/mo
- Expected delta
- +$380/yr (+$32/mo · 23.8%)
ⓘ Screening estimate from a state-policy table — verify with the county assessor before closing.
Climate risk First Street
- Flood 1/10 Low FEMA zone X (unshaded) · 0% chance over 30 yrs
- Wildfire 3/10 Moderate
- Heat 2/10 Low 7 d/yr ≥100°F today · 16 d/yr by 30 yrs out
- Wind 2/10 Low
- Air quality 2/10 Low 1 unhealthy d/yr today · 1 by 30 yrs out
Nearby sold comps map
Loading sold comps map…
Walkable amenities ~0.75 mi
Loading nearby amenities…
Taxation est. · year 1
- Rental income
- $12,911
- − Mortgage interest
- −$8,397
- − Property taxes
- −$1,594
- − Insurance
- −$750
- − Repairs & maintenance
- −$1,033
- − Management
- −$1,033
- − Depreciation
- −$4,361
- Taxable loss
- −$4,256
- Est. tax savings @ 24.0%
- +$1,021
- After-tax cash flow
- $-556/yr
For passive investors: Depreciation is non-cash, so a rental often shows a tax loss while cash-flowing — sheltering income. Rental losses are passive: they offset passive income freely, and up to $25,000/yr can offset ordinary (W-2) income if you actively participate and your MAGI is under $100k (phasing out to $0 by $150k); unused losses carry forward. On sale, claimed depreciation is recaptured at up to 25%, and gains may owe capital-gains tax (a 1031 exchange can defer both). Figures are a year-1 estimate at your 24.0% rate — not tax advice; consult a CPA.
Schools (NCES district)
- District
- North Union Community School District
- NCES district ID
- 1903850
- Math proficiency
- 68% ▲ 8.00%
- Reading proficiency
- 83% ▲ 8.00%
- Median HH income
- $49,521
- Composite
- 63.83/100
- National rank
- #592
- State rank
- #73 of 289 in IA
Livability — Armstrong
- Score
- 71/100
- State rank
- #352
- US rank
- #7186
Category grades
Schools grade is shown separately in the Schools card above.
Census & demographics
- Census place
- Armstrong, IA
- Population (ZIP)
- 1,190
Population outlook (Emmet County) Hauer SSP2
- Today (2025)
- 9,084 people
- By 2030
- 8,626 · -5.0%
- By 2040
- 7,751 · -14.7%
- By 2050
- 6,991 · -23.0%
- By 2075
- 5,854 · -35.6%
- By 2100
- 5,563 · -38.8%
Race, ethnicity, and origin ACS 2023
- Neighborhood character
- Predominantly White (98%)
- Race & ethnicity
- White 98% Two or more races 1%
- Common ancestry
- Portuguese 12% Slovak 2% Iranian 1%
- Foreign-born
- 1%
Political lean MEDSL · Emmet
- 2024 margin
- Solid R (+44.0) · D 27.5% · R 71.5% · Other 1.0%
- 2008→2024 swing
- -48.0pp toward R · 2008: 3.9pp · 2024: -44.0pp
- All cycles
- 2024: R+44.0 2020: R+36.0 2016: R+37.5 2012: R+8.9 2008: D+3.9
Not yet ingested
- Civics
- —
Market trends
- HPI YoY
- ▲ 4.64%
- Current HPI
- 170.7437
- Rent YoY
- —
- Metro
- —
- State GDP YoY
- ▲ 2.48%
- F500 in state
- 4
Industry mix (Fortune 500 HQ in IA)
| Industry | F500 HQs | Revenue |
|---|---|---|
| Financial Services | 1 | $16B |
|
||
| Retail / Convenience | 1 | $15B |
|
||
Price history
2 events — show timeline
- 2026-06-08 Pending — Iowa Great Lakes BOR
- 2026-05-07 Listed $149,900 Iowa Great Lakes BOR
Property tax history
+1.5%/yrLatest (2025): $1,594 · -6.5% YoY. Source: county tax records.
Cash-flow waterfall
monthlySold comps — $/sqft
last 12 mo · ≤1 miLoading sold comps…