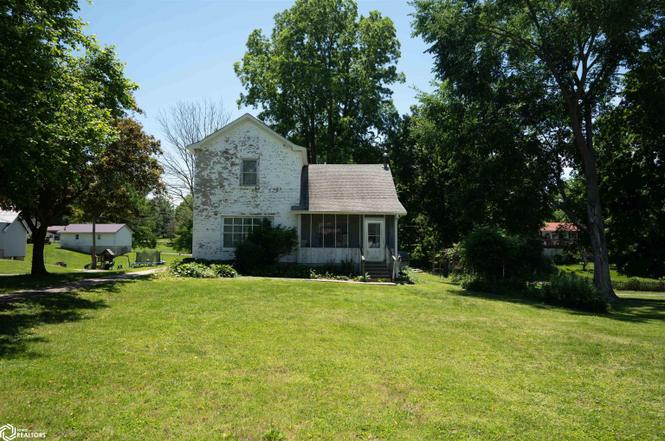
515 S 5th St · Warsaw, IL
Flood risk 1/10 · Minimal
- FEMA flood zone
- X (unshaded)
- Chance of flooding over 30 yrs
- 0.0%
- Est. flood insurance / yr
- $473 – $860
Fire risk 1/10 · Minimal
- Est. fire insurance / yr
- $804 – $1,492
Heat risk 3/10 · Minor
- Hot days now (above 106°F)
- 7 days/yr
- Hot days in 30 yrs
- 16 days/yr
Wind risk 2/10 · Minimal
- Chance of severe wind over 30 yrs
- 0.0%
Air-quality risk 2/10 · Minimal
- Unhealthy air days now
- 0 days/yr
- Unhealthy air days in 30 yrs
- 1 days/yr
Risk factors via First Street. Map © Google.
Why this score? — see what drove the B+ grade
The composite is a weighted blend of 9 inputs, each scored 0–100. Each bar is that input's sub-score; the figure is the points it added to the 100-point composite (weight × sub-score).
- Cash flow +30.0/30.0
- 1% rule +10.0/10.0
- DSCR +10.0/10.0
- Appreciation +9.0/10.0
- ARV discount +7.5/15.0
- Livability +3.4/5.0
- Schools +2.9/10.0
- Rent growth +2.5/5.0
- Condition / age +2.5/5.0
$35,000
🖨 Deal sheet 📄 Offer letter ✓ Due diligence
Listing remarks
FIXER UPPER!!!!!!!! Corner Lot, 3 bedrooms, Kitchen, Living Room, Full Bath! " SELLING AS IS!! "
Key facts
- Kitchen
- Living room
- Full bath
Tags
Property features AI
Exterior
- Parking: On-street parking
- Utilities: Public water; Public sewer
- Home design: Two-story single family residence; Residential property
- Construction: Brick construction
- Exterior features: Lot approximately 60.75' wide by 144' deep
Interior
- Bathrooms: 1 full bathroom
- Heating & cooling: Central air conditioning; Forced air heating
- Interior features: Basement
Neighborhood map
What this means for you Summary
Snapshot
- This is a 3-bed/1.0-bath single-family listed at $35k.
Deal economics
- At list price, monthly cash flow is $508 ($6k/yr) — positive.
- The deal already cash-flows at list — no discount required.
- Meets the 1% rule at list price ($906 rent vs $35k).
Location & tenants
- Location reads 68/100 on livability (#459 in IL) — a middle-class / working-renter tenant base. Strengths: crime A+, cost of living A+, housing A+; Watch: health & safety C-, schools D, employment D.
- Warsaw CUSD 316 (rural): math 25% / reading 35% proficiency, ranked #489 of 919 in IL (top 53%) — families likely to look elsewhere, expect single-tenant / working-renter base with shorter leases.
- Market conditions: 20 active listings in the ZIP.
Forward outlook
- In year one you build about $3k of equity ($242 loan paydown + $3k appreciation (8.0% local appreciation)).
- Hancock County population projected at -30% by 2050 — secular population decline; favor cash flow + early exit over multi-decade hold.
- At projected returns (8.0% appreciation + 3.0% rent growth), your $10k cash investment doubles in ~2 years — after that, you're playing with house money.
- By year 10, paydown + projected appreciation supports a ~$34k cash-out refi (75% LTV) — recoverable capital for the next deal without selling this one.
Negotiation context
- Only 1 days on market — expect competitive offers; lowballing is unlikely to land.
Risks & watch-outs
- Watch-outs: built in 1896 — expect roof / HVAC / electrical / plumbing capex.
Questions for the listing agent
- Built in 1896 — when were the roof, HVAC, electrical panel, plumbing, and water heater last replaced?
- Is there a deadline driving the sale (1031 exchange, divorce, estate, relocation)? That informs how much negotiation room exists.
- Schools are D-rated, which usually means shorter tenancies and higher turnover. Who's the typical renter profile here, and what's been the actual vacancy rate?
- What's the average days-on-market for RENTAL listings here right now (not sales)? A rising rental-DOM trend means longer vacancies and softer asking-rent achievability than the comps imply.
- What's the recent tenant-quality profile in this submarket — average credit score on applications, eviction rate, late-payment / NSF rate, and stable-employment percentage? A property-management company in the area should have these aggregated.
- How much new for-sale + rental construction is in the pipeline within 1–3 miles? Heavy new supply typically softens prices + rents 12–24 months out; constrained supply supports both.
Investment metrics
- 1% rule
- 2.59% ✓
- Cap rate
- 23.71%
- Cash-on-cash
- 62.19%
- DSCR
- 3.77
- GRM
- 3.2
CMA / ARV
- ARV (on-the-fly)
- $91,600
- Comps found
- 5
Show comp detail 5 sales within ~0.75 mi
| Address | Dist | Beds/Ba | Sqft | Sold | Price | $/sf | Match |
|---|---|---|---|---|---|---|---|
| 930 Crawford St | 0.34mi | 2/1.0 (-1) | 909 (-1%) | 7mo | $75,000 | $83 | 72 |
| 725 Bunker Dr | 0.20mi | 3/1.0 | 1,008 (+10%) | 5mo | $105,000 | $104 | 70 |
| 415 Illinois St | 0.39mi | 3/1.0 | 1,008 (+10%) | 11mo | $101,000 | $100 | 56 |
| 330 Cedar St | 0.16mi | 2/2.0 (-1) | 1,044 (+14%) | 6mo | $36,000 | $34 | 55 |
| 730 Liberty Dr | 0.25mi | 4/2.0 (+1) | 1,008 (+10%) | 22mo | $137,000 | $136 | 45 |
Match score weights: distance 35% · size 25% · config 20% · recency 20%. Top-matched comps best support the ARV.
Projected returns pro-forma
7.99% appreciation · 3.0% rent growth · sell at horizon
- IRR
- 72.0%
- Equity multiple
- 5.77×
- Total profit
- $46,737
- Equity at exit
- $26,569
- IRR
- 67.5%
- Equity multiple
- 12.38×
- Total profit
- $111,554
- Equity at exit
- $52,720
Cash invested: $9,800 (down + closing). Projections, not guarantees.
Landlord ↔ Tenant lean methodology
- Overall (STATE)
- 43 Moderately Tenant-Leaning
- State Illinois
- 43 Moderately Tenant-Leaning · D+7
- County
- — inherits STATE
- City
- — inherits STATE
ZIP-level market 62379
- Home prices YoY
- 5.6%
- Active inventory
- 20
- Price-to-rent
- 3.2×
Monthly cashflow live
- Estimated rent
- $906 medium interval (Pro) →
- Mortgage (P&I)
- −$184
- Tax from tax record
- −$10 /mo · $119/yr
- Insurance
- −$15
- HOA
- −$0
- Vacancy / Maint / Mgmt
- −$190
- Net cashflow
- $508
Break-even live
UW: 25.0% down · 7.5% · 30yr · 1.5% tax · 5.0% vac · 8.0% maint · 8.0% mgmt
Financing live
Cash to close
- Down payment
- $8,750
- Closing costs
- $1,050
- Reserves months
- —
- Total cash needed
- —
Loan-product check · same deal, 3 products live
Conventional
25% down · 7.5% · 30yr
- Down + closing
- —
- Monthly P&I
- —
- Monthly cashflow
- —
- DSCR
- —
- Eligible?
- —
Personal DTI + credit; lowest rate.
DSCR
20% down · 8.5% · 30yr
- Down + closing
- —
- Monthly P&I
- —
- Monthly cashflow
- —
- DSCR
- —
- Eligible?
- —
No personal income docs; deal must DSCR.
Hard money
10% down · 12.0% · 12mo
- Down + closing
- —
- Monthly P&I
- —
- Monthly cashflow
- —
- DSCR
- —
- Eligible?
- —
Short-term bridge; refi at stabilization.
Listing history 3 events
-
2026-06-17status $35,000 Pending 1 DOM
-
2026-06-16remarks 96-char remark
-
2026-06-16$35,000 Active 1 DOM
ⓘ Source: listings_history table (triggers on properties + properties_extension) + one-shot
backfill from property_details.listing_events for pre-trigger history.
Tax reassessment forecast IL · Partial reset (capped growth)
- Current annual tax
- $119 · $10/mo
- Projected year-2 tax
- $457 · $38/mo
- Expected delta
- +$338/yr (+$28/mo · 283.0%)
ⓘ Screening estimate from a state-policy table — verify with the county assessor before closing.
Climate risk First Street
- Flood 1/10 Low FEMA zone X (unshaded) · 0% chance over 30 yrs
- Wildfire 1/10 Low
- Heat 3/10 Moderate 7 d/yr ≥106°F today · 16 d/yr by 30 yrs out
- Wind 2/10 Low 0% chance of damaging wind over 30 yrs
- Air quality 2/10 Low 0 unhealthy d/yr today · 1 by 30 yrs out
Nearby sold comps map
Loading sold comps map…
Walkable amenities ~0.75 mi
Loading nearby amenities…
Taxation est. · year 1
- Rental income
- $10,875
- − Mortgage interest
- −$1,961
- − Property taxes
- −$119
- − Insurance
- −$175
- − Repairs & maintenance
- −$870
- − Management
- −$870
- − Depreciation
- −$1,018
- Taxable income
- $5,862
- Est. tax owed @ 24.0%
- −$1,407
- After-tax cash flow
- $4,687/yr
For passive investors: Depreciation is non-cash, so a rental often shows a tax loss while cash-flowing — sheltering income. Rental losses are passive: they offset passive income freely, and up to $25,000/yr can offset ordinary (W-2) income if you actively participate and your MAGI is under $100k (phasing out to $0 by $150k); unused losses carry forward. On sale, claimed depreciation is recaptured at up to 25%, and gains may owe capital-gains tax (a 1031 exchange can defer both). Figures are a year-1 estimate at your 24.0% rate — not tax advice; consult a CPA.
Schools (NCES district)
- District
- Warsaw CUSD 316
- NCES district ID
- 1740890
- Math proficiency
- 25% ▲ 5.00%
- Reading proficiency
- 35% ▬ 0.00%
- Median HH income
- $48,724
- Composite
- 28.9/100
- National rank
- #11950
- State rank
- #489 of 919 in IL
Livability — Warsaw
- Score
- 68/100
- State rank
- #459
- US rank
- #9523
Category grades
Schools grade is shown separately in the Schools card above.
Census & demographics
- Census place
- Warsaw, IL
- Population (ZIP)
- 1,828
Population outlook (Hancock County) Hauer SSP2
- Today (2025)
- 17,042 people
- By 2030
- 16,056 · -5.8%
- By 2040
- 13,912 · -18.4%
- By 2050
- 11,879 · -30.3%
- By 2075
- 8,302 · -51.3%
- By 2100
- 5,846 · -65.7%
Race, ethnicity, and origin ACS 2023
- Neighborhood character
- Predominantly White (97%)
- Race & ethnicity
- White 97% Two or more races 2%
- Common ancestry
- Slovak 5% Lithuanian 2% Iranian 1%
- Foreign-born
- 1%
- Languages at home
- 98% English-only · Other Indo-European 2%
Political lean MEDSL · Hancock
- 2024 margin
- Solid R (+50.0) · D 24.1% · R 74.1% · Other 1.8%
- 2008→2024 swing
- -39.2pp toward R · 2008: -10.8pp · 2024: -50.0pp
- All cycles
- 2024: R+50.0 2020: R+48.9 2016: R+50.8 2012: R+19.0 2008: R+10.8
Not yet ingested
- Civics
- —
Market trends
- HPI YoY
- ▲ 7.99%
- Current HPI
- 150.9375
- Rent YoY
- —
- Metro
- —
- State GDP YoY
- ▲ 1.59%
- F500 in state
- 60
Industry mix (Fortune 500 HQ in IL)
| Industry | F500 HQs | Revenue |
|---|---|---|
| Insurance | 4 | $201B |
|
||
| Consumer Goods | 4 | $87B |
|
||
| Industrial Machinery | 3 | $64B |
|
||
| Healthcare | 2 | $55B |
|
||
| Retail / Pharmacy | 1 | $148B |
|
||
| Agriculture / Food | 1 | $86B |
|
||
Price history
1 event — show timeline
- 2026-06-14 Listed $35,000 IAR
Property tax history
-29.7%/yrLatest (2019): $119 · -81.3% YoY. Source: county tax records.
Cash-flow waterfall
monthlySold comps — $/sqft
last 12 mo · ≤1 miLoading sold comps…