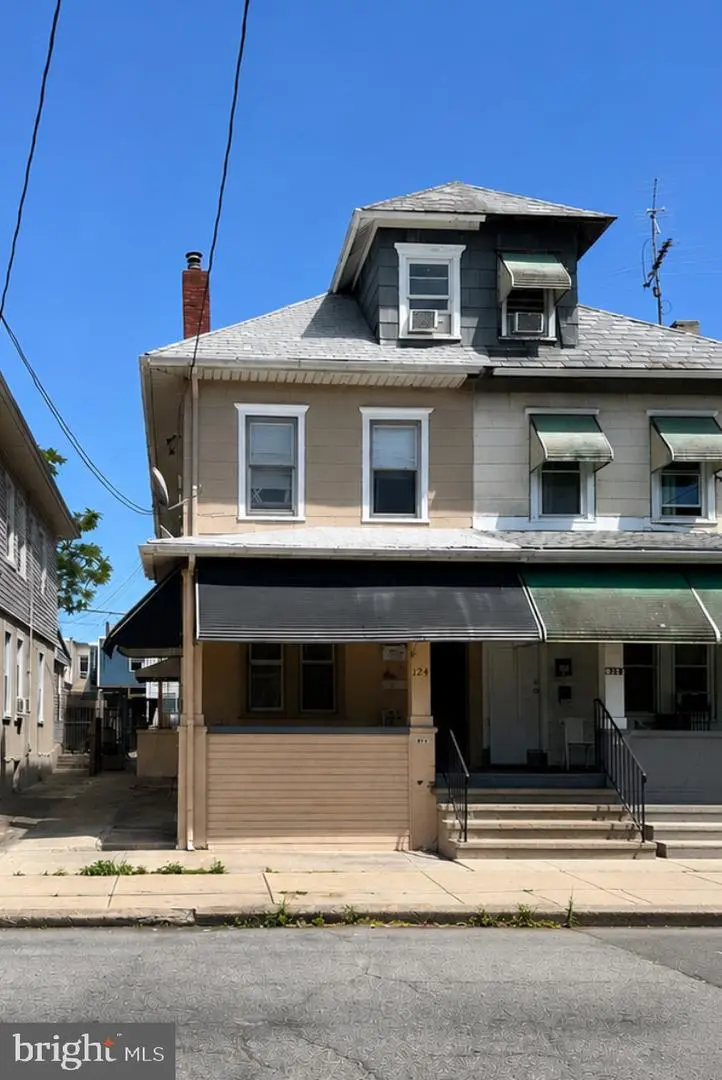
124 Nassau St · Trenton, NJ
Flood risk 1/10 · Minimal
- FEMA flood zone
- X (unshaded)
- Chance of flooding over 30 yrs
- 0.0%
- Est. flood insurance / yr
- $507 – $1,088
Fire risk 1/10 · Minimal
- Est. fire insurance / yr
- $526 – $976
Heat risk 6/10 · Moderate
- Hot days now (above 101°F)
- 7 days/yr
- Hot days in 30 yrs
- 15 days/yr
Wind risk 6/10 · Moderate
- Chance of severe wind over 30 yrs
- 27.0%
Air-quality risk 5/10 · Moderate
- Unhealthy air days now
- 6 days/yr
- Unhealthy air days in 30 yrs
- 8 days/yr
Risk factors via First Street. Map © Google.
Why this score? — see what drove the D+ grade
The composite is a weighted blend of 9 inputs, each scored 0–100. Each bar is that input's sub-score; the figure is the points it added to the 100-point composite (weight × sub-score).
- Cash flow +16.1/30.0
- ARV discount +11.8/15.0
- DSCR +5.0/10.0
- 1% rule +4.4/10.0
- Livability +3.8/5.0
- Rent growth +3.3/5.0
- Condition / age +2.5/5.0
- Schools +0.7/10.0
- Appreciation +0.0/10.0
$274,999
🖨 Deal sheet (PDF) 📄 Offer letter ✓ Due diligence
Listing remarks MLS
Beautifully maintained and fully rented 2 Family unit. Great for the savvy investor or homeowner looking to live mortgage free. Just live in one unit and let other pay your mortgage!! Centrally located and in close proximity to Capital Health Hospital, major hi-ways, train lines and airport. This home is a steal at this price. Rents are below Market Rate due to Long Term/Excellent Tenant. Bring your fussiest buyers this one won't last!! Unit #1 2 Bedrooms - $800.00 Unit #2 3 Bedrooms - $1100.00
Key facts
- 2,000 sq ft lot
- Built 1920
- Listed 17 days
Property features AI
Finance
- Other: Above-grade finished area per assessor: 1,590; Total units: 2; Vacancy: 1 unit
- Financial info: Existing lease arrangements include month-to-month tenancy; Two total units (1 occupied, 1 vacant); One unit leased and one unit on month-to-month; One 2-bedroom unit and one 3-bedroom unit
Exterior
- Parking: On-street parking
- Utilities: Electric available; Natural gas available; Cable TV available; Phone available; Water available; Sewer available
- Home design: Semi-detached property; 3 total levels; Fee simple ownership; Very good condition
- Construction: Aluminum siding; Brick/mortar foundation; Shingle roof; Built per assessor records (year built source: Assessor)
- Exterior features: Rear yard; Lot approximately 20 x 100; Public water and public sewer available
Interior
- Kitchen: Refrigerator; Stove
- Bedrooms: One 2-bedroom unit; One 3-bedroom unit
- Flooring: Wood flooring; Tile/brick flooring; Vinyl flooring
- Heating & cooling: Radiator heating; Natural gas heating and hot water
- Interior features: Exterior lighting; Sidewalks; Street lights; Unfinished basement
Neighborhood map
What this means for you Summary
Snapshot
- This is a 4-bed/?-bath single-family listed at $275k.
Deal economics
- At list price, monthly cash flow is $140 ($2k/yr) — positive.
- The deal already cash-flows at list — no discount required.
- To meet the 1% rule (rent ≥ 1% of price), the offer needs to be $259k (5.7% below list).
- Recommended offer: $259k (5.7% below list) — sets the bar for 1% rule.
Location & tenants
- Location reads 76/100 on livability (#133 in NJ, #3,533 nationally) — a middle-class / working-renter tenant base. Strengths: amenities A+, commute A+, health & safety A+; Watch: crime F, employment F.
- Trenton Public School District (urban): math 2% / reading 16% proficiency, ranked #471 of 472 in NJ (top 100%) — low school quality limits family demand, transient renter base, plan for 1-2y turnover; 80% free/reduced lunch — lower-income household profile, screen leases tightly.
- Zoned schools: Dr. Martin Luther King Jr. Elementary School (math 3% / reading 6%); Luis Munoz-Rivera Ms (math 2% / reading 20%); Trenton Central High School - Main Campus (math 2% / reading 10%, grade F, #396 of 399 statewide, top 99%, 2,255 students, 56% FRL) — zoned schools average 56% FRL vs 80% district-wide (25 pts lower); this property's tenant base skews higher-income than the district average.
- Market conditions: Rents rising (+3.3%/yr); 83 active listings in the ZIP; 25 comparable units currently listed for rent nearby; rentals at typical pace (median 16d on market — plan ~3-4 weeks tenant-placement turnaround); 2,256 units permitted in Mercer County in 2024 (1,303 in 5+ unit buildings).
- At $2,593/mo this rent would consume 47% of the median local household income ($67k/yr) (locally 1185% of renters already pay >50% of income on rent) — very limited rent-growth headroom before tenants either downsize or default.
Forward outlook
- Local home prices are declining (-3.0%/yr); year-one equity from $2k of loan paydown is wiped out by about $8k of value loss. Plan a longer hold.
- Mercer County population projected at +4% by 2050 — modest demand growth; plan on rents tracking national, not racing it.
Negotiation context
- It's been on market 17 days — a 2% lower offer ($271k) is reasonable based on typical stale-listing flexibility.
- 4 sale attempts since 21y ago with the ask held roughly flat each time — persistent listings suggest the price (not the market) is what's stuck; bring a comps-based counter.
- Current owner paid $226k; 22% above their basis — modest negotiation headroom, anchor on the comps not their cost.
Risks & watch-outs
- Watch-outs: built in 1920 — expect roof / HVAC / electrical / plumbing capex.
- Climate carrying-cost: major wind risk, 27% chance of damaging wind over 30y; extreme-heat days projected 7→15/yr by 2055 (HVAC capex compounding) — expect insurance premiums to compound above CPI over the hold.
Questions for the listing agent
- Built in 1920 — when were the roof, HVAC, electrical panel, plumbing, and water heater last replaced?
- Is there a deadline driving the sale (1031 exchange, divorce, estate, relocation)? That informs how much negotiation room exists.
- Schools are F-rated, which usually means shorter tenancies and higher turnover. Who's the typical renter profile here, and what's been the actual vacancy rate?
- Crime grade is F in this area — have there been break-ins, vandalism, or insurance claims at this property in the last 3 years? What carrier currently insures it and at what premium?
- The area grade is low — what's the realistic commute time and amenity access for the typical tenant pool here? Any planned neighborhood developments (good or bad) we should know about?
- What's the average days-on-market for RENTAL listings here right now (not sales)? A rising rental-DOM trend means longer vacancies and softer asking-rent achievability than the comps imply.
- What's the recent tenant-quality profile in this submarket — average credit score on applications, eviction rate, late-payment / NSF rate, and stable-employment percentage? A property-management company in the area should have these aggregated.
- How much new for-sale + rental construction is in the pipeline within 1–3 miles? Heavy new supply typically softens prices + rents 12–24 months out; constrained supply supports both.
Investment metrics
- 1% rule
- 0.94% ✗
- Cap rate
- 6.90%
- Cash-on-cash
- 2.17%
- DSCR
- 1.10
- GRM
- 8.8
CMA / ARV
- ARV (on-the-fly)
- $303,690
- Comps found
- 8
Show comp detail 8 sales within ~0.75 mi
| Address | Dist | Beds/Ba | Sqft | Sold | Price | $/sf | Match |
|---|---|---|---|---|---|---|---|
| 625 Indiana Ave | 0.24mi | 4/1.5 | 1,696 (+7%) | 5mo | $320,000 | $189 | 68 |
| 42 E Paul Ave | 0.14mi | 4/1.5 | 1,443 (-9%) | 11mo | $275,000 | $191 | 63 |
| 971 Pine St | 0.54mi | 3/1.0 (-1) | 1,509 (-5%) | 16mo | $285,000 | $189 | 44 |
| 132 Robbins Ave | 0.69mi | 4/2.0 | 1,542 (-3%) | 16mo | $370,000 | $240 | 42 |
| 967 Lanning Ave | 0.69mi | 4/2.0 | 1,734 (+9%) | 9mo | $484,000 | $279 | 37 |
| 118 Hazel | 0.73mi | 4/1.0 | 1,399 (-12%) | 8mo | $340,000 | $243 | 35 |
| 216 Brunswick Ave | 0.67mi | 5/3.0 (+1) | 1,704 (+7%) | 6mo | $130,000 | $76 | 35 |
| 130 Old Rose St | 0.65mi | 3/1.0 (-1) | 1,740 (+9%) | 24mo | $95,000 | $55 | 25 |
Match score weights: distance 35% · size 25% · config 20% · recency 20%. Top-matched comps best support the ARV.
Projected returns pro-forma
-3.0% appreciation · 3.31% rent growth · sell at horizon
- IRR
- -12.5%
- Equity multiple
- 0.55×
- Total profit
- $-34,819
- Equity at exit
- $41,003
- IRR
- -2.9%
- Equity multiple
- 0.80×
- Total profit
- $-15,347
- Equity at exit
- $23,777
Cash invested: $77,000 (down + closing). Projections, not guarantees.
Landlord ↔ Tenant lean methodology
- Overall (STATE)
- 21 Tenant-Leaning
- State New Jersey
- 21 Tenant-Leaning · D+6
- County
- — inherits STATE
- City
- — inherits STATE
ZIP-level market 08638
- Rents YoY
- 3.3%
- Active inventory
- 83
- Price-to-rent
- 8.8×
Monthly cashflow live
- Estimated rent
- $2,593 high interval (Pro) →
- Mortgage (P&I)
- −$1,442
- Tax from tax record
- −$352 /mo · $4,223/yr
- Insurance
- −$115
- HOA
- −$0
- Vacancy / Maint / Mgmt
- −$544
- Net cashflow
- $140
Break-even live
Sensitivity live
| Price | -10% $295 | -5% $217 | +0% $140 | +5% $62 | +10% $-16 |
|---|---|---|---|---|---|
| Rent | -10% $-65 | -5% $37 | +0% $140 | +5% $242 | +10% $344 |
| Rate | -1.0pp $278 | -0.5pp $209 | base $140 | +0.5pp $68 | +1.0pp $-4 |
UW: 25.0% down · 7.5% · 30yr · 1.5% tax · 5.0% vac · 8.0% maint · 8.0% mgmt
Financing live
Cash to close
- Down payment
- $68,750
- Closing costs
- $8,250
- Reserves months
- —
- Total cash needed
- —
Loan-product check · same deal, 3 products live
Conventional
25% down · 7.5% · 30yr
- Down + closing
- —
- Monthly P&I
- —
- Monthly cashflow
- —
- DSCR
- —
- Eligible?
- —
Personal DTI + credit; lowest rate.
DSCR
20% down · 8.5% · 30yr
- Down + closing
- —
- Monthly P&I
- —
- Monthly cashflow
- —
- DSCR
- —
- Eligible?
- —
No personal income docs; deal must DSCR.
Hard money
10% down · 12.0% · 12mo
- Down + closing
- —
- Monthly P&I
- —
- Monthly cashflow
- —
- DSCR
- —
- Eligible?
- —
Short-term bridge; refi at stabilization.
Rent comps 25 comps
| Address | Beds | Baths | Sqft | Rent | $/sqft | DOM | Units | Dist |
|---|---|---|---|---|---|---|---|---|
| 1314 Princeton Ave Trenton, NJ | 4.0 | 1.0 | 1092 | $2,400 | $2.20 | 15d | 1 | 0.14mi |
| 331 Ellis Ave Trenton, NJ | 3.0 | 1.0 | 1190 | $2,275 | $1.91 | 23d | 1 | 0.35mi |
| 130 W Ingham Ave Trenton, NJ | 4.0 | 1.0 | 1126 | $2,000 | $1.78 | 15d | 1 | 0.57mi |
| 24 New Trent St Trenton, NJ | 3.0 | 2.0 | 1336 | $2,350 | $1.76 | 15d | 1 | 0.61mi |
| 1040 Indiana Ave Trenton, NJ | 3.0 | 1.0 | 1232 | $2,950 | $2.39 | 15d | 1 | 0.67mi |
| 134 Old Rose St Trenton, NJ | 4.0 | 2.0 | 1212 | $2,300 | $1.90 | 23d | 1 | 0.68mi |
| 1100 Prospect St Unit 1 Ewing Township, NJ | 3.0 | 1.0 | 1100 | $2,000 | $1.82 | 23d | 1 | 0.82mi |
| 234 Walnut Ave Trenton, NJ | 4.0 | 1.0 | 1480 | $2,200 | $1.49 | 23d | 1 | 1.03mi |
| 21 Bellevue Ave Trenton, NJ | 3.0 | 2.0 | 1740 | $2,400 | $1.38 | 45d | 1 | 1.07mi |
| 73 Bellevue Ave Trenton, NJ | 4.0 | 2.0 | 1950 | $2,400 | $1.23 | 15d | 1 | 1.12mi |
| 319 Rutherford Ave Trenton, NJ | 4.0 | 2.0 | 1100 | $2,200 | $2.00 | 23d | 1 | 1.17mi |
| 219 Woodlawn Ave Trenton, NJ | 3.0 | 1.0 | 1456 | $2,355 | $1.62 | 15d | 1 | 1.20mi |
| 311 Calhoun St Trenton, NJ | 4.0 | 1.0 | 1516 | $2,400 | $1.58 | 45d | 1 | 1.22mi |
| 239 Ardmore Ave Trenton, NJ | 4.0 | 2.0 | 1665 | $2,750 | $1.65 | 23d | 1 | 1.27mi |
| 21 Adella Ave Trenton, NJ | 3.0 | 1.0 | 1280 | $2,000 | $1.56 | 15d | 1 | 1.34mi |
| 25 Adella Ave Trenton, NJ | 3.0 | 1.0 | 1280 | $2,050 | $1.60 | 15d | 1 | 1.34mi |
| 510 N Hermitage Ave Trenton, NJ | 5.0 | 1.5 | 1316 | $2,300 | $1.75 | 0d | 1 | 1.38mi |
| 311 Spring St Trenton, NJ | 3.0 | 1.0 | 1200 | $2,200 | $1.83 | 15d | 1 | 1.38mi |
| 186 Passaic St Trenton, NJ | 3.0 | 2.0 | 1064 | $2,400 | $2.26 | 6d | 1 | 1.38mi |
| 510 W Hanover St Trenton, NJ | 5.0 | 1.0 | 1200 | $2,200 | $1.83 | 15d | 1 | 1.43mi |
| 340 Connecticut Ave Unit 2 Hamilton Township, NJ | 3.0 | 1.0 | 1400 | $2,850 | $2.04 | 15d | 1 | 1.44mi |
| 92 Pennwood Dr Ewing, NJ | 4.0 | 3.0 | 1702 | $3,850 | $2.26 | 15d | 1 | 1.44mi |
| 600 Artisan St Trenton, NJ | 3.0 | 2.0 | 1392 | $2,650 | $1.90 | 14d | 3 | 1.47mi |
| 600 Artisan St Unit 126 Trenton, NJ | 3.0 | 2.0 | 1392 | $2,650 | $1.90 | 22d | 1 | 1.47mi |
| 635 Chambers St Trenton, NJ | 4.0 | 2.0 | 1312 | $2,500 | $1.91 | 15d | 1 | 1.49mi |
Listing history 11 events
-
2026-06-22days on market $274,999 Active 17 DOM
-
2026-06-18days on market $274,999 Active 14 DOM
-
2026-06-17days on market $274,999 Active 13 DOM
-
2026-06-16days on market $274,999 Active 12 DOM
-
2026-06-15days on market $274,999 Active 11 DOM
-
2026-06-14days on market $274,999 Active 9 DOM
-
2026-06-10days on market $274,999 Active 6 DOM
-
2026-06-09days on market $274,999 Active 5 DOM
-
2026-06-08days on market $274,999 Active 4 DOM
-
2026-06-07remarks 693-char remark
-
2026-06-07$274,999 Active 3 DOM
ⓘ Source: listings_history table (triggers on properties + properties_extension) + one-shot
backfill from property_details.listing_events for pre-trigger history.
Tax reassessment forecast NJ · Partial reset (capped growth)
- Current annual tax
- $4,223 · $352/mo
- Projected year-2 tax
- $5,535 · $461/mo
- Expected delta
- +$1,312/yr (+$109/mo · 31.1%)
ⓘ Screening estimate from a state-policy table — verify with the county assessor before closing.
Climate risk First Street
- Flood 1/10 Low FEMA zone X (unshaded) · 0% chance over 30 yrs
- Wildfire 1/10 Low
- Heat 6/10 Major 7 d/yr ≥101°F today · 15 d/yr by 30 yrs out
- Wind 6/10 Major 27% chance of damaging wind over 30 yrs
- Air quality 5/10 Major 6 unhealthy d/yr today · 8 by 30 yrs out
Nearby sold comps map
Loading sold comps map…
Walkable amenities ~0.75 mi
Loading nearby amenities…
Taxation est. · year 1
- Rental income
- $31,112
- − Mortgage interest
- −$15,404
- − Property taxes
- −$4,223
- − Insurance
- −$1,375
- − Repairs & maintenance
- −$2,489
- − Management
- −$2,489
- − Depreciation
- −$8,000
- Taxable loss
- −$2,869
- Est. tax savings @ 24.0%
- +$688
- After-tax cash flow
- $2,363/yr
For passive investors: Depreciation is non-cash, so a rental often shows a tax loss while cash-flowing — sheltering income. Rental losses are passive: they offset passive income freely, and up to $25,000/yr can offset ordinary (W-2) income if you actively participate and your MAGI is under $100k (phasing out to $0 by $150k); unused losses carry forward. On sale, claimed depreciation is recaptured at up to 25%, and gains may owe capital-gains tax (a 1031 exchange can defer both). Figures are a year-1 estimate at your 24.0% rate — not tax advice; consult a CPA.
Schools (NCES district)
- District
- Trenton Public School District
- NCES district ID
- 3416290
- Math proficiency
- 2% ▼ -8.00%
- Reading proficiency
- 16% ▼ -4.00%
- Median HH income
- $35,078
- Composite
- 7.31/100
- National rank
- #9956
- State rank
- #471 of 472 in NJ
Livability — Trenton
- Score
- 76/100
- State rank
- #133
- US rank
- #3533
Category grades
Schools grade is shown separately in the Schools card above.
Census & demographics
- Census place
- Trenton, NJ
- County
- Mercer County · 327,655 people
- City population
- 177,819
- Metro
- Trenton-Princeton, NJ
- Population (ZIP)
- 22,816
- Household income
- $66,875
- Rent vs Own
- Severe rent burden
- 1185.0
Population outlook (Mercer County) Hauer SSP2
- Today (2025)
- 381,395 people
- By 2030
- 384,640 · +0.9%
- By 2040
- 391,431 · +2.6%
- By 2050
- 397,845 · +4.3%
- By 2075
- 417,281 · +9.4%
- By 2100
- 420,327 · +10.2%
Race, ethnicity, and origin ACS 2023
- Neighborhood character
- Diverse neighborhood (Simpson 0.68)
- Race & ethnicity
- Black 43% White 31% Hispanic / Latino 21% Two or more races 8% Asian 2%
- Hispanic origin (detail)
- Mexican 2% Puerto Rican 6% Dominican 3%
- Common ancestry
- Romanian 4% Hispanic 2% Iranian 1%
- Foreign-born
- 24% · Canada, Guatemala, China
- Languages at home
- 76% English-only · Spanish 17% Russian/Polish/Slavic 2% Other Indo-European 2%
Political lean MEDSL · Mercer
- 2024 margin
- Solid D (+33.9) · D 65.9% · R 32.0% · Other 2.1%
- 2008→2024 swing
- -2.2pp toward R · 2008: 36.1pp · 2024: 33.9pp
- All cycles
- 2024: D+33.9 2020: D+40.0 2016: D+36.2 2012: D+36.8 2008: D+36.1
Not yet ingested
- Civics
- —
Market trends
- HPI YoY
- ▼ -286.00%
- Current HPI
- 334.5143
- Rent YoY
- ▲ 3.31%
- Metro
- Trenton-Princeton, NJ
- State GDP YoY
- ▲ 2.05%
- F500 in state
- 34
Industry mix (Fortune 500 HQ in NJ)
| Industry | F500 HQs | Revenue |
|---|---|---|
| Consumer Goods | 3 | $31B |
|
||
| Pharmaceuticals | 2 | $153B |
|
||
| Technology | 2 | $21B |
|
||
| Insurance | 2 | $20B |
|
||
| Healthcare | 2 | $19B |
|
||
| Financial Services | 1 | $70B |
|
||
Price history
+252.6% since first listed12 events — show timeline
- 2026-06-05 Listed $274,999 BRIGHT MLS
- 2026-06-03 Coming Soon $274,999 BRIGHT MLS
- 2022-10-20 Sold (Public Records) $226,000 Public Records
- 2022-09-30 Sold (MLS) $226,000 BRIGHT MLS
- 2022-09-20 Pending — BRIGHT MLS
- 2022-06-22 Listed $225,777 BRIGHT MLS
- 2006-04-03 Listing Removed — BRIGHT MLS
- 2005-10-04 Listing Removed — BRIGHT MLS
- 2005-10-03 Listed $149,900 BRIGHT MLS
- 2005-03-14 Listed $149,900 BRIGHT MLS
- 1998-12-24 Sold (Public Records) $43,500 Public Records
- 1990-04-03 Sold (Public Records) $78,000 Public Records
Property tax history
+1.4%/yrLatest (2025): $4,223 · +1.5% YoY. Source: county tax records.
Cash-flow waterfall
monthlySold comps — $/sqft
last 12 mo · ≤1 miLoading sold comps…