38752 Hwy 36 · Mineral, CA
Flood risk 1/10 · Minimal
- FEMA flood zone
- D
- Chance of flooding over 30 yrs
- 0.0%
- Est. flood insurance / yr
- $544 – $1,084
Fire risk 6/10 · Moderate
- Est. fire insurance / yr
- $659 – $1,223
Heat risk 2/10 · Minimal
- Hot days now (above 86°F)
- 9 days/yr
- Hot days in 30 yrs
- 22 days/yr
Wind risk 1/10 · Minimal
- Chance of severe wind over 30 yrs
- —
Air-quality risk 10/10 · Severe
- Unhealthy air days now
- 25 days/yr
- Unhealthy air days in 30 yrs
- 28 days/yr
Risk factors via First Street. Map © Google.
Why this score? — see what drove the C- grade
The composite is a weighted blend of 9 inputs, each scored 0–100. Each bar is that input's sub-score; the figure is the points it added to the 100-point composite (weight × sub-score).
- Cash flow +17.6/30.0
- ARV discount +7.5/15.0
- DSCR +5.5/10.0
- 1% rule +5.2/10.0
- Appreciation +5.0/10.0
- Schools +3.3/10.0
- Livability +2.8/5.0
- Rent growth +2.5/5.0
- Condition / age +2.5/5.0
$120,000
🖨 Deal sheet 📄 Offer letter ✓ Due diligence
Listing remarks MLS
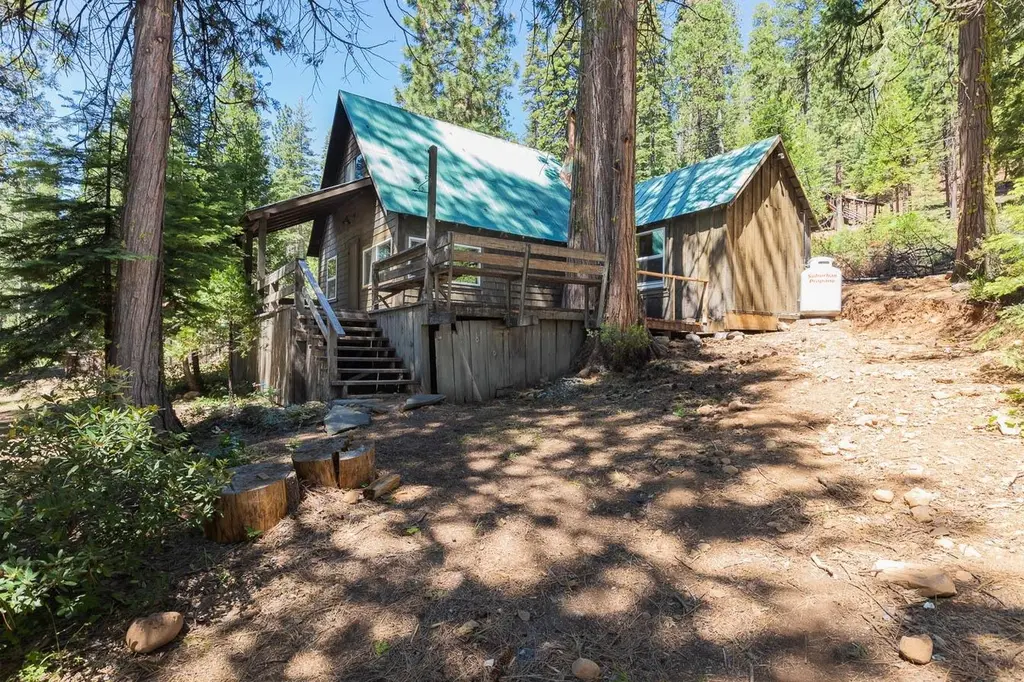
Adorable vintage Mineral cabin. Tons of charm and plenty of character! 2 bedrooms and a full bath on the main level and a pull down ladder shares with you a fabulous third bedroom/bunk area. The wedgewood stove in the kitchen is fabluous! The large deck has room for everyone! This is a loved little property looking for its next adventure!!
Key facts
- 0.49 acre lot
- Built 1938
- Listed 700 days
Property features AI
Finance
- Other: Pets allowed
- HOA & community: Mandatory association with an annual fee of $500 that includes water; Association reports no listed amenities
Exterior
- Parking: No garage; Unpaved driveway/sidewalks
- Utilities: Propane tank owned; Electric service listed as 'Other'; Private water source; Septic system; No irrigation
- Home design: Single-family residence (custom); Two levels / 2-story; Property condition listed as fixer and updated/remodeled; Facing/directions: property located on Hwy 36 (38752 Hwy 36, Mineral, CA)
- Construction: Built in 1938
- Exterior features: Metal roof; Lot described with 'other' features; Approximately 0.49 acre lot
Interior
- Kitchen: Free-standing gas range and oven; Free-standing refrigerator; Microwave; Laminate countertops
- Bedrooms: 3 bedrooms; Main level includes bedroom(s); upper level includes a loft
- Flooring: Laminate flooring
- Bathrooms: 1 full bathroom with shower stall and window
- Heating & cooling: Heating via fireplace(s); No central cooling
- Interior features: Stone freestanding fireplace; Fireplace described as 'other' style; Uncovered deck; Windows noted as energy-efficient
- Laundry & utility: No laundry hookups; Tankless water heater
Neighborhood map
What this means for you Summary
Snapshot
- This is a 3-bed/1.0-bath single-family listed at $120k.
Deal economics
- At list price, monthly cash flow is $94 ($1k/yr) — positive.
- The deal already cash-flows at list — no discount required.
- Meets the 1% rule at list price ($1k rent vs $120k).
- Recommended offer: $106k (12.0% below list) — sets the bar for market timing.
Location & tenants
- Location reads 55/100 on livability (#878 in CA) — a working-class tenant base; expect higher turnover. Strengths: housing A+; Watch: crime F, amenities F, commute F.
- Antelope Elementary (town): math 34% / reading 44% proficiency, ranked #249 of 517 in CA (top 48%) — families likely to look elsewhere, expect single-tenant / working-renter base with shorter leases.
- Market conditions: 8 active listings in the ZIP; 186 units permitted in Tehama County in 2024 (0 in 5+ unit buildings).
Forward outlook
- In year one you build about $4k of equity ($830 loan paydown + $4k appreciation (3.0% local appreciation)).
- Tehama County population projected at -14% by 2050 — secular population decline; favor cash flow + early exit over multi-decade hold.
- At projected returns (3.0% appreciation + 3.0% rent growth), your $34k cash investment doubles in ~6 years — after that, you're playing with house money.
- By year 8, paydown + projected appreciation supports a ~$33k cash-out refi (75% LTV) — recoverable capital for the next deal without selling this one.
Negotiation context
- It's been on market 701 days — a 12% lower offer ($106k) is reasonable based on typical stale-listing flexibility.
- Current owner paid $100k; 20% above their basis — modest negotiation headroom, anchor on the comps not their cost.
Risks & watch-outs
- Watch-outs: built in 1938 — expect roof / HVAC / electrical / plumbing capex.
- Climate carrying-cost: major wildfire risk — expect insurance premiums to compound above CPI over the hold.
Questions for the listing agent
- It's been on market 701 days. Have you received any prior offers? Is the seller open to a 12% concession, seller financing, or rate buy-down credit?
- Built in 1938 — when were the roof, HVAC, electrical panel, plumbing, and water heater last replaced?
- What does the HOA fee cover, when was the last increase, and are there any pending special assessments or reserve-fund shortfalls?
- Why hasn't it sold? Are there any deal-killer items the seller is aware of (foundation, flood, title, zoning, code violations)?
- Is there a deadline driving the sale (1031 exchange, divorce, estate, relocation)? That informs how much negotiation room exists.
- Crime grade is F in this area — have there been break-ins, vandalism, or insurance claims at this property in the last 3 years? What carrier currently insures it and at what premium?
- What's the average days-on-market for RENTAL listings here right now (not sales)? A rising rental-DOM trend means longer vacancies and softer asking-rent achievability than the comps imply.
- What's the recent tenant-quality profile in this submarket — average credit score on applications, eviction rate, late-payment / NSF rate, and stable-employment percentage? A property-management company in the area should have these aggregated.
- How much new for-sale + rental construction is in the pipeline within 1–3 miles? Heavy new supply typically softens prices + rents 12–24 months out; constrained supply supports both.
Investment metrics
- 1% rule
- 1.02% ✓
- Cap rate
- 7.23%
- Cash-on-cash
- 3.36%
- DSCR
- 1.15
- GRM
- 8.2
CMA / ARV
No comps found within radius.
Projected returns pro-forma
3.0% appreciation · 3.0% rent growth · sell at horizon
- IRR
- 10.7%
- Equity multiple
- 1.61×
- Total profit
- $20,486
- Equity at exit
- $53,957
- IRR
- 12.9%
- Equity multiple
- 2.92×
- Total profit
- $64,618
- Equity at exit
- $83,154
Cash invested: $33,600 (down + closing). Projections, not guarantees.
Landlord ↔ Tenant lean methodology
- Overall (STATE)
- 18 Strongly Tenant-Friendly
- State California
- 18 Strongly Tenant-Friendly · D+13
- County
- — inherits STATE
- City
- — inherits STATE
ZIP-level market 96063
- Active inventory
- 8
- Price-to-rent
- 8.2×
Monthly cashflow live
- Estimated rent
- $1,222 medium interval (Pro) →
- Mortgage (P&I)
- −$629
- Tax est. 1.5%
- −$150 /mo · $1,800/yr
- Insurance
- −$50
- HOA
- −$42
- Vacancy / Maint / Mgmt
- −$257
- Net cashflow
- $94
Break-even live
UW: 25.0% down · 7.5% · 30yr · 1.5% tax · 5.0% vac · 8.0% maint · 8.0% mgmt
Financing live
Cash to close
- Down payment
- $30,000
- Closing costs
- $3,600
- Reserves months
- —
- Total cash needed
- —
Loan-product check · same deal, 3 products live
Conventional
25% down · 7.5% · 30yr
- Down + closing
- —
- Monthly P&I
- —
- Monthly cashflow
- —
- DSCR
- —
- Eligible?
- —
Personal DTI + credit; lowest rate.
DSCR
20% down · 8.5% · 30yr
- Down + closing
- —
- Monthly P&I
- —
- Monthly cashflow
- —
- DSCR
- —
- Eligible?
- —
No personal income docs; deal must DSCR.
Hard money
10% down · 12.0% · 12mo
- Down + closing
- —
- Monthly P&I
- —
- Monthly cashflow
- —
- DSCR
- —
- Eligible?
- —
Short-term bridge; refi at stabilization.
HOA detail
- Monthly dues
- $42 · $504/yr
Listing history 18 events
-
2026-06-19days on market $120,000 Active 701 DOM
-
2026-06-18days on market $120,000 Active 700 DOM
-
2026-06-17days on market $120,000 Active 699 DOM
-
2026-06-16days on market $120,000 Active 698 DOM
-
2026-06-15days on market $120,000 Active 697 DOM
-
2026-06-14days on market $120,000 Active 695 DOM
-
2026-06-12days on market $120,000 Active 694 DOM
-
2026-06-09days on market $120,000 Active 691 DOM
-
2026-06-08days on market $120,000 Active 690 DOM
-
2026-06-07days on market $120,000 Active 689 DOM
-
2026-06-05days on market $120,000 Active 686 DOM
-
2026-06-03days on market $120,000 Active 685 DOM
-
2026-06-02days on market $120,000 Active 684 DOM
-
2026-06-01days on market $120,000 Active 683 DOM
-
2026-05-31days on market $120,000 Active 682 DOM
-
2026-05-30days on market $120,000 Active 681 DOM
-
2020-10-22soldstatus $99,999 344-char remark
Show marketing remark (344 chars)
Adorable vintage Mineral cabin. Tons of charm and plenty of character! 2 bedrooms and a full bath on the main level and a pull down ladder shares with you a fabulous third bedroom/bunk area. The wedgewood stove in the kitchen is fabluous! The large deck has room for everyone! This is a loved little property looking for its next adventure!!
-
2020-09-14$119,000 344-char remark
Show marketing remark (344 chars)
Adorable vintage Mineral cabin. Tons of charm and plenty of character! 2 bedrooms and a full bath on the main level and a pull down ladder shares with you a fabulous third bedroom/bunk area. The wedgewood stove in the kitchen is fabluous! The large deck has room for everyone! This is a loved little property looking for its next adventure!!
ⓘ Source: listings_history table (triggers on properties + properties_extension) + one-shot
backfill from property_details.listing_events for pre-trigger history.
Climate risk First Street
- Flood 1/10 Low FEMA zone D · 0% chance over 30 yrs
- Wildfire 6/10 Major
- Heat 2/10 Low 9 d/yr ≥86°F today · 22 d/yr by 30 yrs out
- Wind 1/10 Low
- Air quality 10/10 Extreme 25 unhealthy d/yr today · 28 by 30 yrs out
Nearby sold comps map
Loading sold comps map…
Walkable amenities ~0.75 mi
Loading nearby amenities…
Taxation est. · year 1
- Rental income
- $14,662
- − Mortgage interest
- −$6,722
- − Property taxes
- −$1,800
- − Insurance
- −$600
- − Repairs & maintenance
- −$1,173
- − Management
- −$1,173
- − HOA
- −$504
- − Depreciation
- −$3,491
- Taxable loss
- −$800
- Est. tax savings @ 24.0%
- +$192
- After-tax cash flow
- $1,320/yr
For passive investors: Depreciation is non-cash, so a rental often shows a tax loss while cash-flowing — sheltering income. Rental losses are passive: they offset passive income freely, and up to $25,000/yr can offset ordinary (W-2) income if you actively participate and your MAGI is under $100k (phasing out to $0 by $150k); unused losses carry forward. On sale, claimed depreciation is recaptured at up to 25%, and gains may owe capital-gains tax (a 1031 exchange can defer both). Figures are a year-1 estimate at your 24.0% rate — not tax advice; consult a CPA.
Schools (NCES district)
- District
- Antelope Elementary
- NCES district ID
- 0602760
- Math proficiency
- 34% ▼ -11.00%
- Reading proficiency
- 44% ▼ -6.00%
- Median HH income
- $40,985
- Composite
- 32.77/100
- National rank
- #5630
- State rank
- #249 of 517 in CA
Livability — Mineral
- Score
- 55/100
- State rank
- #878
- US rank
- #23717
Category grades
Schools grade is shown separately in the Schools card above.
Census & demographics
- Census place
- Mineral, CA
- City population
- 107
- Population (ZIP)
- 107
Population outlook (Tehama County) Hauer SSP2
- Today (2025)
- 61,058 people
- By 2030
- 59,493 · -2.6%
- By 2040
- 56,076 · -8.2%
- By 2050
- 52,372 · -14.2%
- By 2075
- 43,895 · -28.1%
- By 2100
- 34,186 · -44.0%
Race, ethnicity, and origin ACS 2023
- Neighborhood character
- Predominantly White (89%)
- Race & ethnicity
- White 89% Asian 11%
- Common ancestry
- Slovak 23%
- Foreign-born
- 22% · Canada
Political lean MEDSL · Tehama
- 2024 margin
- Solid R (+41.8) · D 27.9% · R 69.7% · Other 2.3%
- 2008→2024 swing
- -17.7pp toward R · 2008: -24.1pp · 2024: -41.8pp
- All cycles
- 2024: R+41.8 2020: R+35.6 2016: R+36.8 2012: R+27.4 2008: R+24.1
Not yet ingested
- Civics
- —
Market trends
- HPI YoY
- —
- Current HPI
- —
- Rent YoY
- —
- Metro
- —
- State GDP YoY
- ▲ 3.21%
- F500 in state
- 116
Industry mix (Fortune 500 HQ in CA)
| Industry | F500 HQs | Revenue |
|---|---|---|
| Technology | 27 | $1,492B |
|
||
| Financial Services | 3 | $174B |
|
||
| Retail | 3 | $44B |
|
||
| Insurance | 3 | $26B |
|
||
| Media / Entertainment | 2 | $115B |
|
||
| Pharmaceuticals / Biotech | 2 | $62B |
|
||
Price history
-16.0% since first listed2 events — show timeline
- 2020-10-22 Sold (MLS) $99,999 PAR
- 2020-09-14 Listed $119,000 PAR
Cash-flow waterfall
monthlySold comps — $/sqft
last 12 mo · ≤1 miLoading sold comps…