412 S Cypress Rd #225 · Pompano Beach, FL
Flood risk 4/10 · Minor
- FEMA flood zone
- X (shaded)
- Chance of flooding over 30 yrs
- 0.22%
- Est. flood insurance / yr
- $507 – $1,088
Fire risk 1/10 · Minimal
- Est. fire insurance / yr
- $947 – $1,759
Heat risk 9/10 · Severe
- Hot days now (above 106°F)
- 7 days/yr
- Hot days in 30 yrs
- 25 days/yr
Wind risk 10/10 · Severe
- Chance of severe wind over 30 yrs
- 99.0%
Air-quality risk 2/10 · Minimal
- Unhealthy air days now
- 1 days/yr
- Unhealthy air days in 30 yrs
- 2 days/yr
Risk factors via First Street. Map © Google.
Why this score? — see what drove the B grade
The composite is a weighted blend of 9 inputs, each scored 0–100. Each bar is that input's sub-score; the figure is the points it added to the 100-point composite (weight × sub-score).
- Cash flow +30.0/30.0
- 1% rule +10.0/10.0
- DSCR +10.0/10.0
- ARV discount +7.5/15.0
- Schools +4.1/10.0
- Livability +3.7/5.0
- Rent growth +3.0/5.0
- Condition / age +2.5/5.0
- Appreciation +0.0/10.0
$115,000
🖨 Deal sheet (PDF) 📄 Offer letter ✓ Due diligence
Listing remarks
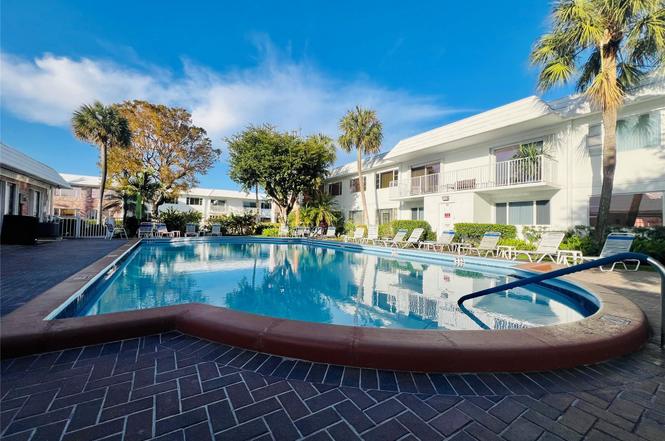
Welcome to your tranquil coastal retreat at The Virginian in Pompano Beach — where relaxed living meets everyday convenience. This spacious one-bedroom, one-and-a-half-bath residence is filled with natural sunlight, creating an airy ambiance that feels instantly welcoming and peaceful. Enjoy one of the largest private balconies in Pompano Beach, offering the perfect setting for morning coffee, and quiet evenings under the coastal sky. The layout provides exceptional space and comfort, ideal for those who appreciate room to relax and entertain without sacrificing simplicity. Residents of this charming 55+ community enjoy a sparkling saltwater pool, beautifully maintained grounds, and
Key facts
- $441 HOA
- Community pool
- Built 1967
Tags
Property features AI
Finance
- HOA & community: Monthly HOA fee of $441; HOA covers structure maintenance, sewer, trash, water, common areas, and recreation facilities; Community amenities include clubhouse, pool, picnic area, shuffleboard court, bike storage, kitchen facilities, library, and maintenance; Senior community
Exterior
- Security: Security features present
- Utilities: Water service included in HOA; Sewer service included in HOA; Trash service included in HOA
- Home design: Stock cooperative; Second-floor entry; 2 stories; Resale condition; Not waterfront
- Construction: Block construction
- Exterior features: Deck
Interior
- Kitchen: Electric range; Refrigerator
- Bedrooms: 2 bedrooms (main level)
- Flooring: Tile
- Bathrooms: 1 full bathroom; 1 half bathroom
- Heating & cooling: Central heating; Central air conditioning
- Interior features: Tile floors; Electric range; Refrigerator
Neighborhood map
What this means for you Summary
Snapshot
- This is a 2-bed/2.0-bath condo listed at $115k.
Deal economics
- At list price, monthly cash flow is $429 ($5k/yr) — positive.
- The deal already cash-flows at list — no discount required.
- Meets the 1% rule at list price ($2k rent vs $115k).
- Recommended offer: $105k (9.0% below list) — sets the bar for market timing.
Location & tenants
- Location reads 74/100 on livability (#284 in FL, #4,541 nationally) — a middle-class / working-renter tenant base. Strengths: commute A+, housing A+, cost of living B+; Watch: employment D+, amenities F.
- Broward (suburban): math 42% / reading 53% proficiency, ranked #46 of 73 in FL (top 63%) — families likely to look elsewhere, expect single-tenant / working-renter base with shorter leases.
- Zoned schools: Cypress Elementary School (math 26% / reading 30%, grade F, #1,951 of 2,144 statewide, top 91%, 740 students, 80% FRL); Pompano Beach Middle School (math 29% / reading 40%, grade F, #421 of 571 statewide, top 74%, 1,040 students, 73% FRL); Blanche Ely High School (math 7% / reading 29%, grade F, #570 of 667 statewide, top 86%, 1,906 students, 75% FRL) — zoned schools average 76% FRL vs 51% district-wide (24 pts higher); higher-poverty schools than district average — tighter screening recommended.
- Zoned-school proficiency averages 27% at this address vs 48% district-wide (-21 pts) — the specific schools serving this property underperform the Broward average; the district grade overstates school quality for this exact location.
- Market conditions: Rents rising (+2.1%/yr); 340 active listings in the ZIP; 40 comparable units currently listed for rent nearby; rentals at typical pace (median 26d on market — plan ~3-4 weeks tenant-placement turnaround); 2,111 units permitted in Broward County in 2024 (1,265 in 5+ unit buildings).
Forward outlook
- Local home prices are declining (-3.0%/yr); year-one equity from $795 of loan paydown is wiped out by about $3k of value loss. Plan a longer hold.
- Broward County population projected at +34% by 2050 — long-run rental-demand tailwind backs the buy-and-hold thesis.
- At projected returns (-3.0% appreciation + 2.1% rent growth), your $32k cash investment doubles in ~9 years — after that, you're playing with house money.
Negotiation context
- It's been on market 102 days — a 9% lower offer ($105k) is reasonable based on typical stale-listing flexibility.
- 3 sale attempts since 2y ago with the ask held roughly flat each time — persistent listings suggest the price (not the market) is what's stuck; bring a comps-based counter.
- Current owner paid $21k; list at $115k implies a 448% gain — meaningful room to come down on a strong offer.
Risks & watch-outs
- Watch-outs: HOA is 21% of rent.
- Climate carrying-cost: severe wind risk, 99% chance of damaging wind over 30y; extreme-heat days projected 7→25/yr by 2055 (HVAC capex compounding) — expect insurance premiums to compound above CPI over the hold.
Questions for the listing agent
- It's been on market 102 days. Have you received any prior offers? Is the seller open to a 9% concession, seller financing, or rate buy-down credit?
- Built in 1967 — when were the roof, HVAC, electrical panel, plumbing, and water heater last replaced?
- What does the HOA fee cover, when was the last increase, and are there any pending special assessments or reserve-fund shortfalls?
- Any open or pending special assessments — roof, HVAC, plumbing, elevator, façade? What's the per-unit balance and payoff schedule, and is the seller paying it off at close or rolling it to the buyer?
- Why hasn't it sold? Are there any deal-killer items the seller is aware of (foundation, flood, title, zoning, code violations)?
- Is there a deadline driving the sale (1031 exchange, divorce, estate, relocation)? That informs how much negotiation room exists.
- Schools are D-rated, which usually means shorter tenancies and higher turnover. Who's the typical renter profile here, and what's been the actual vacancy rate?
- What's the average days-on-market for RENTAL listings here right now (not sales)? A rising rental-DOM trend means longer vacancies and softer asking-rent achievability than the comps imply.
- What's the recent tenant-quality profile in this submarket — average credit score on applications, eviction rate, late-payment / NSF rate, and stable-employment percentage? A property-management company in the area should have these aggregated.
- How much new apartment / multifamily construction is in the pipeline within 1–3 miles? Heavy new supply (>2% of stock underway) typically softens rents 12–24 months out; light construction supports rent growth.
Investment metrics
- 1% rule
- 1.87% ✓
- Cap rate
- 10.77%
- Cash-on-cash
- 15.98%
- DSCR
- 1.71
- GRM
- 4.5
CMA / ARV
No comps found within radius.
Projected returns pro-forma
-3.0% appreciation · 2.12% rent growth · sell at horizon
- IRR
- 5.8%
- Equity multiple
- 1.22×
- Total profit
- $7,116
- Equity at exit
- $17,147
- IRR
- 14.2%
- Equity multiple
- 2.09×
- Total profit
- $35,076
- Equity at exit
- $9,943
Cash invested: $32,200 (down + closing). Projections, not guarantees.
Landlord ↔ Tenant lean methodology
- Overall (STATE)
- 87 Strongly Landlord-Friendly
- State Florida
- 87 Strongly Landlord-Friendly · R+3
- County
- — inherits STATE
- City
- — inherits STATE
ZIP-level market 33060
- Home prices YoY
- -23.6%
- Rents YoY
- 2.1%
- Active inventory
- 340
- Price-to-rent
- 4.5×
Monthly cashflow live
- Estimated rent
- $2,151 high interval (Pro) →
- Mortgage (P&I)
- −$603
- Tax from tax record
- −$178 /mo · $2,141/yr
- Insurance
- −$48
- HOA
- −$441
- Vacancy / Maint / Mgmt
- −$452
- Net cashflow
- $429
Break-even live
Sensitivity live
| Price | -10% $494 | -5% $461 | +0% $429 | +5% $396 | +10% $364 |
|---|---|---|---|---|---|
| Rent | -10% $259 | -5% $344 | +0% $429 | +5% $514 | +10% $599 |
| Rate | -1.0pp $487 | -0.5pp $458 | base $429 | +0.5pp $399 | +1.0pp $369 |
UW: 25.0% down · 7.5% · 30yr · 1.5% tax · 5.0% vac · 8.0% maint · 8.0% mgmt
Financing live
Cash to close
- Down payment
- $28,750
- Closing costs
- $3,450
- Reserves months
- —
- Total cash needed
- —
Loan-product check · same deal, 3 products live
Conventional
25% down · 7.5% · 30yr
- Down + closing
- —
- Monthly P&I
- —
- Monthly cashflow
- —
- DSCR
- —
- Eligible?
- —
Personal DTI + credit; lowest rate.
DSCR
20% down · 8.5% · 30yr
- Down + closing
- —
- Monthly P&I
- —
- Monthly cashflow
- —
- DSCR
- —
- Eligible?
- —
No personal income docs; deal must DSCR.
Hard money
10% down · 12.0% · 12mo
- Down + closing
- —
- Monthly P&I
- —
- Monthly cashflow
- —
- DSCR
- —
- Eligible?
- —
Short-term bridge; refi at stabilization.
Rent comps 40 comps
| Address | Beds | Baths | Sqft | Rent | $/sqft | DOM | Units | Dist |
|---|---|---|---|---|---|---|---|---|
| 13 SW 3rd St #13 Pompano Beach, FL | 2.0 | 1.5 | 1040 | $2,400 | $2.31 | 25d | 1 | 0.17mi |
| 280 S Cypress Rd #310 Pompano Beach, FL | 1.0 | 1.0 | 650 | $1,700 | $2.62 | 25d | 1 | 0.19mi |
| 81 SW 3rd St Unit 81 Pompano Beach, FL | 2.0 | 1.5 | 1040 | $2,100 | $2.02 | 25d | 1 | 0.20mi |
| 55 SW 3rd St Pompano Beach, FL | 2.0 | 1.0 | 1040 | $2,500 | $2.40 | 25d | 1 | 0.20mi |
| 270 S Cypress Rd #204 Pompano Beach, FL | 1.0 | 1.5 | 650 | $1,650 | $2.54 | 12d | 1 | 0.21mi |
| 270 S Cypress Rd #204 Pompano Beach, FL | 1.0 | 1.5 | 650 | $1,600 | $2.46 | 12d | 1 | 0.21mi |
| 260 S Cypress Rd #108 Pompano Beach, FL | 2.0 | 2.0 | 850 | $1,900 | $2.24 | 16d | 1 | 0.23mi |
| 147 SW 3rd St Pompano Beach, FL | 2.0 | 1.5 | 1040 | $2,500 | $2.40 | 9d | 1 | 0.24mi |
| 253 S Cypress Rd #214 Pompano Beach, FL | 1.0 | 1.0 | 678 | $1,450 | $2.14 | 25d | 1 | 0.26mi |
| 138 S Cypress Rd #224 Pompano Beach, FL | 2.0 | 2.0 | 936 | $2,600 | $2.78 | 15d | 1 | 0.31mi |
| 132 S Cypress Rd #523 Pompano Beach, FL | 2.0 | 2.0 | 936 | $2,000 | $2.14 | 25d | 1 | 0.34mi |
| 201 SE 6th Ave #7 Pompano Beach, FL | 2.0 | 2.0 | 939 | $1,900 | $2.02 | 25d | 1 | 0.46mi |
| 151 SE 6th Ave Pompano Beach, FL | 1.0 | 1.5 | 700 | $1,525 | $2.18 | 25d | 2 | 0.48mi |
| 475 SE 1st St Pompano Beach, FL | 3.0 | 1.0–2.0 | 1017 | $3,718 | $3.65 | 0d | 17 | 0.50mi |
| 101 SE 6th Ave Pompano Beach, FL | 1.0–2.0 | 1.5–2.0 | 939 | $2,099 | $2.24 | 25d | 3 | 0.50mi |
| 313 SW 1st Ct Unit L4 Pompano Beach, FL | 2.0 | 2.0 | 855 | $2,300 | $2.69 | 5d | 1 | 0.53mi |
| 313 SW 1st Ct Unit L4 Pompano Beach, FL | 2.0 | 2.0 | 855 | $2,500 | $2.92 | 5d | 1 | 0.53mi |
| 651 Pine Dr Pompano Beach, FL | 2.0 | 2.0 | 1000 | $2,000 | $2.00 | 25d | 1 | 0.54mi |
| 320 SW 1st St Pompano Beach, FL | 2.0 | 2.0 | 870 | $1,850 | $2.13 | 25d | 1 | 0.56mi |
| 840 Pine Dr #103 Pompano Beach, FL | 2.0 | 2.0 | 904 | $2,800 | $3.10 | 25d | 1 | 0.56mi |
| 200 NE 1st Ave Pompano Beach, FL | 2.0 | 1.0–2.5 | 1149 | $3,600 | $3.13 | 0d | 47 | 0.59mi |
| 241 SE 9th Ave Pompano Beach, FL | 2.0 | 2.0 | 725 | $1,800 | $2.48 | 13d | 2 | 0.59mi |
| 912 Pine Dr #211 Pompano Beach, FL | 2.0 | 2.0 | 949 | $1,900 | $2.00 | 25d | 1 | 0.60mi |
| 344 SW 1st St #6 Pompano Beach, FL | 2.0 | 2.0 | 840 | $1,825 | $2.17 | 16d | 1 | 0.60mi |
| 450 SW 2nd St Unit 518-7 Pompano Beach, FL | 2.0 | 1.0 | 800 | $1,750 | $2.19 | 25d | 1 | 0.65mi |
| 320 SE 10th Ave Unit D Pompano Beach, FL | 2.0 | 2.0 | 1000 | $2,300 | $2.30 | 25d | 1 | 0.66mi |
| 500 SW 2nd Ct Pompano Beach, FL | 1.0 | 1.0 | 650 | $1,595 | $2.45 | 25d | 1 | 0.67mi |
| 305 SE 11th Ave Unit D Pompano Beach, FL | 3.0 | 2.0 | 1000 | $2,400 | $2.40 | 18d | 1 | 0.69mi |
| 344 SE 11th Ave #8 Pompano Beach, FL | 1.0 | 1.0 | 600 | $1,500 | $2.50 | 25d | 1 | 0.70mi |
| 1100 Pine Dr #102 Pompano Beach, FL | 2.0 | 2.0 | 950 | $2,100 | $2.21 | 25d | 1 | 0.70mi |
| 20 NW 7th Ave #6 Pompano Beach, FL | 3.0 | 1.5 | 1088 | $2,150 | $1.98 | 16d | 1 | 0.72mi |
| 160 SE 12th St Pompano Beach, FL | 2.0 | 2.0 | 950 | $5,390 | $5.67 | 25d | 1 | 0.72mi |
| 103 NW 7th Ave Pompano Beach, FL | 2.0 | 1.0 | 650 | $2,000 | $3.08 | 25d | 1 | 0.77mi |
| 1156 SW 4th Ave Pompano Beach, FL | 2.0 | 1.0 | 945 | $3,300 | $3.49 | 6d | 1 | 0.79mi |
| 100 NW 8th St Pompano Beach, FL | 2.0 | 2.0 | 1024 | $2,175 | $2.12 | 25d | 1 | 0.90mi |
| 1261 NE 2nd St Pompano Beach, FL | 2.0 | 1.0 | 1010 | $2,650 | $2.62 | 23d | 1 | 0.95mi |
| 610 NW 7th Ave Pompano Beach, FL | 1.0–2.0 | 1.0 | 725 | $1,800 | $2.48 | 25d | 3 | 0.98mi |
| 360 NW 8th St Unit 8 Pompano Beach, FL | 2.0 | 1.0 | 875 | $1,900 | $2.17 | 25d | 1 | 0.98mi |
| 810 NE 3rd Ave Pompano Beach, FL | 2.0 | 1.0 | 650 | $3,000 | $4.62 | 12d | 1 | 0.99mi |
| 810 NE 3rd Ave Pompano Beach, FL | 2.0 | 1.0 | 650 | $2,900 | $4.46 | 2d | 1 | 0.99mi |
HOA detail condo
- Monthly dues
- $441 · $5,292/yr
- Likely covers
- waterlandscapingpool
- Assessments
- None detected in remarks — confirm with the listing agent.
Listing history 19 events
-
2026-06-21days on market $115,000 Active 102 DOM
-
2026-06-18days on market $115,000 Active 99 DOM
-
2026-06-17days on market $115,000 Active 98 DOM
-
2026-06-16days on market $115,000 Active 97 DOM
-
2026-06-15days on market $115,000 Active 96 DOM
-
2026-06-13days on market $115,000 Active 94 DOM
-
2026-06-09days on market $115,000 Active 90 DOM
-
2026-06-07days on market $115,000 Active 88 DOM
-
2026-06-04days on market $115,000 Active 85 DOM
-
2026-06-03days on market $115,000 Active 84 DOM
-
2026-06-02days on market $115,000 Active 83 DOM
-
2026-06-01days on market $115,000 Active 82 DOM
-
2026-05-31days on market $115,000 Active 81 DOM
-
2026-03-16historical $1,600
-
2026-03-02$115,000 Active
-
2025-11-06$1,600
-
2024-11-10historical
-
2024-06-13$133,900 Active
-
1999-04-29soldstatus $21,000
ⓘ Source: listings_history table (triggers on properties + properties_extension) + one-shot
backfill from property_details.listing_events for pre-trigger history.
Tax reassessment forecast FL · Resets to sale price
- Current annual tax
- $2,141 · $178/mo
- Projected year-2 tax
- $2,141 · $178/mo
- Expected delta
- $0/yr ($0/mo · 0.0%)
ⓘ Screening estimate from a state-policy table — verify with the county assessor before closing.
Climate risk First Street
- Flood 4/10 Moderate FEMA zone X (shaded) · 22% chance over 30 yrs
- Wildfire 1/10 Low
- Heat 9/10 Extreme 7 d/yr ≥106°F today · 25 d/yr by 30 yrs out
- Wind 10/10 Extreme 99% chance of damaging wind over 30 yrs
- Air quality 2/10 Low 1 unhealthy d/yr today · 2 by 30 yrs out
Nearby sold comps map
Loading sold comps map…
Walkable amenities ~0.75 mi
Loading nearby amenities…
Taxation est. · year 1
- Rental income
- $25,812
- − Mortgage interest
- −$6,442
- − Property taxes
- −$2,141
- − Insurance
- −$575
- − Repairs & maintenance
- −$2,065
- − Management
- −$2,065
- − HOA
- −$5,292
- − Depreciation
- −$3,345
- Taxable income
- $3,887
- Est. tax owed @ 24.0%
- −$933
- After-tax cash flow
- $4,214/yr
For passive investors: Depreciation is non-cash, so a rental often shows a tax loss while cash-flowing — sheltering income. Rental losses are passive: they offset passive income freely, and up to $25,000/yr can offset ordinary (W-2) income if you actively participate and your MAGI is under $100k (phasing out to $0 by $150k); unused losses carry forward. On sale, claimed depreciation is recaptured at up to 25%, and gains may owe capital-gains tax (a 1031 exchange can defer both). Figures are a year-1 estimate at your 24.0% rate — not tax advice; consult a CPA.
Schools (NCES district)
- District
- Broward
- NCES district ID
- 1200180
- Math proficiency
- 42% ▼ -18.00%
- Reading proficiency
- 53% ▼ -5.00%
- Median HH income
- $52,139
- Composite
- 40.88/100
- National rank
- #3621
- State rank
- #46 of 73 in FL
Livability — Pompano Beach
- Score
- 74/100
- State rank
- #284
- US rank
- #4541
Category grades
Schools grade is shown separately in the Schools card above.
Census & demographics
- Census place
- Pompano Beach, FL
- County
- Broward County · 1,963,430 people
- City population
- 155,861
- Metro
- Miami-Fort Lauderdale-Pompano Beach, FL
- Population (ZIP)
- 37,233
- Household income
- $64,819
- Rent vs Own
- Severe rent burden
- 2870.0
Population outlook (Broward County) Hauer SSP2
- Today (2025)
- 2,207,033 people
- By 2030
- 2,360,704 · +7.0%
- By 2040
- 2,661,208 · +20.6%
- By 2050
- 2,946,698 · +33.5%
- By 2075
- 3,602,273 · +63.2%
- By 2100
- 3,970,984 · +79.9%
Race, ethnicity, and origin ACS 2023
- Neighborhood character
- Diverse neighborhood (Simpson 0.69)
- Race & ethnicity
- Black 38% White 33% Hispanic / Latino 26% Two or more races 14%
- Hispanic origin (detail)
- Mexican 9% Puerto Rican 2% Cuban 3% Dominican 1%
- Common ancestry
- Hispanic 13% Romanian 2% Slovak 1%
- Foreign-born
- 31% · Canada, Jamaica
- Languages at home
- 60% English-only · Spanish 23% French/Haitian/Cajun 13% Other Indo-European 2%
Political lean MEDSL · Broward
- 2024 margin
- D (+17.0) · D 58.0% · R 41.0%
- 2008→2024 swing
- -17.8pp toward R · 2008: 34.7pp · 2024: 17.0pp
- All cycles
- 2024: D+17.0 2020: D+29.8 2016: D+35.0 2012: D+34.9 2008: D+34.7
Not yet ingested
- Civics
- —
Market trends
- HPI YoY
- ▼ -131.09%
- Current HPI
- 425.3083
- Rent YoY
- ▲ 2.12%
- Metro
- Miami-Fort Lauderdale-Pompano Beach, FL
- State GDP YoY
- ▲ 3.28%
- F500 in state
- 36
Industry mix (Fortune 500 HQ in FL)
| Industry | F500 HQs | Revenue |
|---|---|---|
| Industrial Technology | 2 | $29B |
|
||
| Insurance | 2 | $17B |
|
||
| Retail | 1 | $60B |
|
||
| Technology Distribution | 1 | $58B |
|
||
| Homebuilding | 1 | $35B |
|
||
| Technology Manufacturing | 1 | $35B |
|
||
Price history
-92.4% since first listed6 events — show timeline
- 2026-03-16 Rental Removed $1,600 GFLMLS
- 2026-03-02 Listed $115,000 Beaches MLS
- 2025-11-06 Listed for Rent $1,600 GFLMLS
- 2024-11-10 Listing Removed — MARMLS
- 2024-06-13 Listed $133,900 MARMLS
- 1999-04-29 Sold (Public Records) $21,000 Public Records
Property tax history
+7.8%/yrLatest (2025): $2,141 · +7.7% YoY. Source: county tax records.
Cash-flow waterfall
monthlySold comps — $/sqft
last 12 mo · ≤1 miLoading sold comps…