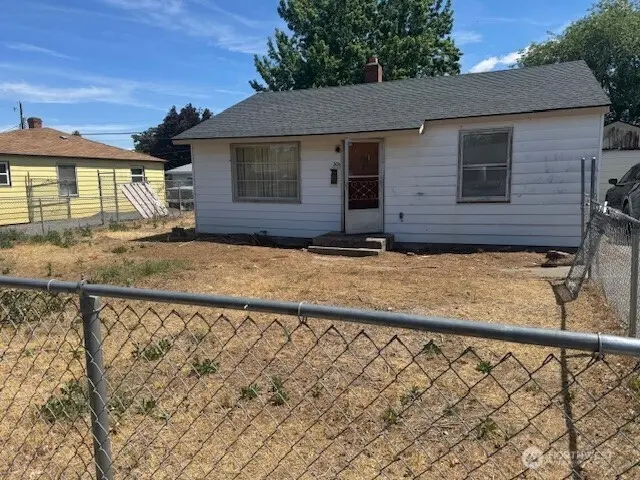
30 NE H St · Ephrata, WA
Flood risk 1/10 · Minimal
- FEMA flood zone
- X (unshaded)
- Chance of flooding over 30 yrs
- 0.0%
- Est. flood insurance / yr
- $507 – $1,088
Fire risk 5/10 · Moderate
- Est. fire insurance / yr
- $604 – $1,122
Heat risk 4/10 · Minor
- Hot days now (above 97°F)
- 7 days/yr
- Hot days in 30 yrs
- 14 days/yr
Wind risk 1/10 · Minimal
- Chance of severe wind over 30 yrs
- —
Air-quality risk 9/10 · Severe
- Unhealthy air days now
- 19 days/yr
- Unhealthy air days in 30 yrs
- 19 days/yr
Risk factors via First Street. Map © Google.
Why this score? — see what drove the C+ grade
The composite is a weighted blend of 9 inputs, each scored 0–100. Each bar is that input's sub-score; the figure is the points it added to the 100-point composite (weight × sub-score).
- Cash flow +22.4/30.0
- ARV discount +15.0/15.0
- DSCR +7.2/10.0
- Schools +5.2/10.0
- 1% rule +5.1/10.0
- Livability +4.0/5.0
- Rent growth +2.5/5.0
- Condition / age +2.5/5.0
- Appreciation +0.0/10.0
$138,000
🖨 Deal sheet (PDF) 📄 Offer letter ✓ Due diligence
Listing remarks
Investor Opportunity!Unlock the potential of this 2-bedroom, 1-bath home with a detached garage. Featuring a new roof, this property is ready for its next owner to bring their vision and creativity. Whether you're looking for a fix-and-flip project, rental investment, or a home to renovate and make your own, this property offers a great opportunity. The home is being sold as-is, providing the chance to add value through improvements and updates. Don't miss the opportunity to transform this property into something special!Sold As-Is. Buyers are encouraged to conduct their own inspections and due diligence.
Key facts
- Fix-and-flip project
- Rental investment
- Home to renovate
Tags
Property features AI
Finance
- Other: Living area 748 square feet; Lot size approximately 0.1395 acres; Taxes listed (verify for accuracy)
- Financial info: Accepts Cash and Rehab Loan financing
Exterior
- Parking: Detached garage; 1 covered parking space; 2 uncovered parking spaces
- Security: Fully fenced
- Utilities: Electric energy source; Public water (City of Ephrata); Sewer connected (City of Ephrata); Power provided by Grant County PUD
- Home design: Single-family residence; One story; Built on lot; Has a view; City zoning
- Construction: Metal/vinyl construction; Composition roof; Poured concrete foundation; Built as a house
- Exterior features: Metal/vinyl exterior; Paved site; Terraced topography
Interior
- Bedrooms: 2 bedrooms (both on main level)
- Flooring: Hardwood
- Bathrooms: 1 full bathroom (on main level)
- Heating & cooling: Heat pump heating; No central cooling
- Interior features: Hardwood flooring; Fully fenced
Neighborhood map
What this means for you Summary
Snapshot
- This is a 2-bed/1.0-bath single-family listed at $138k.
Deal economics
- At list price, monthly cash flow is $230 ($3k/yr) — positive.
- The deal already cash-flows at list — no discount required.
- Meets the 1% rule at list price ($1k rent vs $138k).
- Cap rate 8.3% vs local median 3.3% in Ephrata — top-decile yield for the area; either an underpriced asset or a hidden risk that comps aren't pricing in. Stress-test before assuming the spread holds.
Location & tenants
- Location reads 80/100 on livability (#83 in WA, #1,613 nationally) — a professional / high-income tenant draw. Strengths: commute A+, cost of living A+, housing A+; Watch: amenities F.
- Ephrata School District (town): math 56% / reading 62% proficiency, ranked #72 of 291 in WA (top 25%) — acceptable for families but not a draw, mixed tenant base, ~2y average lease.
- Zoned schools: Grant Elementary (490 students, 67% FRL); Ephrata Middle School (450 students, 63% FRL); Ephrata High School (882 students, 60% FRL) — zoned schools average 63% FRL vs 46% district-wide (18 pts higher); higher-poverty schools than district average — tighter screening recommended.
- Market conditions: 235 active listings in the ZIP; 4 comparable units currently listed for rent nearby; rentals lingering (median 46d on market — plan ~5-8 weeks vacancy on turnover, expect pricing pressure); 100% of comp listings sitting > 30 days — soft ceiling on asking rent; 559 units permitted in Grant County in 2024 (35 in 5+ unit buildings).
Forward outlook
- Local home prices are declining (-3.0%/yr); year-one equity from $954 of loan paydown is wiped out by about $4k of value loss. Plan a longer hold.
- Grant County population projected at +16% by 2050 — long-run rental-demand tailwind backs the buy-and-hold thesis.
Negotiation context
- Only 3 days on market — expect competitive offers; lowballing is unlikely to land.
Risks & watch-outs
- Watch-outs: built in 1950 — expect roof / HVAC / electrical / plumbing capex.
- Climate carrying-cost: moderate wildfire risk — expect insurance premiums to compound above CPI over the hold.
Questions for the listing agent
- Built in 1950 — when were the roof, HVAC, electrical panel, plumbing, and water heater last replaced?
- Is there a deadline driving the sale (1031 exchange, divorce, estate, relocation)? That informs how much negotiation room exists.
- What's the average days-on-market for RENTAL listings here right now (not sales)? A rising rental-DOM trend means longer vacancies and softer asking-rent achievability than the comps imply.
- What's the recent tenant-quality profile in this submarket — average credit score on applications, eviction rate, late-payment / NSF rate, and stable-employment percentage? A property-management company in the area should have these aggregated.
- How much new for-sale + rental construction is in the pipeline within 1–3 miles? Heavy new supply typically softens prices + rents 12–24 months out; constrained supply supports both.
Investment metrics
- 1% rule
- 1.01% ✓
- Cap rate
- 8.29%
- Cash-on-cash
- 7.15%
- DSCR
- 1.32
- GRM
- 8.3
CMA / ARV
- ARV (on-the-fly)
- $199,716
- Comps found
- 6
Show comp detail 6 sales within ~0.75 mi
| Address | Dist | Beds/Ba | Sqft | Sold | Price | $/sf | Match |
|---|---|---|---|---|---|---|---|
| 30 NE H St | 0.00mi | 2/1.0 | 748 (0%) | 0mo | $138,000 | $184 | 100 |
| 8 G St SE | 0.10mi | 2/1.0 | 738 (-1%) | 21mo | $240,000 | $325 | 76 |
| 141 G St NE | 0.22mi | 2/1.0 | 769 (+3%) | 20mo | $205,000 | $267 | 69 |
| 160 F St NE | 0.26mi | 2/1.0 | 756 (+1%) | 23mo | $219,000 | $290 | 67 |
| 57 SE G St | 0.19mi | 2/2.0 | 830 (+11%) | 9mo | $220,000 | $265 | 61 |
| 12 F St SE | 0.13mi | 2/1.0 | 832 (+11%) | 23mo | $183,750 | $221 | 56 |
Match score weights: distance 35% · size 25% · config 20% · recency 20%. Top-matched comps best support the ARV.
Projected returns pro-forma
-3.0% appreciation · 3.0% rent growth · sell at horizon
- IRR
- -5.4%
- Equity multiple
- 0.80×
- Total profit
- $-7,733
- Equity at exit
- $20,576
- IRR
- 4.3%
- Equity multiple
- 1.31×
- Total profit
- $12,013
- Equity at exit
- $11,932
Cash invested: $38,640 (down + closing). Projections, not guarantees.
Landlord ↔ Tenant lean methodology
- Overall (STATE)
- 28 Tenant-Leaning
- State Washington
- 28 Tenant-Leaning · D+8
- County
- — inherits STATE
- City
- — inherits STATE
ZIP-level market 98823
- Active inventory
- 235
- Price-to-rent
- 8.3×
Monthly cashflow live
- Estimated rent
- $1,389 medium interval (Pro) →
- Mortgage (P&I)
- −$724
- Tax from tax record
- −$86 /mo · $1,029/yr
- Insurance
- −$58
- HOA
- −$0
- Lot rent
- −$0
- Vacancy / Maint / Mgmt
- −$292
- Net cashflow
- $230
Break-even live
Sensitivity live
| Price | -10% $308 | -5% $269 | +0% $230 | +5% $191 | +10% $152 |
|---|---|---|---|---|---|
| Rent | -10% $120 | -5% $175 | +0% $230 | +5% $285 | +10% $340 |
| Rate | -1.0pp $300 | -0.5pp $265 | base $230 | +0.5pp $194 | +1.0pp $158 |
UW: 25.0% down · 7.5% · 30yr · 1.5% tax · 5.0% vac · 8.0% maint · 8.0% mgmt
Financing live
Cash to close
- Down payment
- $34,500
- Closing costs
- $4,140
- Reserves months
- —
- Total cash needed
- —
Loan-product check · same deal, 3 products live
Conventional
25% down · 7.5% · 30yr
- Down + closing
- —
- Monthly P&I
- —
- Monthly cashflow
- —
- DSCR
- —
- Eligible?
- —
Personal DTI + credit; lowest rate.
DSCR
20% down · 8.5% · 30yr
- Down + closing
- —
- Monthly P&I
- —
- Monthly cashflow
- —
- DSCR
- —
- Eligible?
- —
No personal income docs; deal must DSCR.
Hard money
10% down · 12.0% · 12mo
- Down + closing
- —
- Monthly P&I
- —
- Monthly cashflow
- —
- DSCR
- —
- Eligible?
- —
Short-term bridge; refi at stabilization.
Rent comps 4 comps
| Address | Beds | Baths | Sqft | Rent | $/sqft | DOM | Units | Dist |
|---|---|---|---|---|---|---|---|---|
| 40505 NW Basin St Ephrata, WA | 2.0 | 1.0 | 750 | $1,190 | $1.59 | 46d | 1 | 0.56mi |
| 908 SW C ST Ephrata, WA | 2.0 | 1.0 | 750 | $1,295 | $1.73 | 46d | 1 | 1.00mi |
| 1330 C St SW Ephrata, WA | 2.0 | 1.0 | 656 | $1,650 | $2.52 | 46d | 1 | 1.38mi |
| 1411 Basin St SW Unit 7 Ephrata, WA | 2.0 | 1.0 | 650 | $1,150 | $1.77 | 46d | 1 | 1.41mi |
Listing history 4 events
-
2026-06-07statusdays on market $138,000 Pending 3 DOM
-
2026-06-05days on market $138,000 Active 2 DOM
-
2026-06-03remarks 612-char remark
-
2026-06-03$138,000 Active 1 DOM
ⓘ Source: listings_history table (triggers on properties + properties_extension) + one-shot
backfill from property_details.listing_events for pre-trigger history.
Tax reassessment forecast WA · Resets to sale price
- Current annual tax
- $1,029 · $86/mo
- Projected year-2 tax
- $1,352 · $113/mo
- Expected delta
- +$323/yr (+$27/mo · 31.4%)
ⓘ Screening estimate from a state-policy table — verify with the county assessor before closing.
Climate risk First Street
- Flood 1/10 Low FEMA zone X (unshaded) · 0% chance over 30 yrs
- Wildfire 5/10 Major
- Heat 4/10 Moderate 7 d/yr ≥97°F today · 14 d/yr by 30 yrs out
- Wind 1/10 Low
- Air quality 9/10 Extreme 19 unhealthy d/yr today · 19 by 30 yrs out
Nearby sold comps map
Loading sold comps map…
Walkable amenities ~0.75 mi
Loading nearby amenities…
Taxation est. · year 1
- Rental income
- $16,665
- − Mortgage interest
- −$7,730
- − Property taxes
- −$1,029
- − Insurance
- −$690
- − Repairs & maintenance
- −$1,333
- − Management
- −$1,333
- − Depreciation
- −$4,015
- Taxable income
- $535
- Est. tax owed @ 24.0%
- −$128
- After-tax cash flow
- $2,634/yr
For passive investors: Depreciation is non-cash, so a rental often shows a tax loss while cash-flowing — sheltering income. Rental losses are passive: they offset passive income freely, and up to $25,000/yr can offset ordinary (W-2) income if you actively participate and your MAGI is under $100k (phasing out to $0 by $150k); unused losses carry forward. On sale, claimed depreciation is recaptured at up to 25%, and gains may owe capital-gains tax (a 1031 exchange can defer both). Figures are a year-1 estimate at your 24.0% rate — not tax advice; consult a CPA.
Schools (NCES district)
- District
- Ephrata School District
- NCES district ID
- 5302610
- Math proficiency
- 56% ▼ -1.00%
- Reading proficiency
- 62% ▲ 1.00%
- Median HH income
- $49,652
- Composite
- 51.86/100
- National rank
- #3574
- State rank
- #72 of 291 in WA
Livability — Ephrata
- Score
- 80/100
- State rank
- #83
- US rank
- #1613
Category grades
Schools grade is shown separately in the Schools card above.
Census & demographics
- Census place
- Ephrata, WA
- County
- Grant County · 61,643 people
- City population
- 12,188
- Metro
- Moses Lake, WA
- Population (ZIP)
- 12,188
- Household income
- $73,074
- Rent vs Own
- Severe rent burden
- 182.0
Population outlook (Grant County) Hauer SSP2
- Today (2025)
- 99,356 people
- By 2030
- 102,107 · +2.8%
- By 2040
- 108,318 · +9.0%
- By 2050
- 114,712 · +15.5%
- By 2075
- 131,376 · +32.2%
- By 2100
- 146,163 · +47.1%
Race, ethnicity, and origin ACS 2023
- Neighborhood character
- Majority White (64%)
- Race & ethnicity
- White 64% Hispanic / Latino 30% Two or more races 13%
- Hispanic origin (detail)
- Mexican 29%
- Common ancestry
- Italian 4% Scottish 3% Portuguese 3%
- Foreign-born
- 7% · Canada
- Languages at home
- 77% English-only · Spanish 23%
Political lean MEDSL · Grant
- 2024 margin
- Solid R (+37.5) · D 30.0% · R 67.4% · Other 2.6%
- 2008→2024 swing
- -9.9pp toward R · 2008: -27.5pp · 2024: -37.5pp
- All cycles
- 2024: R+37.5 2020: R+34.4 2016: R+37.9 2012: R+32.6 2008: R+27.5
Not yet ingested
- Civics
- —
Market trends
- HPI YoY
- ▼ -356.36%
- Current HPI
- 219.8763
- Rent YoY
- —
- Metro
- Moses Lake, WA
- State GDP YoY
- ▲ 4.65%
- F500 in state
- 22
Industry mix (Fortune 500 HQ in WA)
| Industry | F500 HQs | Revenue |
|---|---|---|
| Retail | 2 | $269B |
|
||
| Technology / Retail | 1 | $638B |
|
||
| Technology | 1 | $245B |
|
||
| Telecommunications | 1 | $38B |
|
||
| Food / Beverage | 1 | $36B |
|
||
| Automotive / Trucks | 1 | $34B |
|
||
Price history
1 event — show timeline
- 2026-06-02 Listed $138,000 NWMLS as Distributed by MLS Grid
Property tax history
+0.8%/yrLatest (2026): $1,029 · +0.0% YoY. Source: county tax records.
Cash-flow waterfall
monthlySold comps — $/sqft
last 12 mo · ≤1 miLoading sold comps…