 🏷️ Likely Rental
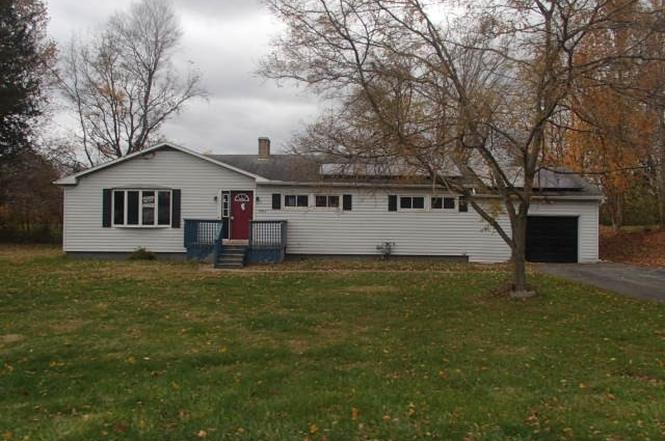
4955 Westmoreland Rd · Clark Mills, NY
Flood risk 1/10 · Minimal
- FEMA flood zone
- X (unshaded)
- Chance of flooding over 30 yrs
- 0.0%
- Est. flood insurance / yr
- $473 – $860
Fire risk 1/10 · Minimal
- Est. fire insurance / yr
- $691 – $1,283
Heat risk 3/10 · Minor
- Hot days now (above 95°F)
- 7 days/yr
- Hot days in 30 yrs
- 16 days/yr
Wind risk 1/10 · Minimal
- Chance of severe wind over 30 yrs
- 1.0%
Air-quality risk 2/10 · Minimal
- Unhealthy air days now
- 0 days/yr
- Unhealthy air days in 30 yrs
- 2 days/yr
Risk factors via First Street. Map © Google.
Why this score? — see what drove the B+ grade
The composite is a weighted blend of 9 inputs, each scored 0–100. Each bar is that input's sub-score; the figure is the points it added to the 100-point composite (weight × sub-score).
- Cash flow +30.0/30.0
- ARV discount +15.0/15.0
- 1% rule +10.0/10.0
- DSCR +10.0/10.0
- Schools +5.5/10.0
- Livability +3.6/5.0
- Rent growth +2.5/5.0
- Condition / age +2.5/5.0
- Appreciation +0.0/10.0
$129,900
🖨 Deal sheet 📄 Offer letter ✓ Due diligence
Listing remarks MLS
Beautiful Ranch! Fabulous Updated Newer Kitchen w/ Quartz Counter tops, large center counter island w/ stools, deep large sink under a window which overlooks nice backyard. Kitchen opens to Formal Dining Room. Large Bright Living Room. 3 Bedrooms, 2 Full Baths. Main Floor Laundry. Large Basement Family Room w/ Fireplace. 1 car attached garage. Wonderful large yard! Solar Lease Agreement Prepaid through the remaining term. Great entertaining home!
Key facts
- Open floor plan
- Attached garage
- Natural light
Tags
Neighborhood map
What this means for you Summary
Snapshot
- This is a 3-bed/2.0-bath single-family listed at $130k.
Deal economics
- At list price, monthly cash flow is $737 ($9k/yr) — positive.
- The deal already cash-flows at list — no discount required.
- Meets the 1% rule at list price ($2k rent vs $130k).
- Recommended offer: $114k (12.0% below list) — sets the bar for market timing.
Location & tenants
- Location reads 71/100 on livability (#383 in NY) — a middle-class / working-renter tenant base. Strengths: housing A+, health & safety A+, crime A; Watch: schools D-, amenities F, commute F.
- Clinton Central School District (suburban): math 57% / reading 71% proficiency, ranked #185 of 590 in NY (top 31%) — acceptable for families but not a draw, mixed tenant base, ~2y average lease; only 17% free/reduced lunch — higher-income household profile.
- Market conditions: 56 active listings in the ZIP; 4 comparable units currently listed for rent nearby; rentals lingering (median 44d on market — plan ~5-8 weeks vacancy on turnover, expect pricing pressure); 100% of comp listings sitting > 30 days — soft ceiling on asking rent; 204 units permitted in Oneida County in 2024 (68 in 5+ unit buildings).
Forward outlook
- Local home prices are declining (-3.0%/yr); year-one equity from $898 of loan paydown is wiped out by about $4k of value loss. Plan a longer hold.
- Oneida County population projected at -12% by 2050 — secular population decline; favor cash flow + early exit over multi-decade hold.
- At projected returns (-3.0% appreciation + 3.0% rent growth), your $36k cash investment doubles in ~5 years — after that, you're playing with house money.
Negotiation context
- It's been on market 153 days — a 12% lower offer ($114k) is reasonable based on typical stale-listing flexibility.
- 3 sale attempts since 6y ago; this cycle's ask has dropped $110k (46%) from the opening price — seller is motivated, your offer sets the floor, not the list.
Risks & watch-outs
- Watch-outs: property tax is 4.4% of price; built in 1955 — expect roof / HVAC / electrical / plumbing capex.
Questions for the listing agent
- It's been on market 153 days. Have you received any prior offers? Is the seller open to a 12% concession, seller financing, or rate buy-down credit?
- Built in 1955 — when were the roof, HVAC, electrical panel, plumbing, and water heater last replaced?
- Property tax is high relative to price — has the assessment been appealed recently, and will the sale trigger a re-assessment?
- Why hasn't it sold? Are there any deal-killer items the seller is aware of (foundation, flood, title, zoning, code violations)?
- Is there a deadline driving the sale (1031 exchange, divorce, estate, relocation)? That informs how much negotiation room exists.
- Schools are D-rated, which usually means shorter tenancies and higher turnover. Who's the typical renter profile here, and what's been the actual vacancy rate?
- What's the average days-on-market for RENTAL listings here right now (not sales)? A rising rental-DOM trend means longer vacancies and softer asking-rent achievability than the comps imply.
- What's the recent tenant-quality profile in this submarket — average credit score on applications, eviction rate, late-payment / NSF rate, and stable-employment percentage? A property-management company in the area should have these aggregated.
- How much new for-sale + rental construction is in the pipeline within 1–3 miles? Heavy new supply typically softens prices + rents 12–24 months out; constrained supply supports both.
Investment metrics
- 1% rule
- 1.90% ✓
- Cap rate
- 13.11%
- Cash-on-cash
- 24.33%
- DSCR
- 2.08
- GRM
- 4.4
CMA / ARV
- ARV (on-the-fly)
- $217,790
- Comps found
- 6
Show comp detail 6 sales within ~0.75 mi
| Address | Dist | Beds/Ba | Sqft | Sold | Price | $/sf | Match |
|---|---|---|---|---|---|---|---|
| 11 White St | 0.46mi | 3/2.0 | 1,488 (-1%) | 17mo | $92,000 | $62 | 63 |
| 7674 E Main St | 0.39mi | 3/2.5 | 1,576 (+5%) | 12mo | $160,000 | $102 | 62 |
| 7846 Clark Mills Rd | 0.18mi | 2/1.0 (-1) | 1,357 (-10%) | 9mo | $235,000 | $173 | 59 |
| 3 Prospect St | 0.55mi | 2/1.5 (-1) | 1,416 (-6%) | 5mo | $205,000 | $145 | 53 |
| 4796 Newman Dr | 0.75mi | 3/1.5 | 1,472 (-2%) | 9mo | $280,000 | $190 | 52 |
| 37 White St | 0.61mi | 4/2.0 (+1) | 1,656 (+10%) | 11mo | $235,000 | $142 | 40 |
Match score weights: distance 35% · size 25% · config 20% · recency 20%. Top-matched comps best support the ARV.
Projected returns pro-forma
-3.0% appreciation · 3.0% rent growth · sell at horizon
- IRR
- 17.8%
- Equity multiple
- 1.72×
- Total profit
- $26,152
- Equity at exit
- $19,369
- IRR
- 26.3%
- Equity multiple
- 3.31×
- Total profit
- $84,199
- Equity at exit
- $11,231
Cash invested: $36,372 (down + closing). Projections, not guarantees.
Landlord ↔ Tenant lean methodology
- Overall (STATE)
- 15 Strongly Tenant-Friendly
- State New York
- 15 Strongly Tenant-Friendly · D+10
- County
- — inherits STATE
- City
- — inherits STATE
ZIP-level market 13492
- Home prices YoY
- -12.3%
- Active inventory
- 56
- Price-to-rent
- 4.4×
Monthly cashflow live
- Estimated rent
- $2,473 medium interval (Pro) →
- Mortgage (P&I)
- −$681
- Tax from tax record
- −$481 /mo · $5,773/yr
- Insurance
- −$54
- HOA
- −$0
- Vacancy / Maint / Mgmt
- −$519
- Net cashflow
- $737
Break-even live
UW: 25.0% down · 7.5% · 30yr · 1.5% tax · 5.0% vac · 8.0% maint · 8.0% mgmt
Financing live
Cash to close
- Down payment
- $32,475
- Closing costs
- $3,897
- Reserves months
- —
- Total cash needed
- —
Loan-product check · same deal, 3 products live
Conventional
25% down · 7.5% · 30yr
- Down + closing
- —
- Monthly P&I
- —
- Monthly cashflow
- —
- DSCR
- —
- Eligible?
- —
Personal DTI + credit; lowest rate.
DSCR
20% down · 8.5% · 30yr
- Down + closing
- —
- Monthly P&I
- —
- Monthly cashflow
- —
- DSCR
- —
- Eligible?
- —
No personal income docs; deal must DSCR.
Hard money
10% down · 12.0% · 12mo
- Down + closing
- —
- Monthly P&I
- —
- Monthly cashflow
- —
- DSCR
- —
- Eligible?
- —
Short-term bridge; refi at stabilization.
Rent comps 4 comps
| Address | Beds | Baths | Sqft | Rent | $/sqft | DOM | Units | Dist |
|---|---|---|---|---|---|---|---|---|
| 105 Pheasants Run Clinton, NY | 2.0 | 1.5 | 1050 | $2,150 | $2.05 | 43d | 1 | 0.94mi |
| 122 Pheasants Run Kirkland, NY | 2.0 | 2.0 | 1200 | $3,100 | $2.58 | 43d | 1 | 1.01mi |
| 135 Pheasants Run Clark Mills, NY | 2.0 | 1.5 | 1100 | $2,350 | $2.14 | 43d | 1 | 1.03mi |
| 130 Pheasants Run Clinton, NY | 2.0 | 1.5 | 1200 | $2,250 | $1.88 | 43d | 1 | 1.08mi |
Listing history 12 events
-
2026-03-21status Pending
-
2026-03-11status Active
-
2026-03-09status Pending
-
2026-02-23price $129,900
-
2026-01-27price $149,900
-
2025-12-29price $204,900
-
2025-11-24price $224,900
-
2025-10-16$239,900 Active
-
2020-10-14soldstatus $180,694
-
2020-10-09soldstatus $180,694 450-char remark
Show marketing remark (450 chars)
Beautiful Ranch! Fabulous Updated Newer Kitchen w/ Quartz Counter tops, large center counter island w/ stools, deep large sink under a window which overlooks nice backyard. Kitchen opens to Formal Dining Room. Large Bright Living Room. 3 Bedrooms, 2 Full Baths. Main Floor Laundry. Large Basement Family Room w/ Fireplace. 1 car attached garage. Wonderful large yard! Solar Lease Agreement Prepaid through the remaining term. Great entertaining home!
-
2020-06-29$169,900 450-char remark
Show marketing remark (450 chars)
Beautiful Ranch! Fabulous Updated Newer Kitchen w/ Quartz Counter tops, large center counter island w/ stools, deep large sink under a window which overlooks nice backyard. Kitchen opens to Formal Dining Room. Large Bright Living Room. 3 Bedrooms, 2 Full Baths. Main Floor Laundry. Large Basement Family Room w/ Fireplace. 1 car attached garage. Wonderful large yard! Solar Lease Agreement Prepaid through the remaining term. Great entertaining home!
-
2006-12-15soldstatus $80,000
ⓘ Source: listings_history table (triggers on properties + properties_extension) + one-shot
backfill from property_details.listing_events for pre-trigger history.
Tax reassessment forecast NY · Partial reset (capped growth)
- Current annual tax
- $5,773 · $481/mo
- Projected year-2 tax
- $5,773 · $481/mo
- Expected delta
- $0/yr ($0/mo · 0.0%)
ⓘ Screening estimate from a state-policy table — verify with the county assessor before closing.
Climate risk First Street
- Flood 1/10 Low FEMA zone X (unshaded) · 0% chance over 30 yrs
- Wildfire 1/10 Low
- Heat 3/10 Moderate 7 d/yr ≥95°F today · 16 d/yr by 30 yrs out
- Wind 1/10 Low 100% chance of damaging wind over 30 yrs
- Air quality 2/10 Low 0 unhealthy d/yr today · 2 by 30 yrs out
Nearby sold comps map
Loading sold comps map…
Walkable amenities ~0.75 mi
Loading nearby amenities…
Taxation est. · year 1
- Rental income
- $29,679
- − Mortgage interest
- −$7,276
- − Property taxes
- −$5,773
- − Insurance
- −$650
- − Repairs & maintenance
- −$2,374
- − Management
- −$2,374
- − Depreciation
- −$3,779
- Taxable income
- $7,452
- Est. tax owed @ 24.0%
- −$1,789
- After-tax cash flow
- $7,061/yr
For passive investors: Depreciation is non-cash, so a rental often shows a tax loss while cash-flowing — sheltering income. Rental losses are passive: they offset passive income freely, and up to $25,000/yr can offset ordinary (W-2) income if you actively participate and your MAGI is under $100k (phasing out to $0 by $150k); unused losses carry forward. On sale, claimed depreciation is recaptured at up to 25%, and gains may owe capital-gains tax (a 1031 exchange can defer both). Figures are a year-1 estimate at your 24.0% rate — not tax advice; consult a CPA.
Schools (NCES district)
- District
- Clinton Central School District
- NCES district ID
- 3607770
- Math proficiency
- 57% ▼ -11.00%
- Reading proficiency
- 71% ▲ 6.00%
- Median HH income
- $57,439
- Composite
- 55.05/100
- National rank
- #1290
- State rank
- #185 of 590 in NY
Livability — Clark Mills
- Score
- 71/100
- State rank
- #383
- US rank
- #6606
Category grades
Schools grade is shown separately in the Schools card above.
Census & demographics
- Census place
- Clark Mills, NY
- City population
- 815
- Population (ZIP)
- 11,233
Population outlook (Oneida County) Hauer SSP2
- Today (2025)
- 225,223 people
- By 2030
- 220,384 · -2.1%
- By 2040
- 209,071 · -7.2%
- By 2050
- 197,920 · -12.1%
- By 2075
- 175,541 · -22.1%
- By 2100
- 148,491 · -34.1%
Race, ethnicity, and origin ACS 2023
- Neighborhood character
- Predominantly White (91%)
- Race & ethnicity
- White 91% Two or more races 4% Hispanic / Latino 3% Black 2%
- Common ancestry
- Romanian 20% Lithuanian 3% Slovak 2%
- Foreign-born
- 3% · Canada
- Languages at home
- 96% English-only · Spanish 2% Other Asian/Pacific 1% Russian/Polish/Slavic 1%
Political lean MEDSL · Oneida
- 2024 margin
- Strong R (+21.3) · D 39.4% · R 60.6%
- 2008→2024 swing
- -15.2pp toward R · 2008: -6.1pp · 2024: -21.3pp
- All cycles
- 2024: R+21.3 2020: R+15.5 2016: R+21.1 2012: R+5.3 2008: R+6.1
Not yet ingested
- Civics
- —
Market trends
- HPI YoY
- ▼ -44.24%
- Current HPI
- 314.4606
- Rent YoY
- —
- Metro
- —
- State GDP YoY
- ▲ 2.60%
- F500 in state
- 92
Industry mix (Fortune 500 HQ in NY)
| Industry | F500 HQs | Revenue |
|---|---|---|
| Financial Services | 10 | $950B |
|
||
| Consumer Goods | 9 | $162B |
|
||
| Insurance | 4 | $225B |
|
||
| Telecommunications | 2 | $144B |
|
||
| Pharmaceuticals | 2 | $112B |
|
||
| Media / Entertainment | 2 | $69B |
|
||
Price history
+62.4% since first listed12 events — show timeline
- 2026-03-21 Pending — UNYREIS
- 2026-03-11 Relisted — UNYREIS
- 2026-03-09 Pending — UNYREIS
- 2026-02-23 Price Changed $129,900 UNYREIS
- 2026-01-27 Price Changed $149,900 UNYREIS
- 2025-12-29 Price Changed $204,900 UNYREIS
- 2025-11-24 Price Changed $224,900 UNYREIS
- 2025-10-16 Listed $239,900 UNYREIS
- 2020-10-14 Sold (Public Records) $180,694 Public Records
- 2020-10-09 Sold (MLS) $180,694 CNYIS
- 2020-06-29 Listed $169,900 CNYIS
- 2006-12-15 Sold (Public Records) $80,000 Public Records
Property tax history
+3.2%/yrLatest (2025): $5,773 · +5.1% YoY. Source: county tax records.
Cash-flow waterfall
monthlySold comps — $/sqft
last 12 mo · ≤1 miLoading sold comps…