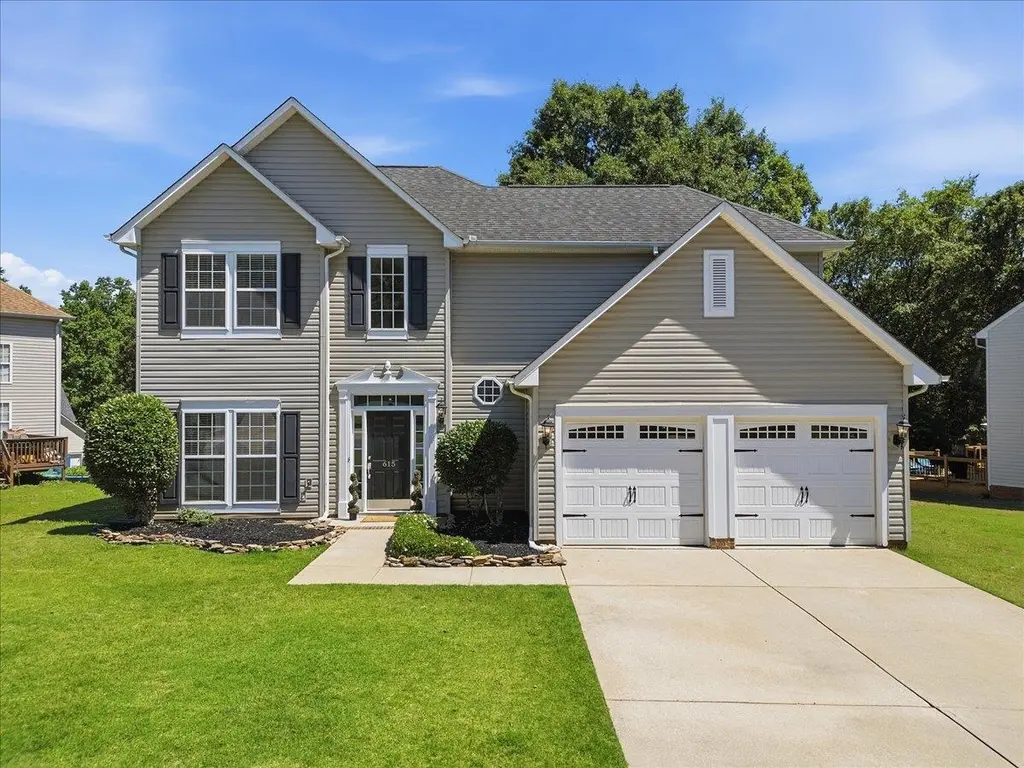
615 Chadwyck Dr · Reidville, SC
Flood risk 1/10 · Minimal
- FEMA flood zone
- X (unshaded)
- Chance of flooding over 30 yrs
- 0.0%
- Est. flood insurance / yr
- $507 – $1,088
Fire risk 4/10 · Minor
- Est. fire insurance / yr
- $783 – $1,453
Heat risk 6/10 · Moderate
- Hot days now (above 105°F)
- 7 days/yr
- Hot days in 30 yrs
- 17 days/yr
Wind risk 2/10 · Minimal
- Chance of severe wind over 30 yrs
- 1.0%
Air-quality risk 4/10 · Minor
- Unhealthy air days now
- 4 days/yr
- Unhealthy air days in 30 yrs
- 5 days/yr
Risk factors via First Street. Map © Google.
Why this score? — see what drove the D+ grade
The composite is a weighted blend of 9 inputs, each scored 0–100. Each bar is that input's sub-score; the figure is the points it added to the 100-point composite (weight × sub-score).
- Cash flow +14.6/30.0
- ARV discount +12.0/15.0
- DSCR +4.5/10.0
- Schools +4.1/10.0
- Livability +4.0/5.0
- 1% rule +3.0/10.0
- Rent growth +2.9/5.0
- Condition / age +2.5/5.0
- Appreciation +0.0/10.0
$290,000
🖨 Deal sheet (PDF) 📄 Offer letter ✓ Due diligence
Listing remarks MLS
Welcome to 615 Chadwyck Drive, located in the highly sought-after Woodsberry community in Duncan, SC! Perfectly positioned on a quiet cul-de-sac street with only a handful of neighboring homes, this property offers one of the most desirable locations within an established neighborhood known for its outstanding amenities and unbeatable convenience. Step inside to discover a bright and inviting floor plan featuring soaring two-story ceilings in the living room, complemented by an abundance of windows that fill the home with natural light. The open-concept design seamlessly connects the living area to the casual dining space and well-appointed kitchen, complete with granite countertops, a center island, and plenty of workspace for everyday living and entertaining. Additionally: the refrigerator, washer and dryer convey with the home! In addition to the casual dining area, the home features a formal dining room that provides the perfect setting for holiday gatherings, dinner parties, and special occasions. A separate formal living room offers incredible flexibility and could easily serve as a home office, study, playroom, or additional sitting area to fit your lifestyle. The spacious primary suite serves as a private retreat, offering two closets, a large soaking tub, separate shower, and private water closet. Two additional bedrooms provide generous closet space and easy access to the secondary full bath. Outside, you’ll find a backyard designed for relaxation and enjoyment, featuring a beautiful shade tree with a charming tire swing and a spacious patio perfect for grilling, outdoor dining, and gathering with family and friends. Woodsberry residents enjoy access to exceptional community amenities, including two neighborhood pools and a playground. Conveniently located just minutes from grocery stores, restaurants, shopping, and Interstate 85, this home combines peaceful neighborhood living with easy access to everything the Upstate has to offer. Don’t miss this opportunity to own a home in one of Duncan’s most desirable neighborhoods!
Key facts
- Two-story ceilings
- Formal dining room
- Quiet cul-de-sac
Tags
Property features AI
Finance
- HOA & community: Homeowners association present; HOA includes pool and street lights; Community amenities include common areas, lights, playground and pool
Exterior
- Parking: Attached garage for 2 cars with door opener; Paved concrete driveway
- Utilities: Public water; Electric water heater; Public sewer; Private garbage pickup; Attached garage (utility note); Electric power/cooling
- Home design: Two-story residential home; Built around 2000; Storage in attic and garage; Slab foundation; Vinyl siding; Architectural roof
- Construction: Built circa 2000; Vinyl siding exterior; Architectural shingle roof; Slab foundation
- Exterior features: Patio; Level lot with some trees; Underground utilities
Interior
- Kitchen: Dishwasher; Disposal; Electric oven; Built-in microwave; Refrigerator; Pantry
- Bedrooms: Primary bedroom on 2nd level with double sinks, full bath, separate shower, garden tub, separate tub, walk-in closet and multiple closets; Second bedroom approximately 11 x 10; Third bedroom approximately 10 x 13; Master bedroom approximately 12 x 15
- Flooring: Carpet; Ceramic tile; Hardwood; Vinyl
- Bathrooms: Two full bathrooms; One half bathroom
- Heating & cooling: Natural gas heating; Electric cooling
- Interior features: Cable available; 9-foot+ ceilings; Ceiling fans; Cathedral/vaulted ceilings; Tray ceilings; Granite countertops; Laminate countertops; Open floor plan; Smoke detector; Garden tub; Pantry closet; Gas log fireplace (1)
- Laundry & utility: Laundry on 2nd floor; Walk-in laundry; Washer connection; Dryer with electric hookup
Neighborhood map
What this means for you Summary
Snapshot
- This is a 3-bed/2.5-bath single-family listed at $290k.
Deal economics
- At list price, monthly cash flow is $71 ($848/yr) — positive.
- The deal already cash-flows at list — no discount required.
- To meet the 1% rule (rent ≥ 1% of price), the offer needs to be $232k (20.1% below list).
- Recommended offer: $232k (20.1% below list) — sets the bar for 1% rule.
- Cap rate 6.6% vs local median 3.8% in Reidville — top-decile yield for the area; either an underpriced asset or a hidden risk that comps aren't pricing in. Stress-test before assuming the spread holds.
Location & tenants
- Location reads 80/100 on livability (#12 in SC, #1,810 nationally) — a professional / high-income tenant draw. Strengths: crime A+, employment A+, housing A+; Watch: amenities F, commute F.
- Spartanburg 05 (suburban): math 45% / reading 51% proficiency, ranked #13 of 80 in SC (top 16%) — families likely to look elsewhere, expect single-tenant / working-renter base with shorter leases.
- Zoned schools: Abner Creek Academy (math 60% / reading 57%, grade B-, #95 of 597 statewide, top 16%, 752 students, 55% FRL); Berry Shoals Intermediate (math 54% / reading 48%, grade C, #36 of 229 statewide, top 16%, 902 students, 56% FRL); James F. Byrnes High (math 31% / reading 75%, grade C-, #140 of 196 statewide, top 72%, 2,217 students, 56% FRL) — zoned schools average 56% FRL vs 39% district-wide (16 pts higher); higher-poverty schools than district average — tighter screening recommended.
- Market conditions: Rents rising (+1.5%/yr); 143 active listings in the ZIP; 4 comparable units currently listed for rent nearby; rentals at typical pace (median 23d on market — plan ~3-4 weeks tenant-placement turnaround); solid renter incomes; 3,129 units permitted in Spartanburg County in 2024 (40 in 5+ unit buildings).
- This rent runs 34% of the median local income ($81k/yr) — at the standard rent-burdened threshold; future hikes will face affordability resistance.
Forward outlook
- Local home prices are declining (-3.0%/yr); year-one equity from $2k of loan paydown is wiped out by about $9k of value loss. Plan a longer hold.
- Spartanburg County population projected at +18% by 2050 — long-run rental-demand tailwind backs the buy-and-hold thesis.
Negotiation context
- It's been on market 16 days — a 2% lower offer ($286k) is reasonable based on typical stale-listing flexibility.
- 5 sale attempts since 18y ago with the ask held roughly flat each time — persistent listings suggest the price (not the market) is what's stuck; bring a comps-based counter.
- Current owner paid $175k; list at $290k implies a 66% gain — meaningful room to come down on a strong offer.
Risks & watch-outs
- Climate carrying-cost: extreme-heat days projected 7→17/yr by 2055 (HVAC capex compounding) — expect insurance premiums to compound above CPI over the hold.
Questions for the listing agent
- What does the HOA fee cover, when was the last increase, and are there any pending special assessments or reserve-fund shortfalls?
- Is there a deadline driving the sale (1031 exchange, divorce, estate, relocation)? That informs how much negotiation room exists.
- Schools are B-rated — typically a magnet for longer-tenancy family renters. What's the average tenant stay here, and is there a school-zone premium baked into asking?
- The area grade is low — what's the realistic commute time and amenity access for the typical tenant pool here? Any planned neighborhood developments (good or bad) we should know about?
- What's the average days-on-market for RENTAL listings here right now (not sales)? A rising rental-DOM trend means longer vacancies and softer asking-rent achievability than the comps imply.
- What's the recent tenant-quality profile in this submarket — average credit score on applications, eviction rate, late-payment / NSF rate, and stable-employment percentage? A property-management company in the area should have these aggregated.
- How much new for-sale + rental construction is in the pipeline within 1–3 miles? Heavy new supply typically softens prices + rents 12–24 months out; constrained supply supports both.
Investment metrics
- 1% rule
- 0.80% ✗
- Cap rate
- 6.59%
- Cash-on-cash
- 1.04%
- DSCR
- 1.05
- GRM
- 10.4
CMA / ARV
- ARV (on-the-fly)
- $322,140
- Comps found
- 12
Show comp detail 12 sales within ~0.75 mi
| Address | Dist | Beds/Ba | Sqft | Sold | Price | $/sf | Match |
|---|---|---|---|---|---|---|---|
| 734 Terrace Creek Dr | 0.19mi | 4/2.5 (+1) | 2,142 (+4%) | 3mo | $315,000 | $147 | 77 |
| 406 Rolling Pines Ln | 0.14mi | 4/2.0 (+1) | 2,023 (-2%) | 10mo | $290,000 | $143 | 74 |
| 701 Terrace Creek Dr | 0.27mi | 4/2.5 (+1) | 2,214 (+7%) | 4mo | $280,000 | $126 | 67 |
| 835 Terrace Creek Dr | 0.08mi | 4/2.5 (+1) | 2,252 (+9%) | 11mo | $313,000 | $139 | 67 |
| 705 Terrace Creek Dr | 0.26mi | 4/2.5 (+1) | 1,835 (-11%) | 0mo | $285,000 | $155 | 64 |
| 814 Terrace Creek Dr | 0.12mi | 4/3.0 (+1) | 2,209 (+7%) | 15mo | $280,000 | $127 | 63 |
| 654 Windward Ln | 0.60mi | 3/2.5 | 2,112 (+2%) | 7mo | $329,900 | $156 | 62 |
| 310 Drizzle Ct | 0.68mi | 3/2.5 | 2,181 (+6%) | 7mo | $410,900 | $188 | 54 |
| 159 Santa Ana Way | 0.73mi | 3/2.5 | 2,180 (+6%) | 4mo | $370,000 | $170 | 53 |
| 226 Silver Lake Rd | 0.74mi | 3/2.0 | 1,989 (-4%) | 11mo | $330,000 | $166 | 48 |
| 267 Santa Ana Way | 0.52mi | 3/2.0 | 2,331 (+13%) | 6mo | $370,000 | $159 | 48 |
| 767 Windward Ln | 0.45mi | 4/2.5 (+1) | 1,831 (-11%) | 15mo | $295,000 | $161 | 42 |
Match score weights: distance 35% · size 25% · config 20% · recency 20%. Top-matched comps best support the ARV.
Projected returns pro-forma
-3.0% appreciation · 1.52% rent growth · sell at horizon
- IRR
- -16.2%
- Equity multiple
- 0.43×
- Total profit
- $-46,008
- Equity at exit
- $43,240
- IRR
- -10.4%
- Equity multiple
- 0.41×
- Total profit
- $-48,279
- Equity at exit
- $25,074
Cash invested: $81,200 (down + closing). Projections, not guarantees.
Landlord ↔ Tenant lean methodology
- Overall (STATE)
- 90 Strongly Landlord-Friendly
- State South Carolina
- 90 Strongly Landlord-Friendly · R+6
- County
- — inherits STATE
- City
- — inherits STATE
ZIP-level market 29334
- Home prices YoY
- -21.7%
- Rents YoY
- 1.5%
- Active inventory
- 143
- Price-to-rent
- 10.4×
Monthly cashflow live
- Estimated rent
- $2,316 medium interval (Pro) →
- Mortgage (P&I)
- −$1,521
- Tax from tax record
- −$102 /mo · $1,218/yr
- Insurance
- −$121
- HOA
- −$16
- Vacancy / Maint / Mgmt
- −$486
- Net cashflow
- $71
Break-even live
Sensitivity live
| Price | -10% $235 | -5% $153 | +0% $71 | +5% $-11 | +10% $-94 |
|---|---|---|---|---|---|
| Rent | -10% $-112 | -5% $-21 | +0% $71 | +5% $162 | +10% $254 |
| Rate | -1.0pp $217 | -0.5pp $144 | base $71 | +0.5pp $-5 | +1.0pp $-81 |
UW: 25.0% down · 7.5% · 30yr · 1.5% tax · 5.0% vac · 8.0% maint · 8.0% mgmt
Financing live
Cash to close
- Down payment
- $72,500
- Closing costs
- $8,700
- Reserves months
- —
- Total cash needed
- —
Loan-product check · same deal, 3 products live
Conventional
25% down · 7.5% · 30yr
- Down + closing
- —
- Monthly P&I
- —
- Monthly cashflow
- —
- DSCR
- —
- Eligible?
- —
Personal DTI + credit; lowest rate.
DSCR
20% down · 8.5% · 30yr
- Down + closing
- —
- Monthly P&I
- —
- Monthly cashflow
- —
- DSCR
- —
- Eligible?
- —
No personal income docs; deal must DSCR.
Hard money
10% down · 12.0% · 12mo
- Down + closing
- —
- Monthly P&I
- —
- Monthly cashflow
- —
- DSCR
- —
- Eligible?
- —
Short-term bridge; refi at stabilization.
Rent comps 4 comps
| Address | Beds | Baths | Sqft | Rent | $/sqft | DOM | Units | Dist |
|---|---|---|---|---|---|---|---|---|
| 921 Saint Elmos Ct Duncan, SC | 3.0 | 2.5 | 2515 | $2,700 | $1.07 | 23d | 1 | 0.44mi |
| 32 Apricot Ln Duncan, SC | 3.0 | 2.5 | 1498 | $1,550 | $1.03 | 23d | 1 | 1.07mi |
| 25 Apricot Ln Duncan, SC | 3.0 | 2.5 | 1549 | $1,750 | $1.13 | 15d | 1 | 1.07mi |
| 939 Squires Pt Duncan, SC | 3.0 | 2.0 | 1900 | $2,295 | $1.21 | 15d | 1 | 1.31mi |
HOA detail
- Monthly dues
- $16 · $192/yr
- Likely covers
- waterpool
Listing history 12 events
-
2026-06-22days on market $290,000 Active 16 DOM
-
2026-06-18days on market $290,000 Active 13 DOM
-
2026-06-17days on market $290,000 Active 12 DOM
-
2026-06-16days on market $290,000 Active 11 DOM
-
2026-06-15days on market $290,000 Active 10 DOM
-
2026-06-14days on market $290,000 Active 8 DOM
-
2026-06-13days on market $290,000 Active 7 DOM
-
2026-06-10days on market $290,000 Active 5 DOM
-
2026-06-09days on market $290,000 Active 4 DOM
-
2026-06-08days on market $290,000 Active 3 DOM
-
2026-06-07remarks 699-char remark
-
2026-06-07$290,000 Active 2 DOM
ⓘ Source: listings_history table (triggers on properties + properties_extension) + one-shot
backfill from property_details.listing_events for pre-trigger history.
Tax reassessment forecast SC · Resets to sale price
- Current annual tax
- $1,218 · $102/mo
- Projected year-2 tax
- $1,653 · $138/mo
- Expected delta
- +$435/yr (+$36/mo · 35.7%)
ⓘ Screening estimate from a state-policy table — verify with the county assessor before closing.
Climate risk First Street
- Flood 1/10 Low FEMA zone X (unshaded) · 0% chance over 30 yrs
- Wildfire 4/10 Moderate
- Heat 6/10 Major 7 d/yr ≥105°F today · 17 d/yr by 30 yrs out
- Wind 2/10 Low 100% chance of damaging wind over 30 yrs
- Air quality 4/10 Moderate 4 unhealthy d/yr today · 5 by 30 yrs out
Nearby sold comps map
Loading sold comps map…
Walkable amenities ~0.75 mi
Loading nearby amenities…
Taxation est. · year 1
- Rental income
- $27,794
- − Mortgage interest
- −$16,245
- − Property taxes
- −$1,218
- − Insurance
- −$1,450
- − Repairs & maintenance
- −$2,224
- − Management
- −$2,224
- − HOA
- −$192
- − Depreciation
- −$8,436
- Taxable loss
- −$4,194
- Est. tax savings @ 24.0%
- +$1,007
- After-tax cash flow
- $1,854/yr
For passive investors: Depreciation is non-cash, so a rental often shows a tax loss while cash-flowing — sheltering income. Rental losses are passive: they offset passive income freely, and up to $25,000/yr can offset ordinary (W-2) income if you actively participate and your MAGI is under $100k (phasing out to $0 by $150k); unused losses carry forward. On sale, claimed depreciation is recaptured at up to 25%, and gains may owe capital-gains tax (a 1031 exchange can defer both). Figures are a year-1 estimate at your 24.0% rate — not tax advice; consult a CPA.
Schools (NCES district)
- District
- Spartanburg 05
- NCES district ID
- 4503600
- Math proficiency
- 45% ▼ -11.00%
- Reading proficiency
- 51% ▬ 0.00%
- Median HH income
- $52,127
- Composite
- 41.31/100
- National rank
- #3512
- State rank
- #13 of 80 in SC
Livability — Reidville
- Score
- 80/100
- State rank
- #12
- US rank
- #1810
Category grades
Schools grade is shown separately in the Schools card above.
Census & demographics
- County
- Spartanburg County · 258,607 people
- City population
- 129
- Metro
- Spartanburg, SC
- Population (ZIP)
- 18,575
- Household income
- $81,413
- Rent vs Own
- Severe rent burden
- 300.0
Population outlook (Spartanburg County) Hauer SSP2
- Today (2025)
- 325,495 people
- By 2030
- 338,800 · +4.1%
- By 2040
- 363,471 · +11.7%
- By 2050
- 384,156 · +18.0%
- By 2075
- 430,137 · +32.1%
- By 2100
- 442,733 · +36.0%
Race, ethnicity, and origin ACS 2023
- Neighborhood character
- Majority White (64%)
- Race & ethnicity
- White 64% Black 22% Hispanic / Latino 9% Two or more races 7% Asian 2%
- Hispanic origin (detail)
- Mexican 6% Cuban 1%
- Common ancestry
- Lithuanian 2% Serbian 1% Italian 1%
- Foreign-born
- 9% · Canada, Jamaica
- Languages at home
- 90% English-only · Spanish 4% Other Indo-European 2% Russian/Polish/Slavic 1%
Political lean MEDSL · Spartanburg
- 2024 margin
- Solid R (+33.6) · D 32.6% · R 66.2% · Other 1.2%
- 2008→2024 swing
- -12.0pp toward R · 2008: -21.6pp · 2024: -33.6pp
- All cycles
- 2024: R+33.6 2020: R+27.3 2016: R+30.0 2012: R+23.1 2008: R+21.6
Not yet ingested
- Civics
- —
Market trends
- HPI YoY
- ▼ -63.74%
- Current HPI
- 230.2483
- Rent YoY
- ▲ 1.52%
- Metro
- Spartanburg, SC
- State GDP YoY
- ▲ 4.51%
- F500 in state
- 2
Industry mix (Fortune 500 HQ in SC)
| Industry | F500 HQs | Revenue |
|---|---|---|
| Packaging | 1 | $7B |
|
||
Price history
+126.7% since first listed12 events — show timeline
- 2026-06-04 Listed $290,000 SPMLS
- 2026-06-04 Listed $290,000 Greater Greenville MLS
- 2017-02-01 Sold (Public Records) $175,000 Public Records
- 2017-01-30 Sold (MLS) $175,000 Greater Greenville MLS
- 2017-01-30 Sold (MLS) $175,000 SPMLS
- 2016-12-14 Contingent — Greater Greenville MLS
- 2016-12-06 Price Changed $179,900 Greater Greenville MLS
- 2016-10-22 Price Changed $184,900 Greater Greenville MLS
- 2016-10-22 Listed $184,000 Greater Greenville MLS
- 2016-10-21 Listed $179,900 SPMLS
- 2009-04-28 Sold (MLS) $128,000 SPMLS
- 2008-11-14 Listed $127,900 SPMLS
Property tax history
+4.6%/yrLatest (2025): $1,218 · +0.8% YoY. Source: county tax records.
Cash-flow waterfall
monthlySold comps — $/sqft
last 12 mo · ≤1 miLoading sold comps…