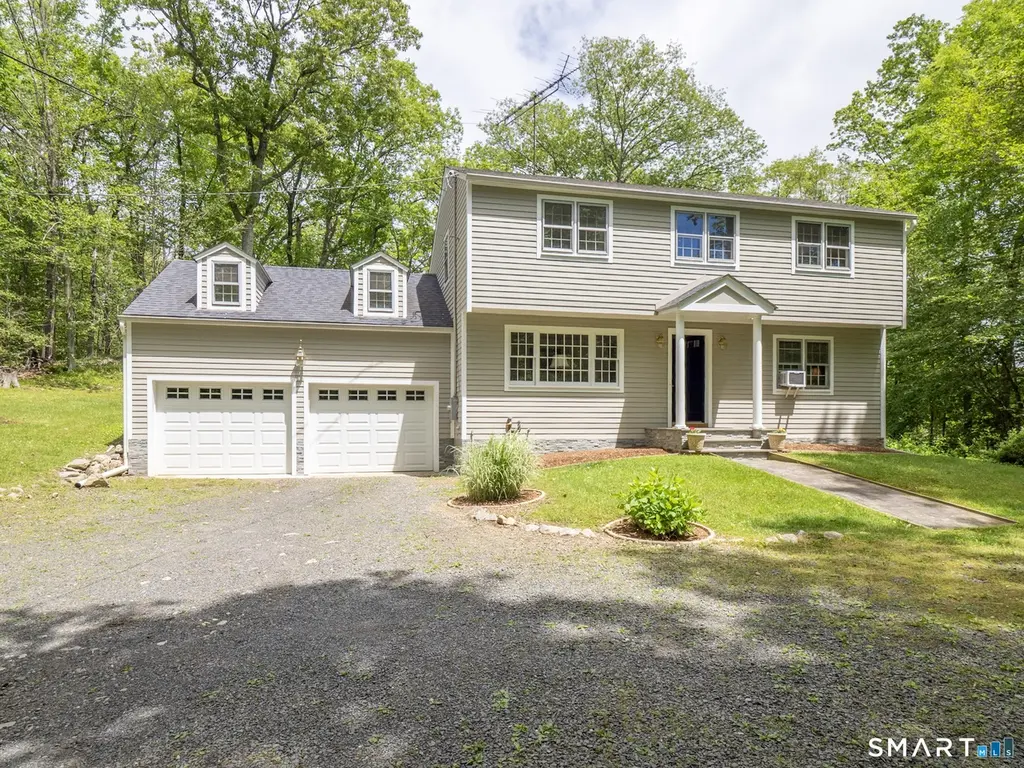
34 Powder Horn Hill Rd · Wilton Center, CT
Flood risk 1/10 · Minimal
- FEMA flood zone
- X (unshaded)
- Chance of flooding over 30 yrs
- 0.0%
- Est. flood insurance / yr
- $507 – $1,088
Fire risk 3/10 · Minor
- Est. fire insurance / yr
- $829 – $1,539
Heat risk 5/10 · Moderate
- Hot days now (above 99°F)
- 7 days/yr
- Hot days in 30 yrs
- 16 days/yr
Wind risk 6/10 · Moderate
- Chance of severe wind over 30 yrs
- 27.0%
Air-quality risk 4/10 · Minor
- Unhealthy air days now
- 3 days/yr
- Unhealthy air days in 30 yrs
- 5 days/yr
Risk factors via First Street. Map © Google.
Why this score? — see what drove the F grade
The composite is a weighted blend of 9 inputs, each scored 0–100. Each bar is that input's sub-score; the figure is the points it added to the 100-point composite (weight × sub-score).
- Cash flow +10.3/30.0
- Schools +7.0/10.0
- Livability +4.1/5.0
- 1% rule +3.2/10.0
- DSCR +2.9/10.0
- Rent growth +2.5/5.0
- Condition / age +2.5/5.0
- ARV discount +0.0/15.0
- Appreciation +0.0/10.0
$878,000
🖨 Deal sheet (PDF) 📄 Offer letter ✓ Due diligence
Listing remarks MLS
.
Key facts
- Large dining room
- Light filled home
- Private office
Tags
Property features AI
Exterior
- Parking: Attached 2-car garage
- Utilities: Private well water; Septic system
- Home design: Single-family home
- Construction: Frame construction; Concrete foundation; Asphalt shingle roof
- Exterior features: Lightly wooded, sloping lot; Clapboard siding; Radon mitigation air system
Interior
- Kitchen: Electric range; Refrigerator; Freezer; Dishwasher
- Bedrooms: 4 bedrooms
- Bathrooms: 2 full bathrooms; 1 half bathroom
- Heating & cooling: Hot water heating (oil); Fuel tank located in basement
- Interior features: Full basement; One fireplace; 8 total rooms
- Laundry & utility: Washer; Dryer; Laundry on lower level; Oil-fired domestic hot water
Neighborhood map
What this means for you Summary
Snapshot
- This is a 4-bed/2.5-bath single-family listed at $878k.
Deal economics
- At list price, monthly cash flow is $-486 ($-6k/yr) — negative.
- To cash-flow at today's rent, offer at most $792k (9.8% below list).
- To meet the 1% rule (rent ≥ 1% of price), the offer needs to be $719k (18.1% below list).
- Recommended offer: $719k (18.1% below list) — sets the bar for 1% rule.
- Cap rate 5.6% vs local median 1.5% in Wilton Center — top-decile yield for the area; either an underpriced asset or a hidden risk that comps aren't pricing in. Stress-test before assuming the spread holds.
Location & tenants
- Location reads 82/100 on livability (#9 in CT, #1,094 nationally) — a professional / high-income tenant draw. Strengths: crime A+, commute A+, employment A+; Watch: amenities F, cost of living F.
- Wilton School District (suburban): math 65% / reading 76% proficiency, ranked #7 of 153 in CT (top 5%) — strong family-tenant draw, lease renewals of 3-5y typical; only 2% free/reduced lunch — higher-income household profile.
- Zoned schools: Miller-Driscoll School (842 students, 4% FRL); Wilton High School (math 70% / reading 92%, grade A, #5 of 194 statewide, top 2%, 1,231 students, 8% FRL) — zoned schools at 6% FRL track the district average.
- Market conditions: 108 active listings in the ZIP; 3 comparable units currently listed for rent nearby; rentals leasing fast (median 4d on market — plan ~1-2 weeks tenant-placement turnaround); high-income renter base; 1,151 units permitted in Western Connecticut Planning Region in 2024 (714 in 5+ unit buildings).
- This rent runs 36% of the median local income ($242k/yr) — at the standard rent-burdened threshold; future hikes will face affordability resistance.
Forward outlook
- Local home prices are declining (-3.0%/yr); year-one equity from $6k of loan paydown is wiped out by about $26k of value loss. Plan a longer hold.
Negotiation context
- Only 10 days on market — expect competitive offers; lowballing is unlikely to land.
- 3 sale attempts since 26y ago with the ask held roughly flat each time — persistent listings suggest the price (not the market) is what's stuck; bring a comps-based counter.
- Current owner paid $375k; list at $878k implies a 134% gain — meaningful room to come down on a strong offer.
Risks & watch-outs
- Climate carrying-cost: major wind risk, 27% chance of damaging wind over 30y; extreme-heat days projected 7→16/yr by 2055 (HVAC capex compounding) — expect insurance premiums to compound above CPI over the hold.
Questions for the listing agent
- What do current leases actually rent for vs. the listed asking? Can we see a recent rent roll and the last 12 months of T-12 income?
- Built in 1961 — when were the roof, HVAC, electrical panel, plumbing, and water heater last replaced?
- Is there a deadline driving the sale (1031 exchange, divorce, estate, relocation)? That informs how much negotiation room exists.
- Schools are B-rated — typically a magnet for longer-tenancy family renters. What's the average tenant stay here, and is there a school-zone premium baked into asking?
- The area grade is low — what's the realistic commute time and amenity access for the typical tenant pool here? Any planned neighborhood developments (good or bad) we should know about?
- What's the average days-on-market for RENTAL listings here right now (not sales)? A rising rental-DOM trend means longer vacancies and softer asking-rent achievability than the comps imply.
- What's the recent tenant-quality profile in this submarket — average credit score on applications, eviction rate, late-payment / NSF rate, and stable-employment percentage? A property-management company in the area should have these aggregated.
- How much new for-sale + rental construction is in the pipeline within 1–3 miles? Heavy new supply typically softens prices + rents 12–24 months out; constrained supply supports both.
Investment metrics
- 1% rule
- 0.82% ✗
- Cap rate
- 5.63%
- Cash-on-cash
- -2.37%
- DSCR
- 0.89
- GRM
- 10.2
CMA / ARV
- ARV (on-the-fly)
- $653,058
- Comps found
- 3
Show comp detail 3 sales within ~0.75 mi
| Address | Dist | Beds/Ba | Sqft | Sold | Price | $/sf | Match |
|---|---|---|---|---|---|---|---|
| 21 Old Hwy | 0.46mi | 3/2.0 (-1) | 1,517 (+2%) | 2mo | $665,000 | $438 | 67 |
| 14 Fairfax Ave | 0.49mi | 3/2.0 (-1) | 1,706 (+14%) | 18mo | $735,000 | $431 | 31 |
| 11 Deerfield Rd | 0.62mi | 3/2.0 (-1) | 1,326 (-11%) | 23mo | $614,000 | $463 | 26 |
Match score weights: distance 35% · size 25% · config 20% · recency 20%. Top-matched comps best support the ARV.
Projected returns pro-forma
-3.0% appreciation · 3.0% rent growth · sell at horizon
- IRR
- -20.2%
- Equity multiple
- 0.30×
- Total profit
- $-173,060
- Equity at exit
- $130,913
- IRR
- -13.2%
- Equity multiple
- 0.23×
- Total profit
- $-189,869
- Equity at exit
- $75,913
Cash invested: $245,840 (down + closing). Projections, not guarantees.
Landlord ↔ Tenant lean methodology
- Overall (STATE)
- 27 Tenant-Leaning
- State Connecticut
- 27 Tenant-Leaning · D+7
- County
- — inherits STATE
- City
- — inherits STATE
ZIP-level market 06897
- Active inventory
- 108
- Price-to-rent
- 10.2×
Monthly cashflow live
- Estimated rent
- $7,192 medium interval (Pro) →
- Mortgage (P&I)
- −$4,604
- Tax from tax record
- −$1,197 /mo · $14,366/yr
- Insurance
- −$366
- HOA
- −$0
- Vacancy / Maint / Mgmt
- −$1,510
- Net cashflow
- $-486
Break-even live
Sensitivity live
| Price | -10% $11 | -5% $-238 | +0% $-486 | +5% $-735 | +10% $-983 |
|---|---|---|---|---|---|
| Rent | -10% $-1,054 | -5% $-770 | +0% $-486 | +5% $-202 | +10% $82 |
| Rate | -1.0pp $-44 | -0.5pp $-263 | base $-486 | +0.5pp $-714 | +1.0pp $-945 |
UW: 25.0% down · 7.5% · 30yr · 1.5% tax · 5.0% vac · 8.0% maint · 8.0% mgmt
Financing live
Cash to close
- Down payment
- $219,500
- Closing costs
- $26,340
- Reserves months
- —
- Total cash needed
- —
Loan-product check · same deal, 3 products live
Conventional
25% down · 7.5% · 30yr
- Down + closing
- —
- Monthly P&I
- —
- Monthly cashflow
- —
- DSCR
- —
- Eligible?
- —
Personal DTI + credit; lowest rate.
DSCR
20% down · 8.5% · 30yr
- Down + closing
- —
- Monthly P&I
- —
- Monthly cashflow
- —
- DSCR
- —
- Eligible?
- —
No personal income docs; deal must DSCR.
Hard money
10% down · 12.0% · 12mo
- Down + closing
- —
- Monthly P&I
- —
- Monthly cashflow
- —
- DSCR
- —
- Eligible?
- —
Short-term bridge; refi at stabilization.
Rent comps 3 comps
| Address | Beds | Baths | Sqft | Rent | $/sqft | DOM | Units | Dist |
|---|---|---|---|---|---|---|---|---|
| 22 Hubbard Rd Wilton, CT | 1.0–3.0 | 1.0–3.0 | 1597 | $10,030 | $6.28 | 3d | 10 | 0.65mi |
| 25 River Rd Wilton, CT | 2.0–3.0 | 2.0 | 1498 | $6,305 | $4.21 | 3d | 11 | 0.85mi |
| 22 Horseshoe Rd Wilton, CT | 3.0 | 1.5 | 1391 | $4,250 | $3.06 | 44d | 1 | 1.05mi |
Listing history 8 events
-
2026-06-21days on market $878,000 Active 10 DOM
-
2026-06-18days on market $878,000 Active 7 DOM
-
2026-06-17days on market $878,000 Active 6 DOM
-
2026-06-16days on market $878,000 Active 5 DOM
-
2026-06-15days on market $878,000 Active 4 DOM
-
2026-06-13days on market $878,000 Active 2 DOM
-
2026-06-13remarks 699-char remark
-
2026-06-13$878,000 Active 1 DOM
ⓘ Source: listings_history table (triggers on properties + properties_extension) + one-shot
backfill from property_details.listing_events for pre-trigger history.
Tax reassessment forecast CT · Partial reset (capped growth)
- Current annual tax
- $14,366 · $1,197/mo
- Projected year-2 tax
- $16,578 · $1,381/mo
- Expected delta
- +$2,212/yr (+$184/mo · 15.4%)
ⓘ Screening estimate from a state-policy table — verify with the county assessor before closing.
Climate risk First Street
- Flood 1/10 Low FEMA zone X (unshaded) · 0% chance over 30 yrs
- Wildfire 3/10 Moderate
- Heat 5/10 Major 7 d/yr ≥99°F today · 16 d/yr by 30 yrs out
- Wind 6/10 Major 27% chance of damaging wind over 30 yrs
- Air quality 4/10 Moderate 3 unhealthy d/yr today · 5 by 30 yrs out
Nearby sold comps map
Loading sold comps map…
Walkable amenities ~0.75 mi
Loading nearby amenities…
Taxation est. · year 1
- Rental income
- $86,298
- − Mortgage interest
- −$49,182
- − Property taxes
- −$14,366
- − Insurance
- −$4,390
- − Repairs & maintenance
- −$6,904
- − Management
- −$6,904
- − Depreciation
- −$25,542
- Taxable loss
- −$20,989
- Est. tax savings @ 24.0%
- +$5,037
- After-tax cash flow
- $-795/yr
For passive investors: Depreciation is non-cash, so a rental often shows a tax loss while cash-flowing — sheltering income. Rental losses are passive: they offset passive income freely, and up to $25,000/yr can offset ordinary (W-2) income if you actively participate and your MAGI is under $100k (phasing out to $0 by $150k); unused losses carry forward. On sale, claimed depreciation is recaptured at up to 25%, and gains may owe capital-gains tax (a 1031 exchange can defer both). Figures are a year-1 estimate at your 24.0% rate — not tax advice; consult a CPA.
Schools (NCES district)
- District
- Wilton School District
- NCES district ID
- 0905130
- Math proficiency
- 65% ▼ -10.00%
- Reading proficiency
- 76% ▼ -7.00%
- Median HH income
- $161,504
- Composite
- 70.4/100
- National rank
- #267
- State rank
- #7 of 153 in CT
Livability — Wilton Center
- Score
- 82/100
- State rank
- #9
- US rank
- #1094
Category grades
Schools grade is shown separately in the Schools card above.
Census & demographics
- Census place
- Wilton Center, CT
- County
- Fairfield County · 765,532 people
- Metro
- Bridgeport-Stamford-Norwalk, CT
- Population (ZIP)
- 18,777
- Household income
- $242,199
- Rent vs Own
- Severe rent burden
- 264.0
Population outlook (Western Connecticut County) Hauer SSP2
- By 2040
- 685,031
Race, ethnicity, and origin ACS 2023
- Neighborhood character
- Predominantly White (75%)
- Race & ethnicity
- White 75% Two or more races 11% Hispanic / Latino 6% Asian 6% Black 4%
- Hispanic origin (detail)
- Common ancestry
- Romanian 6% Scotch-Irish 3% Slovak 2%
- Foreign-born
- 17% · Canada, China, Jamaica
- Languages at home
- 83% English-only · Other Indo-European 6% Spanish 3% French/Haitian/Cajun 2%
Political lean MEDSL · Western Connecticut
- 2024 margin
- D (+19.1) · D 58.8% · R 39.7% · Other 1.6%
- All cycles
- 2024: D+19.1
Not yet ingested
- Civics
- —
Market trends
- HPI YoY
- ▼ -439.88%
- Current HPI
- 215.5175
- Rent YoY
- —
- Metro
- Bridgeport-Stamford-Norwalk, CT
- State GDP YoY
- ▲ 1.06%
- F500 in state
- 38
Industry mix (Fortune 500 HQ in CT)
| Industry | F500 HQs | Revenue |
|---|---|---|
| Industrial Machinery | 4 | $38B |
|
||
| Insurance | 3 | $71B |
|
||
| Financial Services | 2 | $25B |
|
||
| Transportation / Logistics | 2 | $18B |
|
||
| Healthcare | 1 | $247B |
|
||
| Telecommunications | 1 | $55B |
|
||
Price history
+1556.6% since first listed9 events — show timeline
- 2026-06-12 Listed $878,000 Smart MLS
- 2025-09-17 Listing Removed — Smart MLS
- 2025-08-18 Contingent — Smart MLS
- 2025-05-30 Listed $828,000 Smart MLS
- 2025-05-28 Coming Soon — Smart MLS
- 2000-11-13 Sold (Public Records) $375,000 Public Records
- 2000-11-10 Sold (MLS) $375,000 Smart MLS
- 2000-07-17 Listed $425,000 Smart MLS
- 1971-06-30 Sold (Public Records) $53,000 Public Records
Property tax history
+4.0%/yrLatest (2023): $14,366 · +29.4% YoY. Source: county tax records.
Cash-flow waterfall
monthlySold comps — $/sqft
last 12 mo · ≤1 miLoading sold comps…