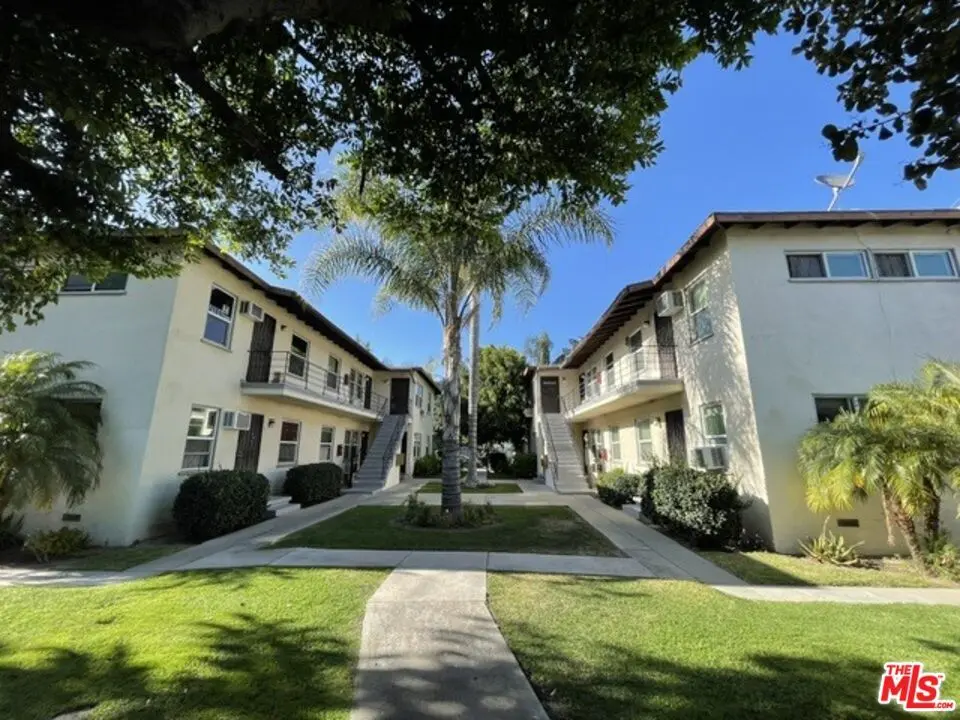
 12-Plex
15246 - 15250 Acre St · Los Angeles, CA
Flood risk 5/10 · Moderate
- FEMA flood zone
- X (unshaded)
- Chance of flooding over 30 yrs
- 0.58%
- Est. flood insurance / yr
- $507 – $1,088
Fire risk 1/10 · Minimal
- Est. fire insurance / yr
- $659 – $1,223
Heat risk 6/10 · Moderate
- Hot days now (above 98°F)
- 7 days/yr
- Hot days in 30 yrs
- 21 days/yr
Wind risk 1/10 · Minimal
- Chance of severe wind over 30 yrs
- —
Air-quality risk 5/10 · Moderate
- Unhealthy air days now
- 7 days/yr
- Unhealthy air days in 30 yrs
- 8 days/yr
Risk factors via First Street. Map © Google.
Why this score? — see what drove the B- grade
The composite is a weighted blend of 9 inputs, each scored 0–100. Each bar is that input's sub-score; the figure is the points it added to the 100-point composite (weight × sub-score).
- Cash flow +30.0/30.0
- 1% rule +10.0/10.0
- DSCR +10.0/10.0
- ARV discount +7.5/15.0
- Schools +3.6/10.0
- Livability +3.4/5.0
- Rent growth +2.6/5.0
- Condition / age +2.5/5.0
- Appreciation +0.0/10.0
$2,195,000
🖨 Deal sheet (PDF) 📄 Offer letter ✓ Due diligence
Multi-family units
County records classify this as Multi-Family (5+ Unit). Listing-text estimate: 12 units. confirmed
5+ unit building — per-unit beds/baths from public records are typically unavailable; the breakdown below (if shown) is an estimate from the listing text.
Listing remarks
Gorgeous pride of ownership 12 unit apartment complex with prime location across from park & close to freeway commute, schools, shopping & entertainment. Gated. Consists of 2 buildings, 6 units in each, courtyard, community laundry & assigned parking located in rear with alley access. Excellent unit mix (4) 2+1 and (8) 1+1. Long term tenants, low turn over. Tremendous upside. Newly upgraded electrical & panels, roof & lush landscaping. Large lot. Each building has its own apn & address. 15246 Acre (apn: 2654-010-003) & 15250 Acre (2654-010-002) Fantastic ad value opportunity!
Key facts
- Community laundry
- Assigned parking
- Courtyard
Tags
Property features AI
Finance
- Financial info: Gross operating income approximately $168,336; Net operating income approximately $101,378; Total annual expenses approximately $66,958; Cap rate around 4.62%; Gross rent multiplier about 13.04; Vacancy rate 5%; Sample unit rent: Actual $14,028 / month aggregate for unit type; projected rent $22,000 (per period indicated in records); Typical unit rent listed at $1,169 for like units (12 units)
- HOA & community: 12-unit complex
Exterior
- Parking: Carport detached; 12 covered parking spaces (12 total spaces)
- Utilities: Owner pays water and other utilities; Tenants pay gas, electric, and cable TV
- Home design: Residential income property; Two levels (2-story total)
- Construction: Zoning: LAR3
- Exterior features: Courtyard and green belt views; Other on-site structures
Interior
- Kitchen: Range/oven; Hood fan; Built-in features
- Bedrooms: Total of 16 bedrooms across units
- Bathrooms: Total of 12 bathrooms across units
- Heating & cooling: Wall heat; Wall/window air conditioning units
- Interior features: Built-in cabinetry and range/oven; Hood fan; Wall/window cooling units; Wall heating
- Laundry & utility: Community laundry
Neighborhood map
What this means for you Summary
Snapshot
- This is a 12 × 16-bed/12.0-bath units multifamily listed at $2.19M.
Deal economics
- At list price, monthly cash flow is $17k ($210k/yr) — positive. Per door: $1k/mo.
- The deal already cash-flows at list — no discount required.
- Meets the 1% rule at list price ($39k rent vs $2.19M).
- Recommended offer: $2.16M (1.5% below list) — sets the bar for market timing.
- Cap rate 15.9% vs local median 2.1% in Los Angeles — top-decile yield for the area; either an underpriced asset or a hidden risk that comps aren't pricing in. Stress-test before assuming the spread holds.
Location & tenants
- Location reads 68/100 on livability (#273 in CA) — a middle-class / working-renter tenant base. Strengths: amenities A+, commute A+, employment B; Watch: health & safety C-, schools D+, crime F.
- Los Angeles Unified (urban): math 29% / reading 54% proficiency, ranked #223 of 517 in CA (top 43%) — families likely to look elsewhere, expect single-tenant / working-renter base with shorter leases; 67% free/reduced lunch — lower-income household profile, screen leases tightly.
- Market conditions: Rents flat; 105 active listings in the ZIP; solid renter incomes; 19,697 units permitted in Los Angeles County in 2024 (9,426 in 5+ unit buildings).
- At $38,918/mo this rent would consume 574% of the median local household income ($81k/yr) (locally 3736% of renters already pay >50% of income on rent) — very limited rent-growth headroom before tenants either downsize or default.
Forward outlook
- Local home prices are declining (-3.0%/yr); year-one equity from $15k of loan paydown is wiped out by about $66k of value loss. Plan a longer hold.
- Los Angeles County population projected at +9% by 2050 — modest demand growth; plan on rents tracking national, not racing it.
- At projected returns (-3.0% appreciation + 0.5% rent growth), your $615k cash investment doubles in ~4 years — after that, you're playing with house money.
Negotiation context
- It's been on market 17 days — a 2% lower offer ($2.16M) is reasonable based on typical stale-listing flexibility.
Risks & watch-outs
- Watch-outs: built in 1957 — expect roof / HVAC / electrical / plumbing capex.
- Climate carrying-cost: moderate flood risk; extreme-heat days projected 7→21/yr by 2055 (HVAC capex compounding) — expect insurance premiums to compound above CPI over the hold.
Questions for the listing agent
- Can we see the unit-by-unit rent roll, current vacancy, and any below-market leases? What's the average tenancy length?
- What capital expenditures (roof, boiler, parking lot, exteriors) have been made in the last 5 years, and what's planned in the next 2?
- Built in 1957 — when were the roof, HVAC, electrical panel, plumbing, and water heater last replaced?
- Is there a deadline driving the sale (1031 exchange, divorce, estate, relocation)? That informs how much negotiation room exists.
- Schools are D-rated, which usually means shorter tenancies and higher turnover. Who's the typical renter profile here, and what's been the actual vacancy rate?
- Crime grade is F in this area — have there been break-ins, vandalism, or insurance claims at this property in the last 3 years? What carrier currently insures it and at what premium?
- What's the average days-on-market for RENTAL listings here right now (not sales)? A rising rental-DOM trend means longer vacancies and softer asking-rent achievability than the comps imply.
- What's the recent tenant-quality profile in this submarket — average credit score on applications, eviction rate, late-payment / NSF rate, and stable-employment percentage? A property-management company in the area should have these aggregated.
- How much new apartment / multifamily construction is in the pipeline within 1–3 miles? Heavy new supply (>2% of stock underway) typically softens rents 12–24 months out; light construction supports rent growth.
Investment metrics
- 1% rule
- 1.77% ✓
- Cap rate
- 15.85%
- Cash-on-cash
- 34.14%
- DSCR
- 2.52
- GRM
- 4.7
CMA / ARV
No comps found within radius.
Projected returns pro-forma
-3.0% appreciation · 0.51% rent growth · sell at horizon
- IRR
- 26.8%
- Equity multiple
- 2.08×
- Total profit
- $662,225
- Equity at exit
- $327,282
- IRR
- 32.9%
- Equity multiple
- 3.66×
- Total profit
- $1,636,853
- Equity at exit
- $189,783
Cash invested: $614,600 (down + closing). Projections, not guarantees.
Landlord ↔ Tenant lean methodology
- Overall (CITY)
- 0 Strongly Tenant-Friendly
- State California
- 18 Strongly Tenant-Friendly · D+13
- County
- — inherits STATE
- City Los Angeles
- 0 Strongly Tenant-Friendly · D+22
ZIP-level market 91343
- Rents YoY
- 0.5%
- Active inventory
- 105
- Price-to-rent
- 56.4×
Monthly cashflow live
- Estimated rent
- $38,918 medium interval (Pro) →
- Mortgage (P&I)
- −$11,511
- Tax from tax record
- −$835 /mo · $10,016/yr
- Insurance
- −$915
- HOA
- −$0
- Vacancy / Maint / Mgmt
- −$8,173
- Net cashflow
- $17,485
Break-even live
Sensitivity live
| Price | -10% $18,728 | -5% $18,106 | +0% $17,485 | +5% $16,864 | +10% $16,243 |
|---|---|---|---|---|---|
| Rent | -10% $14,411 | -5% $15,948 | +0% $17,485 | +5% $19,022 | +10% $20,560 |
| Rate | -1.0pp $18,591 | -0.5pp $18,043 | base $17,485 | +0.5pp $16,916 | +1.0pp $16,338 |
12-unit breakdown (identical units grouped — click to expand)
| Units | Beds | Baths | Est. rent |
|---|---|---|---|
| 12× units | 16 | 12 | $38,916 |
| #1 | 16 | 12 | $3,243 |
| #2 | 16 | 12 | $3,243 |
| #3 | 16 | 12 | $3,243 |
| #4 | 16 | 12 | $3,243 |
| #5 | 16 | 12 | $3,243 |
| #6 | 16 | 12 | $3,243 |
| #7 | 16 | 12 | $3,243 |
| #8 | 16 | 12 | $3,243 |
| #9 | 16 | 12 | $3,243 |
| #10 | 16 | 12 | $3,243 |
| #11 | 16 | 12 | $3,243 |
| #12 | 16 | 12 | $3,243 |
| Total (12 units) | $38,918 | ||
UW: 25.0% down · 7.5% · 30yr · 1.5% tax · 5.0% vac · 8.0% maint · 8.0% mgmt
Financing live
Cash to close
- Down payment
- $548,750
- Closing costs
- $65,850
- Reserves months
- —
- Total cash needed
- —
Loan-product check · same deal, 3 products live
Conventional
25% down · 7.5% · 30yr
- Down + closing
- —
- Monthly P&I
- —
- Monthly cashflow
- —
- DSCR
- —
- Eligible?
- —
Personal DTI + credit; lowest rate.
DSCR
20% down · 8.5% · 30yr
- Down + closing
- —
- Monthly P&I
- —
- Monthly cashflow
- —
- DSCR
- —
- Eligible?
- —
No personal income docs; deal must DSCR.
Hard money
10% down · 12.0% · 12mo
- Down + closing
- —
- Monthly P&I
- —
- Monthly cashflow
- —
- DSCR
- —
- Eligible?
- —
Short-term bridge; refi at stabilization.
Listing history 10 events
-
2026-06-21days on market $2,195,000 Active 17 DOM
-
2026-06-18days on market $2,195,000 Active 14 DOM
-
2026-06-17days on market $2,195,000 Active 13 DOM
-
2026-06-16days on market $2,195,000 Active 12 DOM
-
2026-06-15days on market $2,195,000 Active 11 DOM
-
2026-06-13days on market $2,195,000 Active 9 DOM
-
2026-06-09days on market $2,195,000 Active 5 DOM
-
2026-06-08days on market $2,195,000 Active 4 DOM
-
2026-06-07remarks 596-char remark
-
2026-06-07$2,195,000 Active 3 DOM
ⓘ Source: listings_history table (triggers on properties + properties_extension) + one-shot
backfill from property_details.listing_events for pre-trigger history.
Tax reassessment forecast CA · Resets to sale price
- Current annual tax
- $10,016 · $835/mo
- Projected year-2 tax
- $16,682 · $1,390/mo
- Expected delta
- +$6,666/yr (+$555/mo · 66.5%)
ⓘ Screening estimate from a state-policy table — verify with the county assessor before closing.
Climate risk First Street
- Flood 5/10 Major FEMA zone X (unshaded) · 58% chance over 30 yrs
- Wildfire 1/10 Low
- Heat 6/10 Major 7 d/yr ≥98°F today · 21 d/yr by 30 yrs out
- Wind 1/10 Low
- Air quality 5/10 Major 7 unhealthy d/yr today · 8 by 30 yrs out
Nearby sold comps map
Loading sold comps map…
Walkable amenities ~0.75 mi
Loading nearby amenities…
Taxation est. · year 1
- Rental income
- $467,016
- − Mortgage interest
- −$122,954
- − Property taxes
- −$10,016
- − Insurance
- −$10,975
- − Repairs & maintenance
- −$37,361
- − Management
- −$37,361
- − Depreciation
- −$63,855
- Taxable income
- $184,493
- Est. tax owed @ 24.0%
- −$44,278
- After-tax cash flow
- $165,543/yr
For passive investors: Depreciation is non-cash, so a rental often shows a tax loss while cash-flowing — sheltering income. Rental losses are passive: they offset passive income freely, and up to $25,000/yr can offset ordinary (W-2) income if you actively participate and your MAGI is under $100k (phasing out to $0 by $150k); unused losses carry forward. On sale, claimed depreciation is recaptured at up to 25%, and gains may owe capital-gains tax (a 1031 exchange can defer both). Figures are a year-1 estimate at your 24.0% rate — not tax advice; consult a CPA.
Schools (NCES district)
- District
- Los Angeles Unified
- NCES district ID
- 0622710
- Math proficiency
- 29% ▼ -4.00%
- Reading proficiency
- 54% ▲ 10.00%
- Median HH income
- $50,403
- Composite
- 35.67/100
- National rank
- #4875
- State rank
- #223 of 517 in CA
Livability — Los Angeles
- Score
- 68/100
- State rank
- #273
- US rank
- #9237
Category grades
Schools grade is shown separately in the Schools card above.
Census & demographics
- Census place
- Los Angeles, CA
- County
- Los Angeles County · 9,444,647 people
- City population
- 3,838,149
- Metro
- Los Angeles-Long Beach-Anaheim, CA
- Population (ZIP)
- 60,783
- Household income
- $81,430
- Rent vs Own
- Severe rent burden
- 3736.0
Population outlook (Los Angeles County) Hauer SSP2
- Today (2025)
- 10,940,515 people
- By 2030
- 11,256,481 · +2.9%
- By 2040
- 11,729,929 · +7.2%
- By 2050
- 11,948,407 · +9.2%
- By 2075
- 11,818,114 · +8.0%
- By 2100
- 10,842,928 · -0.9%
Race, ethnicity, and origin ACS 2023
- Neighborhood character
- Diverse neighborhood (Simpson 0.60)
- Race & ethnicity
- Hispanic / Latino 58% White 20% Two or more races 17% Asian 14% Black 4% Native American 1%
- Hispanic origin (detail)
- Mexican 35%
- Common ancestry
- Lithuanian 1% Scotch-Irish 1% Romanian 1%
- Foreign-born
- 42% · Canada, South Korea, Vietnam
- Languages at home
- 34% English-only · Spanish 48% Tagalog/Filipino 5% Other Indo-European 5%
Political lean MEDSL · Los Angeles
- 2024 margin
- Solid D (+32.9) · D 64.8% · R 31.9% · Other 3.3%
- 2008→2024 swing
- -7.4pp toward R · 2008: 40.4pp · 2024: 32.9pp
- All cycles
- 2024: D+32.9 2020: D+44.2 2016: D+48.0 2012: D+40.0 2008: D+40.4
Not yet ingested
- Civics
- —
Market trends
- HPI YoY
- ▼ -739.13%
- Current HPI
- 450.3612
- Rent YoY
- ▲ 0.51%
- Metro
- Los Angeles-Long Beach-Anaheim, CA
- State GDP YoY
- ▲ 3.21%
- F500 in state
- 116
Industry mix (Fortune 500 HQ in CA)
| Industry | F500 HQs | Revenue |
|---|---|---|
| Technology | 27 | $1,492B |
|
||
| Financial Services | 3 | $174B |
|
||
| Retail | 3 | $44B |
|
||
| Insurance | 3 | $26B |
|
||
| Media / Entertainment | 2 | $115B |
|
||
| Pharmaceuticals / Biotech | 2 | $62B |
|
||
Price history
1 event — show timeline
- 2026-06-04 Listed $2,195,000 TheMLS
Property tax history
+6.3%/yrLatest (2025): $10,016 · +1.5% YoY. Source: county tax records.
Cash-flow waterfall
monthlySold comps — $/sqft
last 12 mo · ≤1 miLoading sold comps…