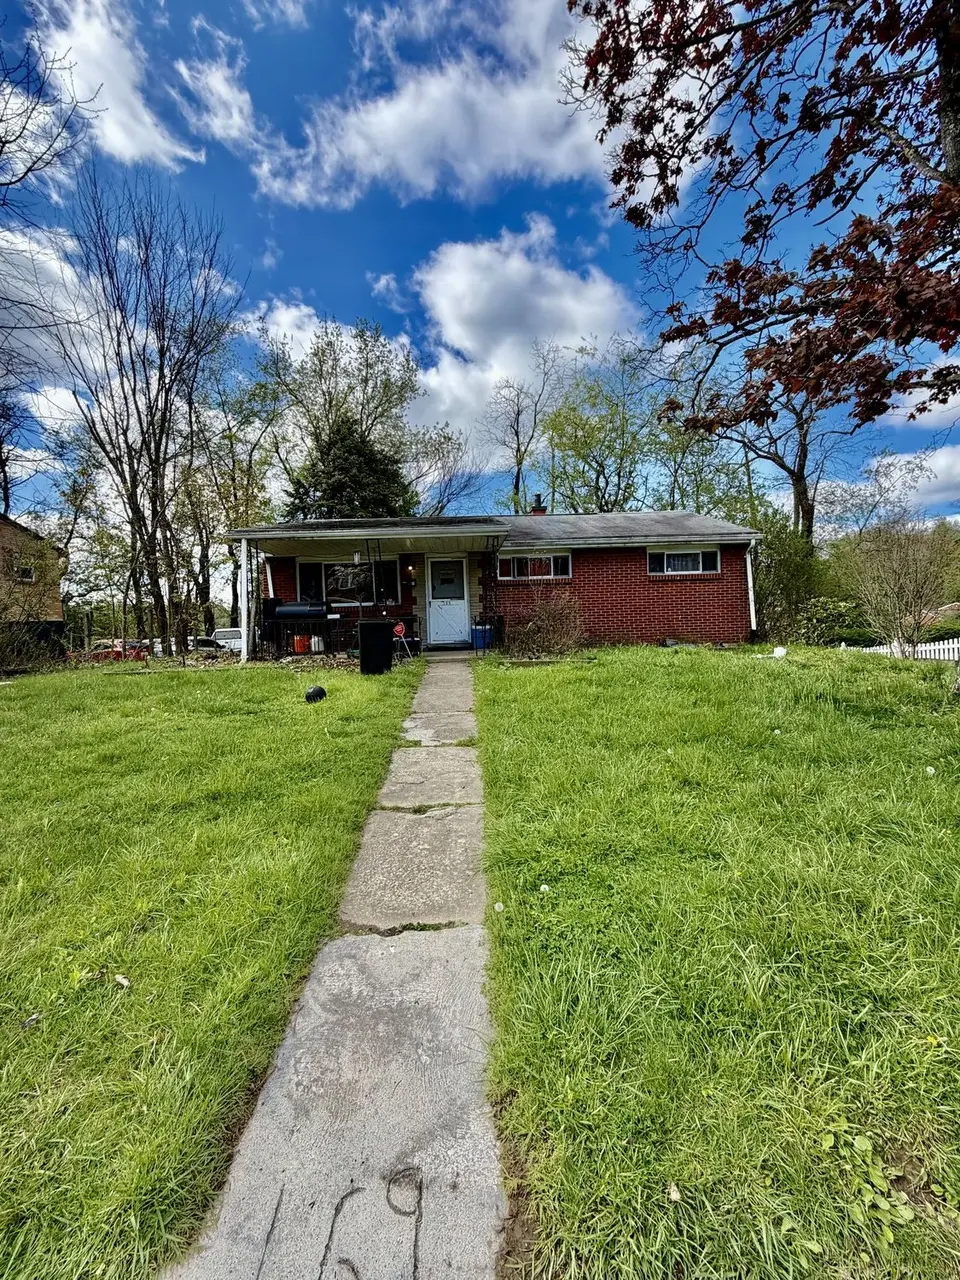
169 Suncrest Dr · Penn Hills, PA
Flood risk 1/10 · Minimal
- FEMA flood zone
- X (unshaded)
- Chance of flooding over 30 yrs
- 0.0%
- Est. flood insurance / yr
- $473 – $860
Fire risk 1/10 · Minimal
- Est. fire insurance / yr
- $511 – $949
Heat risk 3/10 · Minor
- Hot days now (above 96°F)
- 6 days/yr
- Hot days in 30 yrs
- 14 days/yr
Wind risk 2/10 · Minimal
- Chance of severe wind over 30 yrs
- 0.0%
Air-quality risk 4/10 · Minor
- Unhealthy air days now
- 5 days/yr
- Unhealthy air days in 30 yrs
- 7 days/yr
Risk factors via First Street. Map © Google.
Why this score? — see what drove the C grade
The composite is a weighted blend of 9 inputs, each scored 0–100. Each bar is that input's sub-score; the figure is the points it added to the 100-point composite (weight × sub-score).
- Cash flow +21.1/30.0
- ARV discount +12.6/15.0
- DSCR +6.7/10.0
- 1% rule +6.3/10.0
- Rent growth +2.5/5.0
- Livability +2.5/5.0
- Condition / age +2.5/5.0
- Schools +1.6/10.0
- Appreciation +0.0/10.0
$135,000
🖨 Deal sheet 📄 Offer letter ✓ Due diligence
Listing remarks
169 Suncrest Drive - a first time homebuyer or investor's opportunity to add value and reap benefits in the Verona market of Penn Hills. This ranch is move-in ready and has room for upgrades. It is placed on a quiet and maintained street with a newer water heater and furnace (Feb 2023), integral garage, 3 bedrooms and 1 bathroom. Start building wealth today!
Key facts
- Newer furnace
- Integral garage
- Newer water heater
Tags
Property features AI
Exterior
- Utilities: Public water; Public sewer
- Home design: Single-story home; Resale property
- Construction: Brick construction; Shake roof
- Exterior features: Lot approximately 75 x 97 feet
Interior
- Kitchen: Cooktop; Some gas appliances
- Bathrooms: 1 full bathroom
- Heating & cooling: Forced air gas heating; Wall/window cooling units
- Interior features: Screens on windows; Walk-out basement
Neighborhood map
What this means for you Summary
Snapshot
- This is a 3-bed/1.5-bath single-family listed at $135k.
Deal economics
- At list price, monthly cash flow is $193 ($2k/yr) — positive.
- The deal already cash-flows at list — no discount required.
- Meets the 1% rule at list price ($2k rent vs $135k).
- Recommended offer: $131k (3.0% below list) — sets the bar for market timing.
Location & tenants
- Location reads: area grade C — affects rentability + tenant quality, not the cash-flow math above.
- Penn Hills SD (suburban): math 13% / reading 24% proficiency, ranked #496 of 539 in PA (top 92%) — low school quality limits family demand, transient renter base, plan for 1-2y turnover.
- Market conditions: 64 active listings in the ZIP; 12 comparable units currently listed for rent nearby; rentals leasing fast (median 13d on market — plan ~1-2 weeks tenant-placement turnaround); 2,996 units permitted in Allegheny County in 2024 (1,588 in 5+ unit buildings).
Forward outlook
- Local home prices are declining (-3.0%/yr); year-one equity from $933 of loan paydown is wiped out by about $4k of value loss. Plan a longer hold.
Negotiation context
- It's been on market 54 days — a 3% lower offer ($131k) is reasonable based on typical stale-listing flexibility.
- Current owner paid $52k; list at $135k implies a 160% gain — meaningful room to come down on a strong offer.
Questions for the listing agent
- It's been on market 54 days. Have you received any prior offers? Is the seller open to a 3% concession, seller financing, or rate buy-down credit?
- Built in 1960 — when were the roof, HVAC, electrical panel, plumbing, and water heater last replaced?
- Is there a deadline driving the sale (1031 exchange, divorce, estate, relocation)? That informs how much negotiation room exists.
- What's the average days-on-market for RENTAL listings here right now (not sales)? A rising rental-DOM trend means longer vacancies and softer asking-rent achievability than the comps imply.
- What's the recent tenant-quality profile in this submarket — average credit score on applications, eviction rate, late-payment / NSF rate, and stable-employment percentage? A property-management company in the area should have these aggregated.
- How much new for-sale + rental construction is in the pipeline within 1–3 miles? Heavy new supply typically softens prices + rents 12–24 months out; constrained supply supports both.
Investment metrics
- 1% rule
- 1.13% ✓
- Cap rate
- 8.01%
- Cash-on-cash
- 6.13%
- DSCR
- 1.27
- GRM
- 7.4
CMA / ARV
- ARV (median comp)
- $152,317
- List price
- $135,000
- Delta
- -11.37%
- Verdict
- UNDERPRICED
- Comps
- 20 within 1.0 mi
Show comp detail 12 sales within ~0.75 mi
| Address | Dist | Beds/Ba | Sqft | Sold | Price | $/sf | Match |
|---|---|---|---|---|---|---|---|
| 157 Suncrest Dr | 0.04mi | 3/2.0 | 950 (0%) | 10mo | $188,000 | $198 | 88 |
| 149 Eastminster Dr | 0.18mi | 3/2.0 | 960 (+1%) | 4mo | $110,500 | $115 | 84 |
| 134 Jeanette Dr | 0.23mi | 3/1.0 | 1,008 (+6%) | 2mo | $143,000 | $142 | 75 |
| 502 Bon Air Rd | 0.57mi | 3/2.0 | 922 (-3%) | 2mo | $129,000 | $140 | 65 |
| 8056 Lincoln Rd | 0.50mi | 3/1.0 | 952 (+0%) | 13mo | $133,500 | $140 | 63 |
| 101 Selvin Dr | 0.31mi | 3/1.5 | 1,079 (+14%) | 8mo | $224,900 | $208 | 56 |
| 7729 Mark Dr | 0.59mi | 2/2.0 (-1) | 950 (0%) | 12mo | $197,000 | $207 | 56 |
| 8086 Aber Rd | 0.20mi | 3/2.0 | 1,066 (+12%) | 15mo | $206,000 | $193 | 56 |
| 2023 Palm Ave | 0.72mi | 2/1.5 (-1) | 962 (+1%) | 12mo | $168,000 | $175 | 49 |
| 7735 Mount Carmel Rd | 0.61mi | 3/1.5 | 1,047 (+10%) | 8mo | $75,000 | $72 | 48 |
| 10085 Grandview Ave | 0.60mi | 2/1.0 (-1) | 1,047 (+10%) | 8mo | $148,000 | $141 | 41 |
| 7765 Jane St | 0.61mi | 3/1.0 | 1,053 (+11%) | 16mo | $150,000 | $142 | 38 |
Match score weights: distance 35% · size 25% · config 20% · recency 20%. Top-matched comps best support the ARV.
Projected returns pro-forma
-3.0% appreciation · 3.0% rent growth · sell at horizon
- IRR
- -6.8%
- Equity multiple
- 0.75×
- Total profit
- $-9,506
- Equity at exit
- $20,129
- IRR
- 2.9%
- Equity multiple
- 1.21×
- Total profit
- $7,843
- Equity at exit
- $11,672
Cash invested: $37,800 (down + closing). Projections, not guarantees.
Landlord ↔ Tenant lean methodology
- Overall (STATE)
- 62 Landlord-Friendly
- State Pennsylvania
- 62 Landlord-Friendly · EVEN
- County
- — inherits STATE
- City
- — inherits STATE
ZIP-level market 15147
- Home prices YoY
- -26.0%
- Active inventory
- 64
- Price-to-rent
- 7.4×
Monthly cashflow live
- Estimated rent
- $1,521 high interval (Pro) →
- Mortgage (P&I)
- −$708
- Tax from tax record
- −$244 /mo · $2,932/yr
- Insurance
- −$56
- HOA
- −$0
- Vacancy / Maint / Mgmt
- −$319
- Net cashflow
- $193
Break-even live
UW: 25.0% down · 7.5% · 30yr · 1.5% tax · 5.0% vac · 8.0% maint · 8.0% mgmt
Financing live
Cash to close
- Down payment
- $33,750
- Closing costs
- $4,050
- Reserves months
- —
- Total cash needed
- —
Loan-product check · same deal, 3 products live
Conventional
25% down · 7.5% · 30yr
- Down + closing
- —
- Monthly P&I
- —
- Monthly cashflow
- —
- DSCR
- —
- Eligible?
- —
Personal DTI + credit; lowest rate.
DSCR
20% down · 8.5% · 30yr
- Down + closing
- —
- Monthly P&I
- —
- Monthly cashflow
- —
- DSCR
- —
- Eligible?
- —
No personal income docs; deal must DSCR.
Hard money
10% down · 12.0% · 12mo
- Down + closing
- —
- Monthly P&I
- —
- Monthly cashflow
- —
- DSCR
- —
- Eligible?
- —
Short-term bridge; refi at stabilization.
Rent comps 12 comps
| Address | Beds | Baths | Sqft | Rent | $/sqft | DOM | Units | Dist |
|---|---|---|---|---|---|---|---|---|
| 273 Bramble St Verona, PA | 3.0 | 1.5 | 1076 | $1,720 | $1.60 | 4d | 1 | 0.36mi |
| 8075 Chaske St Verona, PA | 3.0 | 1.5 | 1092 | $1,425 | $1.30 | 7d | 1 | 0.41mi |
| 10043 Calvin St Pittsburgh, PA | 2.0 | 1.0 | 778 | $1,195 | $1.54 | 43d | 1 | 0.68mi |
| 2700 Robinson Blvd Penn Hills, PA | 1.0–2.0 | 1.0 | 660 | $1,100 | $1.67 | 1d | 3 | 0.81mi |
| 185 Howard St Pittsburgh, PA | 2.0 | 1.0 | 1000 | $1,250 | $1.25 | 43d | 1 | 0.90mi |
| 3005 Laketon Rd Pittsburgh, PA | 3.0 | 1.0 | 1100 | $1,295 | $1.18 | 14d | 1 | 1.14mi |
| 457 Elias Dr #445 Pittsburgh, PA | 2.0 | 1.0 | 888 | $1,200 | $1.35 | 17d | 1 | 1.19mi |
| 648 Southern Ave Penn Hills, PA | 3.0 | 1.0 | 1100 | $1,600 | $1.45 | 7d | 1 | 1.24mi |
| 610 Churchill Ave Pittsburgh, PA | 3.0 | 1.0 | 1100 | $1,395 | $1.27 | 2d | 1 | 1.24mi |
| 8 Riverside Ct Pittsburgh, PA | 3.0 | 1.0 | 1015 | $1,350 | $1.33 | 23d | 1 | 1.31mi |
| 62 Melvin Ct Penn Hills Township, PA | 1.0–2.0 | 1.0 | 825 | $1,549 | $1.88 | 7d | 2 | 1.46mi |
| 1426 Homestead Rd Unit 3 Verona, PA | 3.0 | 1.0 | 1000 | $1,499 | $1.50 | 12d | 1 | 1.48mi |
Listing history 17 events
-
2026-06-18days on market $135,000 Active 54 DOM
-
2026-06-17days on market $135,000 Active 53 DOM
-
2026-06-16days on market $135,000 Active 52 DOM
-
2026-06-15days on market $135,000 Active 51 DOM
-
2026-06-13days on market $135,000 Active 49 DOM
-
2026-06-13days on market $135,000 Active 48 DOM
-
2026-06-09days on market $135,000 Active 45 DOM
-
2026-06-08days on market $135,000 Active 44 DOM
-
2026-06-07days on market $135,000 Active 43 DOM
-
2026-06-05days on market $135,000 Active 40 DOM
-
2026-06-03days on market $135,000 Active 39 DOM
-
2026-06-02days on market $135,000 Active 38 DOM
-
2026-06-01days on market $135,000 Active 37 DOM
-
2026-05-31days on market $135,000 Active 36 DOM
-
2026-04-21$135,000 Active 360-char remark
-
1994-06-20soldstatus $52,000
-
1984-04-06soldstatus $36,900
ⓘ Source: listings_history table (triggers on properties + properties_extension) + one-shot
backfill from property_details.listing_events for pre-trigger history.
Tax reassessment forecast PA · Partial reset (capped growth)
- Current annual tax
- $2,932 · $244/mo
- Projected year-2 tax
- $2,932 · $244/mo
- Expected delta
- $0/yr ($0/mo · 0.0%)
ⓘ Screening estimate from a state-policy table — verify with the county assessor before closing.
Climate risk First Street
- Flood 1/10 Low FEMA zone X (unshaded) · 0% chance over 30 yrs
- Wildfire 1/10 Low
- Heat 3/10 Moderate 6 d/yr ≥96°F today · 14 d/yr by 30 yrs out
- Wind 2/10 Low 0% chance of damaging wind over 30 yrs
- Air quality 4/10 Moderate 5 unhealthy d/yr today · 7 by 30 yrs out
Nearby sold comps map
Loading sold comps map…
Walkable amenities ~0.75 mi
Loading nearby amenities…
Taxation est. · year 1
- Rental income
- $18,253
- − Mortgage interest
- −$7,562
- − Property taxes
- −$2,932
- − Insurance
- −$675
- − Repairs & maintenance
- −$1,460
- − Management
- −$1,460
- − Depreciation
- −$3,927
- Taxable income
- $236
- Est. tax owed @ 24.0%
- −$57
- After-tax cash flow
- $2,261/yr
For passive investors: Depreciation is non-cash, so a rental often shows a tax loss while cash-flowing — sheltering income. Rental losses are passive: they offset passive income freely, and up to $25,000/yr can offset ordinary (W-2) income if you actively participate and your MAGI is under $100k (phasing out to $0 by $150k); unused losses carry forward. On sale, claimed depreciation is recaptured at up to 25%, and gains may owe capital-gains tax (a 1031 exchange can defer both). Figures are a year-1 estimate at your 24.0% rate — not tax advice; consult a CPA.
Schools (NCES district)
- District
- Penn Hills SD
- NCES district ID
- 4218590
- Math proficiency
- 13% ▼ -6.00%
- Reading proficiency
- 24% ▼ -14.00%
- Median HH income
- $47,794
- Composite
- 16.42/100
- National rank
- #9192
- State rank
- #496 of 539 in PA
Livability — Penn Hills
No livability data for this city. (Only ~50 U.S. cities are tracked.)
Census & demographics
- County
- Allegheny County · 1,022,028 people
- Metro
- Pittsburgh, PA
- Population (ZIP)
- 15,798
- Household income
- $66,757
- Rent vs Own
- Severe rent burden
- 511.0
Population outlook (Allegheny County) Hauer SSP2
- Today (2025)
- 1,250,282 people
- By 2030
- 1,256,482 · +0.5%
- By 2040
- 1,256,318 · +0.5%
- By 2050
- 1,244,169 · -0.5%
- By 2075
- 1,197,693 · -4.2%
- By 2100
- 1,093,187 · -12.6%
Race, ethnicity, and origin ACS 2023
- Neighborhood character
- Predominantly White (69%)
- Race & ethnicity
- White 69% Black 21% Two or more races 6% Hispanic / Latino 4%
- Common ancestry
- Romanian 6% Slovak 2% Serbian 1%
- Foreign-born
- 3% · Canada
- Languages at home
- 95% English-only · Spanish 3% Other Indo-European 1%
Political lean MEDSL · Allegheny
- 2024 margin
- Strong D (+20.3) · D 59.7% · R 39.4%
- 2008→2024 swing
- +4.8pp toward D · 2008: 15.5pp · 2024: 20.3pp
- All cycles
- 2024: D+20.3 2020: D+20.4 2016: D+16.4 2012: D+14.4 2008: D+15.5
Not yet ingested
- Civics
- —
Market trends
- HPI YoY
- ▼ -87.47%
- Current HPI
- 249.3773
- Rent YoY
- —
- Metro
- Pittsburgh, PA
- State GDP YoY
- ▲ 1.68%
- F500 in state
- 34
Industry mix (Fortune 500 HQ in PA)
| Industry | F500 HQs | Revenue |
|---|---|---|
| Healthcare | 2 | $309B |
|
||
| Insurance | 2 | $27B |
|
||
| Telecommunications / Media | 1 | $124B |
|
||
| Industrial Distribution | 1 | $22B |
|
||
| Financial Services | 1 | $20B |
|
||
| Chemicals / Materials | 1 | $18B |
|
||
Price history
+265.9% since first listed3 events — show timeline
- 2026-04-21 Listed $135,000 West Penn MLS
- 1994-06-20 Sold (Public Records) $52,000 Public Records
- 1984-04-06 Sold (Public Records) $36,900 Public Records
Property tax history
+2.5%/yrLatest (2026): $2,932 · +0.0% YoY. Source: county tax records.
Cash-flow waterfall
monthlySold comps — $/sqft
last 12 mo · ≤1 miLoading sold comps…