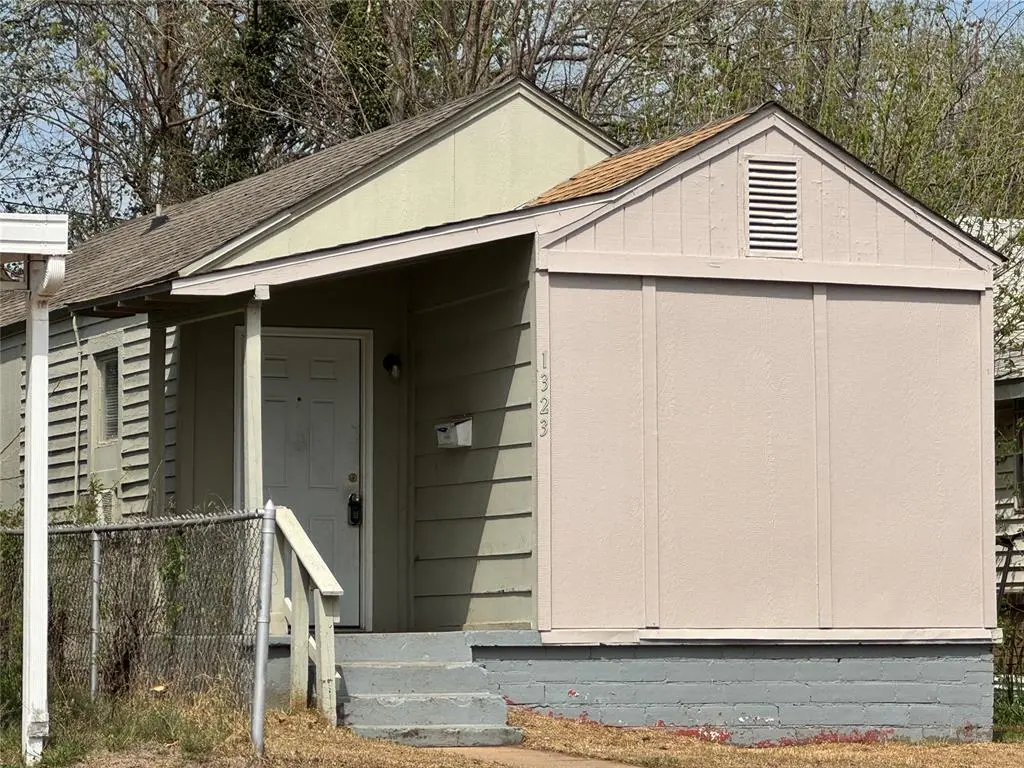
1323 NE 7th St · Oklahoma City, OK
Flood risk 1/10 · Minimal
- FEMA flood zone
- X (unshaded)
- Chance of flooding over 30 yrs
- 0.0%
- Est. flood insurance / yr
- $507 – $1,088
Fire risk 1/10 · Minimal
- Est. fire insurance / yr
- $2,463 – $4,575
Heat risk 6/10 · Moderate
- Hot days now (above 107°F)
- 7 days/yr
- Hot days in 30 yrs
- 19 days/yr
Wind risk 2/10 · Minimal
- Chance of severe wind over 30 yrs
- 3.0%
Air-quality risk 2/10 · Minimal
- Unhealthy air days now
- 1 days/yr
- Unhealthy air days in 30 yrs
- 2 days/yr
Risk factors via First Street. Map © Google.
Why this score? — see what drove the B+ grade
The composite is a weighted blend of 9 inputs, each scored 0–100. Each bar is that input's sub-score; the figure is the points it added to the 100-point composite (weight × sub-score).
- Cash flow +30.0/30.0
- ARV discount +15.0/15.0
- DSCR +10.0/10.0
- 1% rule +8.7/10.0
- Appreciation +6.2/10.0
- Livability +4.0/5.0
- Rent growth +2.5/5.0
- Condition / age +2.5/5.0
- Schools +0.7/10.0
$78,000
🖨 Deal sheet 📄 Offer letter ✓ Due diligence
Listing remarks MLS
Home is located very close to the OU med center, VA Hospital, and all the exciting things going on in this area. Has been a rental for several years. Need to make a good ready or someone could do a nice rehab remodel
Key facts
- 3,498 sq ft lot
- Built 1935
- Listed 106 days
Neighborhood map
What this means for you Summary
Snapshot
- This is a 1-bed/1.0-bath single-family listed at $78k.
Deal economics
- At list price, monthly cash flow is $368 ($4k/yr) — positive.
- The deal already cash-flows at list — no discount required.
- Meets the 1% rule at list price ($1k rent vs $78k).
- Recommended offer: $71k (9.0% below list) — sets the bar for market timing.
- Cap rate 11.9% vs local median 3.7% in Oklahoma City — top-decile yield for the area; either an underpriced asset or a hidden risk that comps aren't pricing in. Stress-test before assuming the spread holds.
Location & tenants
- Location reads 80/100 on livability (#3 in OK, #1,635 nationally) — a professional / high-income tenant draw. Strengths: amenities A+, commute A+, cost of living A+; Watch: schools F, crime F.
- Oklahoma City (urban): math 7% / reading 10% proficiency, ranked #254 of 270 in OK (top 94%) — low school quality limits family demand, transient renter base, plan for 1-2y turnover; 82% free/reduced lunch — lower-income household profile, screen leases tightly.
- Market conditions: 75 active listings in the ZIP; 30 comparable units currently listed for rent nearby; rentals at typical pace (median 24d on market — plan ~3-4 weeks tenant-placement turnaround); 40% of comp listings sitting > 30 days — soft ceiling on asking rent; lower-income renter base — watch delinquency; 5,365 units permitted in Oklahoma County in 2024 (569 in 5+ unit buildings).
- At $1,068/mo this rent would consume 55% of the median local household income ($23k/yr) (locally 681% of renters already pay >50% of income on rent) — very limited rent-growth headroom before tenants either downsize or default.
Forward outlook
- In year one you build about $2k of equity ($539 loan paydown + $2k appreciation (2.4% local appreciation)).
- Oklahoma County population projected at +41% by 2050 — long-run rental-demand tailwind backs the buy-and-hold thesis.
- At projected returns (2.4% appreciation + 3.0% rent growth), your $22k cash investment doubles in ~4 years — after that, you're playing with house money.
Negotiation context
- It's been on market 106 days — a 9% lower offer ($71k) is reasonable based on typical stale-listing flexibility.
Risks & watch-outs
- Watch-outs: built in 1935 — expect roof / HVAC / electrical / plumbing capex.
- Climate carrying-cost: extreme-heat days projected 7→19/yr by 2055 (HVAC capex compounding) — expect insurance premiums to compound above CPI over the hold.
Questions for the listing agent
- It's been on market 106 days. Have you received any prior offers? Is the seller open to a 9% concession, seller financing, or rate buy-down credit?
- Built in 1935 — when were the roof, HVAC, electrical panel, plumbing, and water heater last replaced?
- Why hasn't it sold? Are there any deal-killer items the seller is aware of (foundation, flood, title, zoning, code violations)?
- Is there a deadline driving the sale (1031 exchange, divorce, estate, relocation)? That informs how much negotiation room exists.
- Schools are F-rated, which usually means shorter tenancies and higher turnover. Who's the typical renter profile here, and what's been the actual vacancy rate?
- Crime grade is F in this area — have there been break-ins, vandalism, or insurance claims at this property in the last 3 years? What carrier currently insures it and at what premium?
- What's the average days-on-market for RENTAL listings here right now (not sales)? A rising rental-DOM trend means longer vacancies and softer asking-rent achievability than the comps imply.
- What's the recent tenant-quality profile in this submarket — average credit score on applications, eviction rate, late-payment / NSF rate, and stable-employment percentage? A property-management company in the area should have these aggregated.
- How much new for-sale + rental construction is in the pipeline within 1–3 miles? Heavy new supply typically softens prices + rents 12–24 months out; constrained supply supports both.
Investment metrics
- 1% rule
- 1.37% ✓
- Cap rate
- 11.95%
- Cash-on-cash
- 20.19%
- DSCR
- 1.90
- GRM
- 6.1
CMA / ARV
- ARV (median comp)
- $117,849
- List price
- $78,000
- Delta
- -33.81%
- Verdict
- UNDERPRICED
- Comps
- 20 within 1.0 mi
Show comp detail 7 sales within ~0.75 mi
| Address | Dist | Beds/Ba | Sqft | Sold | Price | $/sf | Match |
|---|---|---|---|---|---|---|---|
| 1417 NE 10th St | 0.24mi | 2/1.0 (+1) | 840 (-3%) | 10mo | $132,500 | $158 | 71 |
| 1421 NE 7th St | 0.10mi | 2/2.0 (+1) | 890 (+3%) | 23mo | $134,900 | $152 | 62 |
| 1449 NE 14th St | 0.63mi | 2/1.0 (+1) | 884 (+2%) | 2mo | $100,000 | $113 | 60 |
| 1448 NE 8th St | 0.18mi | 2/1.0 (+1) | 956 (+11%) | 17mo | $135,000 | $141 | 55 |
| 1521 NE 11th St | 0.43mi | 2/1.0 (+1) | 972 (+12%) | 4mo | $65,000 | $67 | 50 |
| 1304 NE 16th St | 0.73mi | 2/1.0 (+1) | 936 (+8%) | 14mo | $120,000 | $128 | 35 |
| 1400 NE 16th St | 0.73mi | 2/1.0 (+1) | 978 (+13%) | 10mo | $75,000 | $77 | 31 |
Match score weights: distance 35% · size 25% · config 20% · recency 20%. Top-matched comps best support the ARV.
Projected returns pro-forma
2.42% appreciation · 3.0% rent growth · sell at horizon
- IRR
- 25.3%
- Equity multiple
- 2.39×
- Total profit
- $30,398
- Equity at exit
- $32,537
- IRR
- 26.6%
- Equity multiple
- 4.59×
- Total profit
- $78,426
- Equity at exit
- $48,255
Cash invested: $21,840 (down + closing). Projections, not guarantees.
Landlord ↔ Tenant lean methodology
- Overall (STATE)
- 83 Strongly Landlord-Friendly
- State Oklahoma
- 83 Strongly Landlord-Friendly · R+20
- County
- — inherits STATE
- City
- — inherits STATE
ZIP-level market 73117
- Home prices YoY
- 1.3%
- Active inventory
- 75
- Price-to-rent
- 6.1×
Monthly cashflow live
- Estimated rent
- $1,068 high interval (Pro) →
- Mortgage (P&I)
- −$409
- Tax from tax record
- −$35 /mo · $419/yr
- Insurance
- −$32
- HOA
- −$0
- Vacancy / Maint / Mgmt
- −$224
- Net cashflow
- $368
Break-even live
UW: 25.0% down · 7.5% · 30yr · 1.5% tax · 5.0% vac · 8.0% maint · 8.0% mgmt
Financing live
Cash to close
- Down payment
- $19,500
- Closing costs
- $2,340
- Reserves months
- —
- Total cash needed
- —
Loan-product check · same deal, 3 products live
Conventional
25% down · 7.5% · 30yr
- Down + closing
- —
- Monthly P&I
- —
- Monthly cashflow
- —
- DSCR
- —
- Eligible?
- —
Personal DTI + credit; lowest rate.
DSCR
20% down · 8.5% · 30yr
- Down + closing
- —
- Monthly P&I
- —
- Monthly cashflow
- —
- DSCR
- —
- Eligible?
- —
No personal income docs; deal must DSCR.
Hard money
10% down · 12.0% · 12mo
- Down + closing
- —
- Monthly P&I
- —
- Monthly cashflow
- —
- DSCR
- —
- Eligible?
- —
Short-term bridge; refi at stabilization.
Rent comps 30 comps
| Address | Beds | Baths | Sqft | Rent | $/sqft | DOM | Units | Dist |
|---|---|---|---|---|---|---|---|---|
| 1330 NE 7th St Unit A Oklahoma City, OK | 1.0 | 1.0 | 534 | $900 | $1.69 | 43d | 1 | 0.03mi |
| 1436 NE 8th St Oklahoma City, OK | 2.0 | 1.0 | 1048 | $1,095 | $1.04 | 43d | 1 | 0.12mi |
| 1445 NE 10th St Oklahoma City, OK | 2.0 | 1.0 | 1011 | $1,195 | $1.18 | 17d | 1 | 0.26mi |
| 1148 N Lottie Ave Oklahoma City, OK | 2.0 | 1.0 | 1040 | $1,150 | $1.11 | 3d | 1 | 0.35mi |
| 505 N High Ave Oklahoma City, OK | 1.0–2.0 | 1.0–2.0 | 697 | $1,132 | $1.62 | 43d | 1 | 0.47mi |
| 1801 E Park Pl Oklahoma City, OK | 2.0 | 1.0 | 734 | $695 | $0.95 | 43d | 1 | 0.59mi |
| 1220 NE 17th St Oklahoma City, OK | 2.0 | 1.0 | 1100 | $1,195 | $1.09 | 43d | 1 | 0.82mi |
| 1200 NE 17th St Unit B Oklahoma City, OK | 2.0 | 1.0 | 1002 | $2,100 | $2.10 | 43d | 1 | 0.83mi |
| 935 NE 16th St Oklahoma City, OK | 1.0 | 1.0 | 727 | $795 | $1.09 | 43d | 1 | 0.84mi |
| 1801 N Jordan Ave Oklahoma City, OK | 2.0 | 1.0 | 1080 | $1,000 | $0.93 | 14d | 1 | 0.86mi |
| 943 East Dr Oklahoma City, OK | 1.0 | 1.0 | 900 | $995 | $1.11 | 4d | 1 | 0.89mi |
| 939 East Dr Oklahoma City, OK | 2.0 | 1.0 | 1039 | $1,100 | $1.06 | 23d | 1 | 0.89mi |
| 1609 NE 18th St Oklahoma City, OK | 2.0 | 1.0 | 899 | $900 | $1.00 | 4d | 1 | 0.93mi |
| 800 East Dr Unit 1 Oklahoma City, OK | 1.0 | 1.0 | 752 | $900 | $1.20 | 3d | 1 | 0.99mi |
| 505 E Sheridan Ave Oklahoma City, OK | 1.0–3.0 | 1.0–2.0 | 1012 | $1,398 | $1.38 | 1d | 16 | 1.05mi |
| 1722 NE 20th St Oklahoma City, OK | 2.0 | 1.0 | 800 | $1,070 | $1.34 | 43d | 1 | 1.06mi |
| 701 Culbertson Dr Oklahoma City, OK | 1.0 | 1.0 | 700 | $825 | $1.18 | 2d | 1 | 1.08mi |
| 2128 N Stonewall Ave Unit 1 Oklahoma City, OK | 2.0 | 1.0 | 960 | $800 | $0.83 | 3d | 1 | 1.11mi |
| 2148 N Stonewall Ave Oklahoma City, OK | 2.0 | 1.0 | 1055 | $875 | $0.83 | 4d | 1 | 1.15mi |
| 1401 NE 22nd St Oklahoma City, OK | 2.0 | 1.0 | 728 | $1,100 | $1.51 | 23d | 1 | 1.20mi |
| 2225 Glen Ellyn St Oklahoma City, OK | 2.0 | 1.0 | 1095 | $925 | $0.84 | 43d | 1 | 1.21mi |
| 2132 NE 19th St Oklahoma City, OK | 2.0 | 1.0 | 850 | $950 | $1.12 | 43d | 1 | 1.23mi |
| 800 N Oklahoma Ave Oklahoma City, OK | 2.0 | 1.0–3.0 | 1051 | $1,875 | $1.78 | 1d | 32 | 1.24mi |
| 123 NE 2nd St Oklahoma City, OK | 2.0 | 2.0 | 1051 | $1,750 | $1.67 | 20d | 1 | 1.26mi |
| 425 N Oklahoma Ave Oklahoma City, OK | 1.0–3.0 | 1.0–2.5 | 1030 | $1,125 | $1.09 | 1d | 44 | 1.32mi |
| 1 NE 2nd St #304 Oklahoma City, OK | 1.0 | 1.0 | 793 | $1,299 | $1.64 | 23d | 1 | 1.33mi |
| 1 NE 2nd St Oklahoma City, OK | 1.0 | 1.0 | 793 | $1,074 | $1.35 | 43d | 2 | 1.38mi |
| 1 NE 2nd St Oklahoma City, OK | 1.0 | 1.0 | 793 | $1,074 | $1.35 | 19d | 2 | 1.38mi |
| 1709 N Page Ave Oklahoma City, OK | 2.0 | 1.0 | 967 | $895 | $0.93 | 23d | 1 | 1.39mi |
| 2501 NE 16th St Oklahoma City, OK | 2.0 | 1.0 | 941 | $1,100 | $1.17 | 43d | 1 | 1.40mi |
Listing history 15 events
-
2026-06-18days on market $78,000 Active 106 DOM
-
2026-06-17days on market $78,000 Active 105 DOM
-
2026-06-16days on market $78,000 Active 104 DOM
-
2026-06-15days on market $78,000 Active 103 DOM
-
2026-06-13days on market $78,000 Active 101 DOM
-
2026-06-09days on market $78,000 Active 97 DOM
-
2026-06-08days on market $78,000 Active 96 DOM
-
2026-06-07days on market $78,000 Active 95 DOM
-
2026-06-05days on market $78,000 Active 92 DOM
-
2026-06-03days on market $78,000 Active 91 DOM
-
2026-06-02days on market $78,000 Active 90 DOM
-
2026-06-01days on market $78,000 Active 89 DOM
-
2026-05-31days on market $78,000 Active 88 DOM
-
2026-04-08price $78,000 218-char remark
Show marketing remark (218 chars)
Home is located very close to the OU med center, VA Hospital, and all the exciting things going on in this area. Has been a rental for several years. Need to make a good ready or someone could do a nice rehab remodel
-
2026-03-04$80,000 Active 218-char remark
Show marketing remark (218 chars)
Home is located very close to the OU med center, VA Hospital, and all the exciting things going on in this area. Has been a rental for several years. Need to make a good ready or someone could do a nice rehab remodel
ⓘ Source: listings_history table (triggers on properties + properties_extension) + one-shot
backfill from property_details.listing_events for pre-trigger history.
Tax reassessment forecast OK · Resets to sale price
- Current annual tax
- $419 · $35/mo
- Projected year-2 tax
- $702 · $58/mo
- Expected delta
- +$283/yr (+$24/mo · 67.4%)
ⓘ Screening estimate from a state-policy table — verify with the county assessor before closing.
Climate risk First Street
- Flood 1/10 Low FEMA zone X (unshaded) · 0% chance over 30 yrs
- Wildfire 1/10 Low
- Heat 6/10 Major 7 d/yr ≥107°F today · 19 d/yr by 30 yrs out
- Wind 2/10 Low 3% chance of damaging wind over 30 yrs
- Air quality 2/10 Low 1 unhealthy d/yr today · 2 by 30 yrs out
Nearby sold comps map
Loading sold comps map…
Walkable amenities ~0.75 mi
Loading nearby amenities…
Taxation est. · year 1
- Rental income
- $12,820
- − Mortgage interest
- −$4,369
- − Property taxes
- −$419
- − Insurance
- −$390
- − Repairs & maintenance
- −$1,026
- − Management
- −$1,026
- − Depreciation
- −$2,269
- Taxable income
- $3,321
- Est. tax owed @ 24.0%
- −$797
- After-tax cash flow
- $3,613/yr
For passive investors: Depreciation is non-cash, so a rental often shows a tax loss while cash-flowing — sheltering income. Rental losses are passive: they offset passive income freely, and up to $25,000/yr can offset ordinary (W-2) income if you actively participate and your MAGI is under $100k (phasing out to $0 by $150k); unused losses carry forward. On sale, claimed depreciation is recaptured at up to 25%, and gains may owe capital-gains tax (a 1031 exchange can defer both). Figures are a year-1 estimate at your 24.0% rate — not tax advice; consult a CPA.
Schools (NCES district)
- District
- Oklahoma City
- NCES district ID
- 4022770
- Math proficiency
- 7% ▼ -5.00%
- Reading proficiency
- 10% ▼ -6.00%
- Median HH income
- $35,606
- Composite
- 7.0/100
- National rank
- #9970
- State rank
- #254 of 270 in OK
Livability — Oklahoma City
- Score
- 80/100
- State rank
- #3
- US rank
- #1635
Category grades
Schools grade is shown separately in the Schools card above.
Census & demographics
- Census place
- Oklahoma City, OK
- County
- Oklahoma County · 771,644 people
- City population
- 498,656
- Metro
- Oklahoma City, OK
- Population (ZIP)
- 6,225
- Household income
- $23,413
- Rent vs Own
- Severe rent burden
- 681.0
Population outlook (Oklahoma County) Hauer SSP2
- Today (2025)
- 911,875 people
- By 2030
- 982,413 · +7.7%
- By 2040
- 1,130,468 · +24.0%
- By 2050
- 1,288,422 · +41.3%
- By 2075
- 1,711,482 · +87.7%
- By 2100
- 2,088,448 · +129.0%
Race, ethnicity, and origin ACS 2023
- Neighborhood character
- Diverse neighborhood (Simpson 0.56)
- Race & ethnicity
- Black 63% White 16% Two or more races 13% Hispanic / Latino 12% Asian 2%
- Hispanic origin (detail)
- Mexican 10%
- Foreign-born
- 10% · Canada, Guatemala, China
- Languages at home
- 87% English-only · Spanish 8% Other Indo-European 1% Other Asian/Pacific 1%
Political lean MEDSL · Oklahoma
- 2024 margin
- Toss-up / Even · D 48.0% · R 49.7% · Other 2.3%
- 2008→2024 swing
- +15.1pp toward D · 2008: -16.8pp · 2024: -1.7pp
- All cycles
- 2024: R+1.7 2020: R+1.1 2016: R+10.5 2012: R+16.7 2008: R+16.8
Not yet ingested
- Civics
- —
Market trends
- HPI YoY
- ▲ 2.42%
- Current HPI
- 192.3185
- Rent YoY
- —
- Metro
- Oklahoma City, OK
- State GDP YoY
- ▲ 1.55%
- F500 in state
- 6
Industry mix (Fortune 500 HQ in OK)
| Industry | F500 HQs | Revenue |
|---|---|---|
| Energy | 3 | $48B |
|
||
Price history
-2.5% since first listed2 events — show timeline
- 2026-04-08 Price Changed $78,000 MLSOK
- 2026-03-04 Listed $80,000 MLSOK
Property tax history
+3.2%/yrLatest (2025): $419 · +4.2% YoY. Source: county tax records.
Cash-flow waterfall
monthlySold comps — $/sqft
last 12 mo · ≤1 miLoading sold comps…