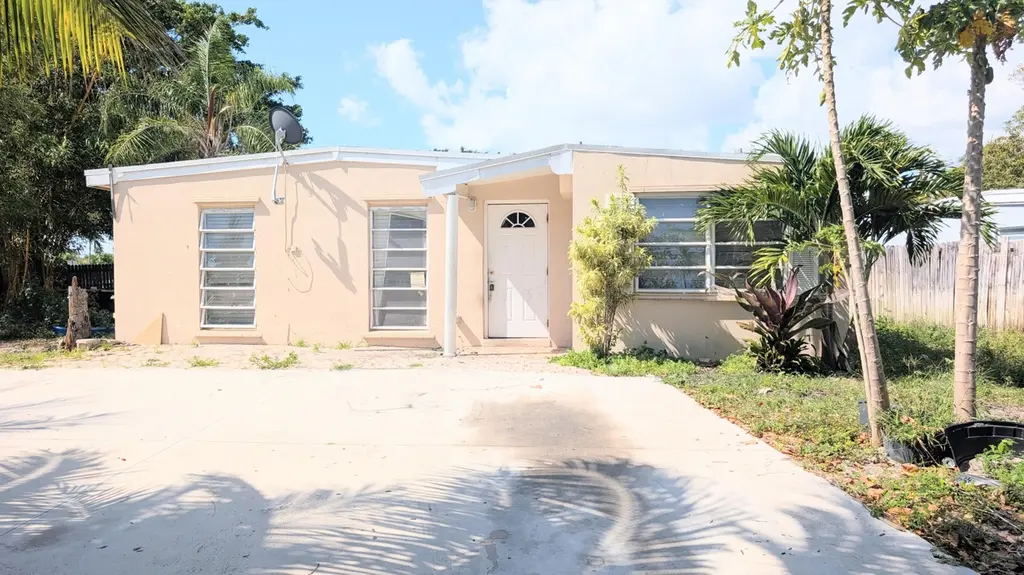
490 Tulip Tree Dr · San Castle, FL
Flood risk 1/10 · Minimal
- FEMA flood zone
- X (unshaded)
- Chance of flooding over 30 yrs
- 0.0%
- Est. flood insurance / yr
- $507 – $1,088
Fire risk 1/10 · Minimal
- Est. fire insurance / yr
- $947 – $1,759
Heat risk 9/10 · Severe
- Hot days now (above 105°F)
- 7 days/yr
- Hot days in 30 yrs
- 26 days/yr
Wind risk 10/10 · Severe
- Chance of severe wind over 30 yrs
- 99.0%
Air-quality risk 2/10 · Minimal
- Unhealthy air days now
- 0 days/yr
- Unhealthy air days in 30 yrs
- 2 days/yr
Risk factors via First Street. Map © Google.
Why this score? — see what drove the C grade
The composite is a weighted blend of 9 inputs, each scored 0–100. Each bar is that input's sub-score; the figure is the points it added to the 100-point composite (weight × sub-score).
- Cash flow +19.7/30.0
- ARV discount +15.0/15.0
- DSCR +6.2/10.0
- 1% rule +5.3/10.0
- Schools +4.3/10.0
- Rent growth +3.5/5.0
- Livability +3.4/5.0
- Condition / age +2.5/5.0
- Appreciation +0.0/10.0
$269,900
🖨 Deal sheet (PDF) 📄 Offer letter ✓ Due diligence
Listing remarks MLS
Location, Potential, Opportunity! This diamond in the rough is ready for complete renovation, polish this gem up and back to her former glory. Great location easy access to 95, or Federal Hwy. This is a sweet house even the bees love it, be careful as there is a bee hive somewhere on the right side of the house. No power or water will be turned on here for inspections. Note tax records state the property is a 3/1. This is a Cash Only sale, buyer must sign a hold harmless and assume the illegal campers on the property and any and all violations that are on the property.
Key facts
- Ample outdoor space
- Easy access to i-95
- No hoa restrictions
Tags
Property features AI
Finance
- Other: Pets allowed with no restrictions; Property faces north
Exterior
- Parking: No carport; No designated parking total provided
- Utilities: Public water; Public sewer; Sewer and water available
- Home design: Single family residence; Resale property; Single-story
- Construction: Stucco and CBS construction; Shingle roof
- Exterior features: Corner lot; Not waterfront
Interior
- Bedrooms: 3 bedrooms on the main level
- Flooring: Ceramic tile flooring
- Bathrooms: 1 full bathroom
- Heating & cooling: Central heating; Other heating; Central air conditioning
- Interior features: No special interior features listed; Unfurnished
Neighborhood map
What this means for you Summary
Snapshot
- This is a 3-bed/1.0-bath single-family listed at $270k.
Deal economics
- At list price, monthly cash flow is $316 ($4k/yr) — positive.
- The deal already cash-flows at list — no discount required.
- Meets the 1% rule at list price ($3k rent vs $270k).
- Recommended offer: $262k (3.0% below list) — sets the bar for market timing.
Location & tenants
- Location reads 67/100 on livability (#560 in FL) — a middle-class / working-renter tenant base. Strengths: cost of living A+, housing A+, health & safety A; Watch: amenities F, commute F, employment F.
- Palm Beach (suburban): math 46% / reading 53% proficiency, ranked #34 of 73 in FL (top 47%) — families likely to look elsewhere, expect single-tenant / working-renter base with shorter leases.
- Zoned schools: Rolling Green Elementary School (math 21% / reading 26%, grade F, #2,061 of 2,144 statewide, top 96%, 692 students, 88% FRL); Congress Community Middle School (math 21% / reading 28%, grade F, #522 of 571 statewide, top 93%, 988 students, 72% FRL); Boynton Beach Community High (math 13% / reading 25%, grade F, #565 of 667 statewide, top 85%, 1,547 students, 65% FRL) — zoned schools average 75% FRL vs 52% district-wide (23 pts higher); higher-poverty schools than district average — tighter screening recommended.
- Zoned-school proficiency averages 22% at this address vs 50% district-wide (-27 pts) — the specific schools serving this property underperform the Palm Beach average; the district grade overstates school quality for this exact location.
- Market conditions: Rents rising fast (+4.1%/yr); 385 active listings in the ZIP; 40 comparable units currently listed for rent nearby; rentals at typical pace (median 21d on market — plan ~3-4 weeks tenant-placement turnaround); 3,974 units permitted in Palm Beach County in 2024 (1,012 in 5+ unit buildings).
- At $2,778/mo this rent would consume 45% of the median local household income ($74k/yr) (locally 1852% of renters already pay >50% of income on rent) — very limited rent-growth headroom before tenants either downsize or default.
Forward outlook
- Local home prices are declining (-3.0%/yr); year-one equity from $2k of loan paydown is wiped out by about $8k of value loss. Plan a longer hold.
- Palm Beach County population projected at +30% by 2050 — long-run rental-demand tailwind backs the buy-and-hold thesis.
Negotiation context
- It's been on market 36 days — a 3% lower offer ($262k) is reasonable based on typical stale-listing flexibility.
- 3 sale attempts since 21y ago with the ask held roughly flat each time — persistent listings suggest the price (not the market) is what's stuck; bring a comps-based counter.
- Current owner paid $160k; list at $270k implies a 69% gain — meaningful room to come down on a strong offer.
Risks & watch-outs
- Watch-outs: built in 1959 — expect roof / HVAC / electrical / plumbing capex.
- Climate carrying-cost: severe wind risk, 99% chance of damaging wind over 30y; extreme-heat days projected 7→26/yr by 2055 (HVAC capex compounding) — expect insurance premiums to compound above CPI over the hold.
Questions for the listing agent
- It's been on market 36 days. Have you received any prior offers? Is the seller open to a 3% concession, seller financing, or rate buy-down credit?
- Built in 1959 — when were the roof, HVAC, electrical panel, plumbing, and water heater last replaced?
- Is there a deadline driving the sale (1031 exchange, divorce, estate, relocation)? That informs how much negotiation room exists.
- Schools are D-rated, which usually means shorter tenancies and higher turnover. Who's the typical renter profile here, and what's been the actual vacancy rate?
- What's the average days-on-market for RENTAL listings here right now (not sales)? A rising rental-DOM trend means longer vacancies and softer asking-rent achievability than the comps imply.
- What's the recent tenant-quality profile in this submarket — average credit score on applications, eviction rate, late-payment / NSF rate, and stable-employment percentage? A property-management company in the area should have these aggregated.
- How much new for-sale + rental construction is in the pipeline within 1–3 miles? Heavy new supply typically softens prices + rents 12–24 months out; constrained supply supports both.
Investment metrics
- 1% rule
- 1.03% ✓
- Cap rate
- 7.70%
- Cash-on-cash
- 5.01%
- DSCR
- 1.22
- GRM
- 8.1
CMA / ARV
- ARV (on-the-fly)
- $402,960
- Comps found
- 1
Show comp detail 1 sale within ~0.75 mi
| Address | Dist | Beds/Ba | Sqft | Sold | Price | $/sf | Match |
|---|---|---|---|---|---|---|---|
| 430 Old Spanish Trl | 0.11mi | 3/1.5 | 938 (-14%) | 4mo | $345,000 | $368 | 66 |
Match score weights: distance 35% · size 25% · config 20% · recency 20%. Top-matched comps best support the ARV.
Projected returns pro-forma
-3.0% appreciation · 4.09% rent growth · sell at horizon
- IRR
- -7.3%
- Equity multiple
- 0.73×
- Total profit
- $-20,498
- Equity at exit
- $40,243
- IRR
- 3.7%
- Equity multiple
- 1.28×
- Total profit
- $21,170
- Equity at exit
- $23,336
Cash invested: $75,572 (down + closing). Projections, not guarantees.
Landlord ↔ Tenant lean methodology
- Overall (STATE)
- 87 Strongly Landlord-Friendly
- State Florida
- 87 Strongly Landlord-Friendly · R+3
- County
- — inherits STATE
- City
- — inherits STATE
ZIP-level market 33462
- Rents YoY
- 4.1%
- Active inventory
- 385
- Price-to-rent
- 8.1×
Monthly cashflow live
- Estimated rent
- $2,778 high interval (Pro) →
- Mortgage (P&I)
- −$1,415
- Tax from tax record
- −$351 /mo · $4,216/yr
- Insurance
- −$112
- HOA
- −$0
- Lot rent
- −$0
- Vacancy / Maint / Mgmt
- −$583
- Net cashflow
- $316
Break-even live
Sensitivity live
| Price | -10% $468 | -5% $392 | +0% $316 | +5% $239 | +10% $163 |
|---|---|---|---|---|---|
| Rent | -10% $96 | -5% $206 | +0% $316 | +5% $425 | +10% $535 |
| Rate | -1.0pp $452 | -0.5pp $384 | base $316 | +0.5pp $246 | +1.0pp $175 |
UW: 25.0% down · 7.5% · 30yr · 1.5% tax · 5.0% vac · 8.0% maint · 8.0% mgmt
Financing live
Cash to close
- Down payment
- $67,475
- Closing costs
- $8,097
- Reserves months
- —
- Total cash needed
- —
Loan-product check · same deal, 3 products live
Conventional
25% down · 7.5% · 30yr
- Down + closing
- —
- Monthly P&I
- —
- Monthly cashflow
- —
- DSCR
- —
- Eligible?
- —
Personal DTI + credit; lowest rate.
DSCR
20% down · 8.5% · 30yr
- Down + closing
- —
- Monthly P&I
- —
- Monthly cashflow
- —
- DSCR
- —
- Eligible?
- —
No personal income docs; deal must DSCR.
Hard money
10% down · 12.0% · 12mo
- Down + closing
- —
- Monthly P&I
- —
- Monthly cashflow
- —
- DSCR
- —
- Eligible?
- —
Short-term bridge; refi at stabilization.
Rent comps 40 comps
| Address | Beds | Baths | Sqft | Rent | $/sqft | DOM | Units | Dist |
|---|---|---|---|---|---|---|---|---|
| 191 Tulip Tree Dr Lantana, FL | 3.0 | 1.0 | 845 | $2,750 | $3.25 | 26d | 1 | 0.21mi |
| 3890 Seacrest Blvd Lantana, FL | 3.0 | 1.0 | 1248 | $2,750 | $2.20 | 26d | 1 | 0.27mi |
| 1400 S Broadway Lantana, FL | 2.0 | 1.0 | 846 | $1,850 | $2.19 | 26d | 1 | 0.39mi |
| 1097 Wilkinson Rd Unit B Lantana, FL | 2.0 | 1.0 | 855 | $2,200 | $2.57 | 4d | 1 | 0.45mi |
| 1097 Wilkinson Rd Unit B Lantana, FL | 2.0 | 1.0 | 855 | $2,200 | $2.57 | 4d | 1 | 0.45mi |
| 3265 E Palm Dr Boynton Beach, FL | 3.0 | 2.0 | 744 | $2,600 | $3.49 | 26d | 1 | 0.48mi |
| 1036 S 14th St Lantana, FL | 3.0 | 2.0 | 1362 | $3,500 | $2.57 | 26d | 1 | 0.55mi |
| 117 Yacht Club Way #110 Hypoluxo, FL | 2.0 | 2.5 | 1030 | $2,295 | $2.23 | 5d | 1 | 0.58mi |
| 103 Yacht Club Way Hypoluxo, FL | 2.0 | 1.0 | 922 | $2,175 | $2.36 | 10d | 2 | 0.58mi |
| 1236 Peak Rd Lantana, FL | 2.0 | 1.0 | 1170 | $2,150 | $1.84 | 26d | 1 | 0.60mi |
| 111 Yacht Club Way #107 Hypoluxo, FL | 2.0 | 2.0 | 1036 | $2,050 | $1.98 | 1d | 1 | 0.62mi |
| 1400 S Dixie Hwy Lantana, FL | 1.0–3.0 | 1.0–2.0 | 1166 | $4,827 | $4.14 | 5d | 16 | 0.62mi |
| 120 Yacht Club Way #305 Hypoluxo, FL | 2.0 | 2.0 | 1105 | $2,350 | $2.13 | 26d | 1 | 0.63mi |
| 123 Yacht Club Way #206 Hypoluxo, FL | 2.0 | 1.0 | 922 | $2,250 | $2.44 | 26d | 1 | 0.63mi |
| 1214 Highview Rd Lantana, FL | 3.0 | 2.0 | 768 | $2,300 | $2.99 | 4d | 1 | 0.65mi |
| 127 Yacht Club Way #109 Hypoluxo, FL | 2.0 | 2.5 | 1030 | $2,500 | $2.43 | 26d | 1 | 0.65mi |
| 1219 Highland Rd Lantana, FL | 3.0 | 2.0 | 744 | $2,350 | $3.16 | 1d | 1 | 0.67mi |
| 887 W Perry St Lantana, FL | 3.0 | 1.0 | 1055 | $3,000 | $2.84 | 26d | 1 | 0.67mi |
| 135 Yacht Club Way #204 Hypoluxo, FL | 2.0 | 1.0 | 922 | $2,600 | $2.82 | 4d | 1 | 0.68mi |
| 140 Yacht Club Way #206 Hypoluxo, FL | 2.0 | 2.0 | 1036 | $2,450 | $2.36 | 10d | 1 | 0.69mi |
| 110 Half Moon Cir Unit E2 Hypoluxo, FL | 2.0 | 2.0 | 1414 | $2,750 | $1.94 | 26d | 1 | 0.70mi |
| 145 Yacht Club Way #112 Hypoluxo, FL | 2.0 | 1.0 | 945 | $2,400 | $2.54 | 26d | 1 | 0.71mi |
| 887 Duval St Lantana, FL | 3.0 | 1.0 | 1261 | $3,100 | $2.46 | 10d | 1 | 0.71mi |
| 887 Duval St Lantana, FL | 3.0 | 1.0 | 1261 | $3,100 | $2.46 | 20d | 1 | 0.71mi |
| 157 Yacht Club Way #206 Hypoluxo, FL | 2.0 | 2.0 | 1036 | $2,500 | $2.41 | 15d | 1 | 0.71mi |
| 714 S Arnold Ave Unit B Lantana, FL | 2.0 | 1.0 | 858 | $2,200 | $2.56 | 26d | 1 | 0.71mi |
| 160 Yacht Club Way #206 Hypoluxo, FL | 2.0 | 2.0 | 1036 | $4,500 | $4.34 | 26d | 1 | 0.72mi |
| 157 Yacht Club Way Hypoluxo, FL | 2.0 | 1.0–2.0 | 979 | $2,450 | $2.50 | 4d | 2 | 0.72mi |
| 157 Yacht Club Way Hypoluxo, FL | 2.0 | 1.0–2.0 | 979 | $2,350 | $2.40 | 26d | 2 | 0.72mi |
| 200 Scotia Dr #202 Hypoluxo, FL | 3.0 | 2.0 | 1144 | $2,800 | $2.45 | 26d | 1 | 0.73mi |
| 917 W Drew St Lantana, FL | 3.0 | 2.0 | 1427 | $3,800 | $2.66 | 26d | 1 | 0.75mi |
| 531 W Perry St Lantana, FL | 2.0 | 1.0 | 1000 | $2,400 | $2.40 | 21d | 1 | 0.76mi |
| 605 S 12th St Lantana, FL | 2.0 | 1.0 | 700 | $1,950 | $2.79 | 6d | 1 | 0.77mi |
| 129 E Hart St Lantana, FL | 4.0 | 2.0 | 1480 | $6,000 | $4.05 | 26d | 1 | 0.77mi |
| 609 S Arnold Ave Lantana, FL | 2.0 | 2.0 | 1076 | $2,900 | $2.70 | 19d | 1 | 0.78mi |
| 1000 Scotia Dr #605 Hypoluxo, FL | 2.0 | 1.0 | 901 | $2,190 | $2.43 | 10d | 1 | 0.79mi |
| 400 Scotia Dr #203 Hypoluxo, FL | 3.0 | 2.0 | 1144 | $2,800 | $2.45 | 10d | 1 | 0.80mi |
| 112 Milton St Unit 114 Lantana, FL | 2.0 | 1.0 | 1245 | $2,500 | $2.01 | 10d | 1 | 0.80mi |
| 112 Milton St Unit 114 Lantana, FL | 2.0 | 1.0 | 1245 | $2,500 | $2.01 | 26d | 1 | 0.80mi |
| 977 Miner Rd Lantana, FL | 3.0 | 1.0 | 1100 | $3,195 | $2.90 | 4d | 1 | 0.80mi |
Listing history 16 events
-
2026-06-07statusdays on market $269,900 Pending 36 DOM
-
2026-06-04days on market $269,900 Active 35 DOM
-
2026-06-03days on market $269,900 Active 34 DOM
-
2026-06-02days on market $269,900 Active 33 DOM
-
2026-06-01days on market $269,900 Active 32 DOM
-
2026-05-31days on market $269,900 Active 31 DOM
-
2026-04-26$269,900 Active
-
2021-08-11soldstatus $160,000
-
2021-08-06soldstatus $160,000 Closed 575-char remark
Show marketing remark (575 chars)
Location, Potential, Opportunity! This diamond in the rough is ready for complete renovation, polish this gem up and back to her former glory. Great location easy access to 95, or Federal Hwy. This is a sweet house even the bees love it, be careful as there is a bee hive somewhere on the right side of the house. No power or water will be turned on here for inspections. Note tax records state the property is a 3/1. This is a Cash Only sale, buyer must sign a hold harmless and assume the illegal campers on the property and any and all violations that are on the property.
-
2021-07-23status Pending 575-char remark
Show marketing remark (575 chars)
Location, Potential, Opportunity! This diamond in the rough is ready for complete renovation, polish this gem up and back to her former glory. Great location easy access to 95, or Federal Hwy. This is a sweet house even the bees love it, be careful as there is a bee hive somewhere on the right side of the house. No power or water will be turned on here for inspections. Note tax records state the property is a 3/1. This is a Cash Only sale, buyer must sign a hold harmless and assume the illegal campers on the property and any and all violations that are on the property.
-
2021-07-21historical Active Under Contract 575-char remark
Show marketing remark (575 chars)
Location, Potential, Opportunity! This diamond in the rough is ready for complete renovation, polish this gem up and back to her former glory. Great location easy access to 95, or Federal Hwy. This is a sweet house even the bees love it, be careful as there is a bee hive somewhere on the right side of the house. No power or water will be turned on here for inspections. Note tax records state the property is a 3/1. This is a Cash Only sale, buyer must sign a hold harmless and assume the illegal campers on the property and any and all violations that are on the property.
-
2021-07-09$154,900 Active 575-char remark
Show marketing remark (575 chars)
Location, Potential, Opportunity! This diamond in the rough is ready for complete renovation, polish this gem up and back to her former glory. Great location easy access to 95, or Federal Hwy. This is a sweet house even the bees love it, be careful as there is a bee hive somewhere on the right side of the house. No power or water will be turned on here for inspections. Note tax records state the property is a 3/1. This is a Cash Only sale, buyer must sign a hold harmless and assume the illegal campers on the property and any and all violations that are on the property.
-
2014-10-20historical
-
2005-09-13$250,000
-
2002-03-04soldstatus $65,000
-
1981-10-01soldstatus $7,200
ⓘ Source: listings_history table (triggers on properties + properties_extension) + one-shot
backfill from property_details.listing_events for pre-trigger history.
Tax reassessment forecast FL · Resets to sale price
- Current annual tax
- $4,216 · $351/mo
- Projected year-2 tax
- $4,216 · $351/mo
- Expected delta
- $0/yr ($0/mo · 0.0%)
ⓘ Screening estimate from a state-policy table — verify with the county assessor before closing.
Climate risk First Street
- Flood 1/10 Low FEMA zone X (unshaded) · 0% chance over 30 yrs
- Wildfire 1/10 Low
- Heat 9/10 Extreme 7 d/yr ≥105°F today · 26 d/yr by 30 yrs out
- Wind 10/10 Extreme 99% chance of damaging wind over 30 yrs
- Air quality 2/10 Low 0 unhealthy d/yr today · 2 by 30 yrs out
Nearby sold comps map
Loading sold comps map…
Walkable amenities ~0.75 mi
Loading nearby amenities…
Taxation est. · year 1
- Rental income
- $33,340
- − Mortgage interest
- −$15,119
- − Property taxes
- −$4,216
- − Insurance
- −$1,350
- − Repairs & maintenance
- −$2,667
- − Management
- −$2,667
- − Depreciation
- −$7,852
- Taxable loss
- −$530
- Est. tax savings @ 24.0%
- +$127
- After-tax cash flow
- $3,916/yr
For passive investors: Depreciation is non-cash, so a rental often shows a tax loss while cash-flowing — sheltering income. Rental losses are passive: they offset passive income freely, and up to $25,000/yr can offset ordinary (W-2) income if you actively participate and your MAGI is under $100k (phasing out to $0 by $150k); unused losses carry forward. On sale, claimed depreciation is recaptured at up to 25%, and gains may owe capital-gains tax (a 1031 exchange can defer both). Figures are a year-1 estimate at your 24.0% rate — not tax advice; consult a CPA.
Schools (NCES district)
- District
- Palm Beach
- NCES district ID
- 1201500
- Math proficiency
- 46% ▼ -16.00%
- Reading proficiency
- 53% ▼ -4.00%
- Median HH income
- $53,943
- Composite
- 42.72/100
- National rank
- #3160
- State rank
- #34 of 73 in FL
Livability — San Castle
- Score
- 67/100
- State rank
- #560
- US rank
- #10706
Category grades
Schools grade is shown separately in the Schools card above.
Census & demographics
- Census place
- San Castle, FL
- County
- Palm Beach County · 1,438,312 people
- Metro
- Miami-Fort Lauderdale-Pompano Beach, FL
- Population (ZIP)
- 33,371
- Household income
- $73,997
- Rent vs Own
- Severe rent burden
- 1852.0
Population outlook (Palm Beach County) Hauer SSP2
- Today (2025)
- 1,637,487 people
- By 2030
- 1,743,255 · +6.5%
- By 2040
- 1,948,712 · +19.0%
- By 2050
- 2,132,979 · +30.3%
- By 2075
- 2,530,027 · +54.5%
- By 2100
- 2,706,979 · +65.3%
Race, ethnicity, and origin ACS 2023
- Neighborhood character
- Diverse neighborhood (Simpson 0.68)
- Race & ethnicity
- White 44% Black 26% Hispanic / Latino 26% Two or more races 11% Asian 2%
- Hispanic origin (detail)
- Mexican 8% Puerto Rican 5% Cuban 3%
- Common ancestry
- Hispanic 14% Romanian 2% Scotch-Irish 2%
- Foreign-born
- 31% · Canada, Jamaica, Dominican Republic
- Languages at home
- 60% English-only · Spanish 20% French/Haitian/Cajun 16% Other Indo-European 1%
Political lean MEDSL · Palm Beach
- 2024 margin
- Toss-up / Even · D 50.0% · R 49.2%
- 2008→2024 swing
- -22.1pp toward R · 2008: 22.9pp · 2024: 0.8pp
- All cycles
- 2024: D+0.8 2020: D+12.8 2016: D+15.3 2012: D+17.0 2008: D+22.9
Not yet ingested
- Civics
- —
Market trends
- HPI YoY
- ▼ -295.48%
- Current HPI
- 361.5391
- Rent YoY
- ▲ 4.09%
- Metro
- Miami-Fort Lauderdale-Pompano Beach, FL
- State GDP YoY
- ▲ 3.28%
- F500 in state
- 36
Industry mix (Fortune 500 HQ in FL)
| Industry | F500 HQs | Revenue |
|---|---|---|
| Industrial Technology | 2 | $29B |
|
||
| Insurance | 2 | $17B |
|
||
| Retail | 1 | $60B |
|
||
| Technology Distribution | 1 | $58B |
|
||
| Homebuilding | 1 | $35B |
|
||
| Technology Manufacturing | 1 | $35B |
|
||
Price history
+3648.6% since first listed10 events — show timeline
- 2026-04-26 Listed $269,900 Beaches MLS
- 2021-08-11 Sold (Public Records) $160,000 Public Records
- 2021-08-06 Sold (MLS) $160,000 Beaches MLS
- 2021-07-23 Pending — Beaches MLS
- 2021-07-21 Contingent — Beaches MLS
- 2021-07-09 Listed $154,900 Beaches MLS
- 2014-10-20 Listing Removed — Beaches MLS
- 2005-09-13 Listed $250,000 Beaches MLS
- 2002-03-04 Sold (Public Records) $65,000 Public Records
- 1981-10-01 Sold (Public Records) $7,200 Public Records
Property tax history
+20.4%/yrLatest (2025): $4,216 · +9.5% YoY. Source: county tax records.
Cash-flow waterfall
monthlySold comps — $/sqft
last 12 mo · ≤1 miLoading sold comps…