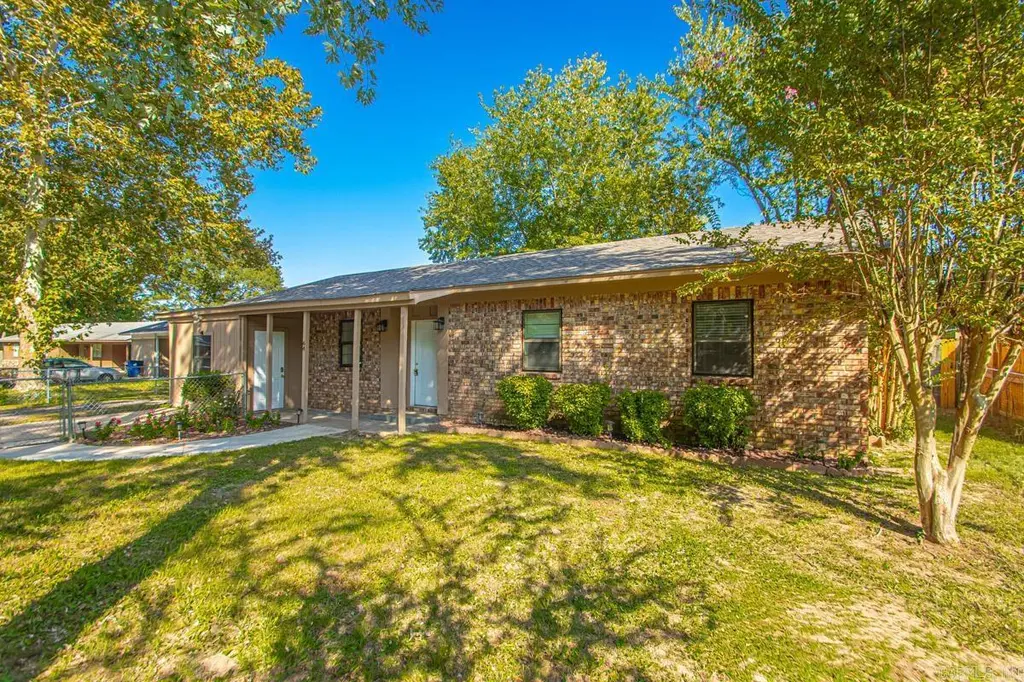
64 St. John · Cabot, AR
Flood risk 1/10 · Minimal
- FEMA flood zone
- X (unshaded)
- Chance of flooding over 30 yrs
- 0.0%
- Est. flood insurance / yr
- $507 – $1,088
Fire risk 4/10 · Minor
- Est. fire insurance / yr
- $1,499 – $2,785
Heat risk 6/10 · Moderate
- Hot days now (above 109°F)
- 7 days/yr
- Hot days in 30 yrs
- 18 days/yr
Wind risk 3/10 · Minor
- Chance of severe wind over 30 yrs
- 8.0%
Air-quality risk 2/10 · Minimal
- Unhealthy air days now
- 1 days/yr
- Unhealthy air days in 30 yrs
- 1 days/yr
Risk factors via First Street. Map © Google.
Why this score? — see what drove the D+ grade
The composite is a weighted blend of 9 inputs, each scored 0–100. Each bar is that input's sub-score; the figure is the points it added to the 100-point composite (weight × sub-score).
- ARV discount +14.3/15.0
- Cash flow +11.7/30.0
- Schools +4.0/10.0
- Livability +3.9/5.0
- DSCR +3.5/10.0
- 1% rule +3.4/10.0
- Rent growth +3.3/5.0
- Condition / age +2.5/5.0
- Appreciation +0.0/10.0
$185,000
🖨 Deal sheet 📄 Offer letter ✓ Due diligence
Listing remarks MLS
Perfectly remodeled 3bed 1-1/2 located in a quiet cul de sac, Front porch greats you, entry offers coat closet & laminate flooring. Living room/dinning, & kitchen are all open concept. Kitchen offers island/pantry & built in desk. Full bath is located in the hallway while the 1/2 bath is in the MSTR BR! Newer flooring/newer paint/new kit counters/new bathroom sinks, new mirrors & fixtures/new stove/new roof. Bonus room/flex room or 4th BR!! plus an in-ground storm shelter! Completely fenced yard!! Call today!
Key facts
- New sidewalks
- Updated interior
- New fixtures
Tags
Property features AI
Finance
- Financial info: Accepts VA, FHA, conventional loans and cash
Exterior
- Parking: Parking for 4+ cars
- Security: Safe/Storm room
- Utilities: Public water; Public sewer
- Home design: Brick and frame combination exterior
- Construction: Composition roof; Slab foundation
- Exterior features: Fully fenced yard; Outside storage area; Storm cellar; Paved road access; Level lot; Located on a cul-de-sac; In a subdivision
Interior
- Kitchen: Free-standing stove; Electric range; Dishwasher; Disposal
- Flooring: Tile; Luxury vinyl
- Bathrooms: 2 full bathrooms
- Heating & cooling: Central electric heating; Central electric cooling
- Interior features: Tile and luxury vinyl flooring; Den/Family room; Office/Study; Bonus room; Safe/Storm room
- Laundry & utility: Laundry room
Neighborhood map
What this means for you Summary
Snapshot
- This is a 4-bed/1.5-bath single-family listed at $185k.
Deal economics
- At list price, monthly cash flow is $-53 ($-640/yr) — negative.
- To cash-flow at today's rent, offer at most $177k (4.2% below list).
- To meet the 1% rule (rent ≥ 1% of price), the offer needs to be $155k (16.2% below list).
- Recommended offer: $155k (16.2% below list) — sets the bar for 1% rule.
- Cap rate 5.9% vs local median 4.6% in Cabot — top-decile yield for the area; either an underpriced asset or a hidden risk that comps aren't pricing in. Stress-test before assuming the spread holds.
Location & tenants
- Location reads 78/100 on livability (#6 in AR, #2,695 nationally) — a middle-class / working-renter tenant base. Strengths: cost of living A+, housing A+, health & safety A+; Watch: commute F.
- Cabot School District (suburban): math 48% / reading 43% proficiency, ranked #29 of 238 in AR (top 12%) — families likely to look elsewhere, expect single-tenant / working-renter base with shorter leases.
- Market conditions: Rents rising (+3.2%/yr); 334 active listings in the ZIP; 10 comparable units currently listed for rent nearby; rentals at typical pace (median 24d on market — plan ~3-4 weeks tenant-placement turnaround); solid renter incomes; 185 units permitted in Lonoke County in 2024 (0 in 5+ unit buildings).
Forward outlook
- Local home prices are declining (-3.0%/yr); year-one equity from $1k of loan paydown is wiped out by about $6k of value loss. Plan a longer hold.
- Lonoke County population projected at +12% by 2050 — modest demand growth; plan on rents tracking national, not racing it.
Negotiation context
- It's been on market 48 days — a 3% lower offer ($179k) is reasonable based on typical stale-listing flexibility.
- 6 sale attempts since 17y ago; this cycle's ask has dropped $10k (5%) from the opening price — seller is motivated, your offer sets the floor, not the list.
- Current owner paid $110k; list at $185k implies a 69% gain — meaningful room to come down on a strong offer.
Risks & watch-outs
- Climate carrying-cost: extreme-heat days projected 7→18/yr by 2055 (HVAC capex compounding) — expect insurance premiums to compound above CPI over the hold.
Questions for the listing agent
- What do current leases actually rent for vs. the listed asking? Can we see a recent rent roll and the last 12 months of T-12 income?
- It's been on market 48 days. Have you received any prior offers? Is the seller open to a 16% concession, seller financing, or rate buy-down credit?
- Is there a deadline driving the sale (1031 exchange, divorce, estate, relocation)? That informs how much negotiation room exists.
- The area grade is low — what's the realistic commute time and amenity access for the typical tenant pool here? Any planned neighborhood developments (good or bad) we should know about?
- What's the average days-on-market for RENTAL listings here right now (not sales)? A rising rental-DOM trend means longer vacancies and softer asking-rent achievability than the comps imply.
- What's the recent tenant-quality profile in this submarket — average credit score on applications, eviction rate, late-payment / NSF rate, and stable-employment percentage? A property-management company in the area should have these aggregated.
- How much new for-sale + rental construction is in the pipeline within 1–3 miles? Heavy new supply typically softens prices + rents 12–24 months out; constrained supply supports both.
Investment metrics
- 1% rule
- 0.84% ✗
- Cap rate
- 5.95%
- Cash-on-cash
- -1.24%
- DSCR
- 0.95
- GRM
- 9.9
CMA / ARV
- ARV (on-the-fly)
- $218,016
- Comps found
- 12
Show comp detail 12 sales within ~0.75 mi
| Address | Dist | Beds/Ba | Sqft | Sold | Price | $/sf | Match |
|---|---|---|---|---|---|---|---|
| 64 St. John | 0.00mi | 4/2.0 | 1,528 (+1%) | 0mo | $185,000 | $121 | 96 |
| 408 Waymack Dr | 0.17mi | 3/2.0 (-1) | 1,526 (+1%) | 1mo | $50,000 | $33 | 83 |
| 30 Park Cir | 0.31mi | 4/2.0 | 1,531 (+1%) | 2mo | $196,500 | $128 | 80 |
| 206 Rodney Guthrie Dr | 0.13mi | 3/2.0 (-1) | 1,444 (-5%) | 1mo | $208,500 | $144 | 78 |
| 12 Bellaire Dr | 0.11mi | 4/2.0 | 1,637 (+8%) | 2mo | $219,900 | $134 | 78 |
| 504 Dakota Dr | 0.50mi | 3/2.0 (-1) | 1,509 (-0%) | 0mo | $225,000 | $149 | 69 |
| 212 Rodney Guthrie Dr | 0.16mi | 3/2.0 (-1) | 1,346 (-11%) | 1mo | $176,000 | $131 | 66 |
| 403 Dakota Dr | 0.41mi | 3/2.0 (-1) | 1,585 (+5%) | 1mo | $229,500 | $145 | 65 |
| 26 Nevada Ln | 0.40mi | 3/2.0 (-1) | 1,641 (+8%) | 2mo | $245,000 | $149 | 59 |
| 39 Nevada Ln | 0.29mi | 3/2.0 (-1) | 1,320 (-13%) | 3mo | $205,000 | $155 | 56 |
| 21 Silverado Ct | 0.41mi | 3/2.0 (-1) | 1,321 (-13%) | 2mo | $190,000 | $144 | 51 |
| 410 W Locust St | 0.73mi | 4/2.0 | 1,326 (-12%) | 1mo | $179,900 | $136 | 43 |
Match score weights: distance 35% · size 25% · config 20% · recency 20%. Top-matched comps best support the ARV.
Projected returns pro-forma
-3.0% appreciation · 3.19% rent growth · sell at horizon
- IRR
- -18.1%
- Equity multiple
- 0.36×
- Total profit
- $-33,054
- Equity at exit
- $27,584
- IRR
- -10.0%
- Equity multiple
- 0.39×
- Total profit
- $-31,837
- Equity at exit
- $15,995
Cash invested: $51,800 (down + closing). Projections, not guarantees.
Landlord ↔ Tenant lean methodology
- Overall (STATE)
- 92 Strongly Landlord-Friendly
- State Arkansas
- 92 Strongly Landlord-Friendly · R+14
- County
- — inherits STATE
- City
- — inherits STATE
ZIP-level market 72023
- Home prices YoY
- -13.8%
- Rents YoY
- 3.2%
- Active inventory
- 334
- Price-to-rent
- 9.9×
Monthly cashflow live
- Estimated rent
- $1,551 high interval (Pro) →
- Mortgage (P&I)
- −$970
- Tax est. 1.5%
- −$231 /mo · $2,775/yr
- Insurance
- −$77
- HOA
- −$0
- Vacancy / Maint / Mgmt
- −$326
- Net cashflow
- $-53
Break-even live
UW: 25.0% down · 7.5% · 30yr · 1.5% tax · 5.0% vac · 8.0% maint · 8.0% mgmt
Financing live
Cash to close
- Down payment
- $46,250
- Closing costs
- $5,550
- Reserves months
- —
- Total cash needed
- —
Loan-product check · same deal, 3 products live
Conventional
25% down · 7.5% · 30yr
- Down + closing
- —
- Monthly P&I
- —
- Monthly cashflow
- —
- DSCR
- —
- Eligible?
- —
Personal DTI + credit; lowest rate.
DSCR
20% down · 8.5% · 30yr
- Down + closing
- —
- Monthly P&I
- —
- Monthly cashflow
- —
- DSCR
- —
- Eligible?
- —
No personal income docs; deal must DSCR.
Hard money
10% down · 12.0% · 12mo
- Down + closing
- —
- Monthly P&I
- —
- Monthly cashflow
- —
- DSCR
- —
- Eligible?
- —
Short-term bridge; refi at stabilization.
Rent comps 10 comps
| Address | Beds | Baths | Sqft | Rent | $/sqft | DOM | Units | Dist |
|---|---|---|---|---|---|---|---|---|
| 405 Waymack Dr Cabot, AR | 3.0 | 2.0 | 1300 | $1,450 | $1.12 | 14d | 1 | 0.10mi |
| 506 Waymack Cv Cabot, AR | 3.0 | 2.0 | 1165 | $1,450 | $1.24 | 23d | 1 | 0.14mi |
| 28 Park Cir Cabot, AR | 3.0 | 2.0 | 1312 | $1,325 | $1.01 | 23d | 1 | 0.27mi |
| 29 Burns Dr Cabot, AR | 3.0 | 2.0 | 1185 | $1,325 | $1.12 | 23d | 1 | 0.58mi |
| 13 Pheasant Run Dr Cabot, AR | 3.0 | 1.5 | 1162 | $1,245 | $1.07 | 23d | 1 | 0.64mi |
| 47 Pheasant Run Dr Cabot, AR | 3.0 | 1.0 | 1211 | $1,100 | $0.91 | 14d | 1 | 0.78mi |
| 35 Pheasant Run Dr Cabot, AR | 3.0 | 1.0 | 1185 | $1,250 | $1.05 | 23d | 1 | 0.82mi |
| 15 Amy St Cabot, AR | 3.0 | 2.0 | 1687 | $1,800 | $1.07 | 23d | 1 | 0.90mi |
| 400 Northport Dr Cabot, AR | 2.0–3.0 | 1.0–2.0 | 991 | $1,223 | $1.23 | 14d | 16 | 1.04mi |
| 17 Pleasant St Cabot, AR | 3.0 | 2.0 | 1306 | $1,250 | $0.96 | 23d | 1 | 1.23mi |
Listing history 24 events
-
2026-05-10status Under Contract
-
2026-04-21price $185,000
-
2026-03-23$194,900 New Listing
-
2026-03-21historical
-
2026-03-12price $194,900
-
2025-12-10price $199,900
-
2025-10-24price $210,000
-
2025-10-16price $220,000
-
2025-10-14price $230,000
-
2025-10-09$244,000 New Listing
-
2019-04-25soldstatus $109,500
-
2019-04-24soldstatus $109,500 Sold 537-char remark
Show marketing remark (537 chars)
Perfectly remodeled 3bed 1-1/2 located in a quiet cul de sac, Front porch greats you, entry offers coat closet & laminate flooring. Living room/dinning, & kitchen are all open concept. Kitchen offers island/pantry & built in desk. Full bath is located in the hallway while the 1/2 bath is in the MSTR BR! Newer flooring/newer paint/new kit counters/new bathroom sinks, new mirrors & fixtures/new stove/new roof. Bonus room/flex room or 4th BR!! plus an in-ground storm shelter! Completely fenced yard!! Call today!
-
2019-04-01status Under Contract 537-char remark
Show marketing remark (537 chars)
Perfectly remodeled 3bed 1-1/2 located in a quiet cul de sac, Front porch greats you, entry offers coat closet & laminate flooring. Living room/dinning, & kitchen are all open concept. Kitchen offers island/pantry & built in desk. Full bath is located in the hallway while the 1/2 bath is in the MSTR BR! Newer flooring/newer paint/new kit counters/new bathroom sinks, new mirrors & fixtures/new stove/new roof. Bonus room/flex room or 4th BR!! plus an in-ground storm shelter! Completely fenced yard!! Call today!
-
2019-03-26$109,500 New Listing 537-char remark
Show marketing remark (537 chars)
Perfectly remodeled 3bed 1-1/2 located in a quiet cul de sac, Front porch greats you, entry offers coat closet & laminate flooring. Living room/dinning, & kitchen are all open concept. Kitchen offers island/pantry & built in desk. Full bath is located in the hallway while the 1/2 bath is in the MSTR BR! Newer flooring/newer paint/new kit counters/new bathroom sinks, new mirrors & fixtures/new stove/new roof. Bonus room/flex room or 4th BR!! plus an in-ground storm shelter! Completely fenced yard!! Call today!
-
2017-11-20historical
-
2017-10-27price $108,900
-
2017-10-04$109,500 New Listing
-
2014-04-07historical
-
2014-04-01$92,000
-
2009-03-04soldstatus $80,000
-
2009-03-02soldstatus $79,900
-
2009-02-15historical
-
2009-01-20$89,900
-
1988-05-24soldstatus $40,000
ⓘ Source: listings_history table (triggers on properties + properties_extension) + one-shot
backfill from property_details.listing_events for pre-trigger history.
Climate risk First Street
- Flood 1/10 Low FEMA zone X (unshaded) · 0% chance over 30 yrs
- Wildfire 4/10 Moderate
- Heat 6/10 Major 7 d/yr ≥109°F today · 18 d/yr by 30 yrs out
- Wind 3/10 Moderate 8% chance of damaging wind over 30 yrs
- Air quality 2/10 Low 1 unhealthy d/yr today · 1 by 30 yrs out
Nearby sold comps map
Loading sold comps map…
Walkable amenities ~0.75 mi
Loading nearby amenities…
Taxation est. · year 1
- Rental income
- $18,610
- − Mortgage interest
- −$10,363
- − Property taxes
- −$2,775
- − Insurance
- −$925
- − Repairs & maintenance
- −$1,489
- − Management
- −$1,489
- − Depreciation
- −$5,382
- Taxable loss
- −$3,812
- Est. tax savings @ 24.0%
- +$915
- After-tax cash flow
- $275/yr
For passive investors: Depreciation is non-cash, so a rental often shows a tax loss while cash-flowing — sheltering income. Rental losses are passive: they offset passive income freely, and up to $25,000/yr can offset ordinary (W-2) income if you actively participate and your MAGI is under $100k (phasing out to $0 by $150k); unused losses carry forward. On sale, claimed depreciation is recaptured at up to 25%, and gains may owe capital-gains tax (a 1031 exchange can defer both). Figures are a year-1 estimate at your 24.0% rate — not tax advice; consult a CPA.
Schools (NCES district)
- District
- Cabot School District
- NCES district ID
- 0503750
- Math proficiency
- 48% ▼ -14.00%
- Reading proficiency
- 43% ▼ -10.00%
- Median HH income
- $55,993
- Composite
- 39.66/100
- National rank
- #3912
- State rank
- #29 of 238 in AR
Livability — Cabot
- Score
- 78/100
- State rank
- #6
- US rank
- #2695
Category grades
Schools grade is shown separately in the Schools card above.
Census & demographics
- Census place
- Cabot, AR
- County
- Lonoke County · 46,130 people
- City population
- 37,452
- Metro
- Little Rock-North Little Rock-Conway, AR
- Population (ZIP)
- 37,452
- Household income
- $76,931
- Rent vs Own
- Severe rent burden
- 939.0
Population outlook (Lonoke County) Hauer SSP2
- Today (2025)
- 78,072 people
- By 2030
- 80,673 · +3.3%
- By 2040
- 84,977 · +8.8%
- By 2050
- 87,778 · +12.4%
- By 2075
- 91,398 · +17.1%
- By 2100
- 87,858 · +12.5%
Race, ethnicity, and origin ACS 2023
- Neighborhood character
- Predominantly White (85%)
- Race & ethnicity
- White 85% Two or more races 6% Hispanic / Latino 5% Black 4% Asian 2%
- Common ancestry
- Italian 2% Lithuanian 2% Serbian 1%
- Foreign-born
- 3% · Canada, Vietnam
- Languages at home
- 96% English-only · Spanish 2%
Political lean MEDSL · Lonoke
- 2024 margin
- Solid R (+53.7) · D 22.2% · R 75.8% · Other 2.0%
- 2008→2024 swing
- -6.2pp toward R · 2008: -47.5pp · 2024: -53.7pp
- All cycles
- 2024: R+53.7 2020: R+52.8 2016: R+53.3 2012: R+50.9 2008: R+47.5
Not yet ingested
- Civics
- —
Market trends
- HPI YoY
- ▼ -29.12%
- Current HPI
- 182.3489
- Rent YoY
- ▲ 3.19%
- Metro
- Little Rock-North Little Rock-Conway, AR
- State GDP YoY
- ▲ 3.80%
- F500 in state
- 10
Industry mix (Fortune 500 HQ in AR)
| Industry | F500 HQs | Revenue |
|---|---|---|
| Retail | 1 | $681B |
|
||
| Food / Agriculture | 1 | $53B |
|
||
| Retail / Energy | 1 | $22B |
|
||
| Transportation / Logistics | 1 | $12B |
|
||
| Energy | 1 | $4B |
|
||
Price history
+362.5% since first listed24 events — show timeline
- 2026-05-10 Pending — CARMLS
- 2026-04-21 Price Changed $185,000 CARMLS
- 2026-03-23 Listed $194,900 CARMLS
- 2026-03-21 Listing Removed — CARMLS
- 2026-03-12 Price Changed $194,900 CARMLS
- 2025-12-10 Price Changed $199,900 CARMLS
- 2025-10-24 Price Changed $210,000 CARMLS
- 2025-10-16 Price Changed $220,000 CARMLS
- 2025-10-14 Price Changed $230,000 CARMLS
- 2025-10-09 Listed $244,000 CARMLS
- 2019-04-25 Sold (Public Records) $109,500 Public Records
- 2019-04-24 Sold (MLS) $109,500 CARMLS
- 2019-04-01 Pending — CARMLS
- 2019-03-26 Listed $109,500 CARMLS
- 2017-11-20 Listing Removed — CARMLS
- 2017-10-27 Price Changed $108,900 CARMLS
- 2017-10-04 Listed $109,500 CARMLS
- 2014-04-07 Listing Removed — CARMLS
- 2014-04-01 Listed $92,000 CARMLS
- 2009-03-04 Sold (Public Records) $80,000 Public Records
- 2009-03-02 Sold (MLS) $79,900 CARMLS
- 2009-02-15 Listing Removed — CARMLS
- 2009-01-20 Listed $89,900 CARMLS
- 1988-05-24 Sold (Public Records) $40,000 Public Records
Property tax history
-2.2%/yrLatest (2025): $315 · -24.1% YoY. Source: county tax records.
Cash-flow waterfall
monthlySold comps — $/sqft
last 12 mo · ≤1 miLoading sold comps…