 Triplex
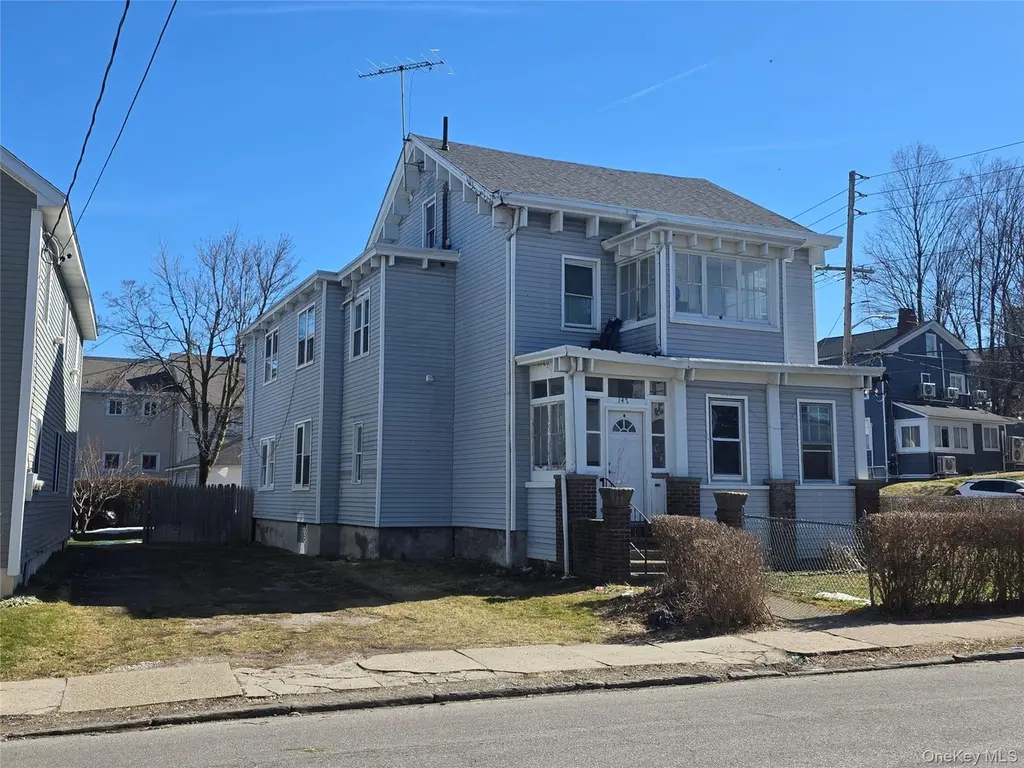
147 Union Ave · Peekskill, NY
Flood risk 1/10 · Minimal
- FEMA flood zone
- X (unshaded)
- Chance of flooding over 30 yrs
- 0.0%
- Est. flood insurance / yr
- $507 – $1,088
Fire risk 4/10 · Minor
- Est. fire insurance / yr
- $691 – $1,283
Heat risk 6/10 · Moderate
- Hot days now (above 99°F)
- 7 days/yr
- Hot days in 30 yrs
- 15 days/yr
Wind risk 4/10 · Minor
- Chance of severe wind over 30 yrs
- 17.0%
Air-quality risk 3/10 · Minor
- Unhealthy air days now
- 2 days/yr
- Unhealthy air days in 30 yrs
- 4 days/yr
Risk factors via First Street. Map © Google.
Why this score? — see what drove the C+ grade
The composite is a weighted blend of 9 inputs, each scored 0–100. Each bar is that input's sub-score; the figure is the points it added to the 100-point composite (weight × sub-score).
- Cash flow +21.6/30.0
- ARV discount +15.0/15.0
- DSCR +6.9/10.0
- 1% rule +6.5/10.0
- Livability +4.0/5.0
- Schools +3.5/10.0
- Rent growth +2.5/5.0
- Condition / age +2.5/5.0
- Appreciation +0.0/10.0
$899,000
🖨 Deal sheet 📄 Offer letter ✓ Due diligence
Multi-family units
County records classify this as Multi-Family (2-4 Unit). Listing-text estimate: 3 units. confirmed
Listing remarks MLS
Large income-producing 3-family property in a prime Peekskill location within walking distance to downtown, restaurants, shops, bus and Metro-North train station. This well-maintained multi-family offers a great opportunity for an owner-occupant or investor with strong rental income and additional upside. The property features a spacious 3-bedroom unit plus two 1-bedroom units, a full walk-up attic offering flexible space for office, studio or storage, and a rare 3-car garage with additional off-street parking. Separate utilities for most units and a recently replaced roof add to the value. With solid rental income, ample parking, and a highly walkable location, this property presents an excellent opportunity for long-term investment or owner-occupied living with rental income to offset expenses.
Key facts
- Full walk up attic
- Prime location
- Rare 3 car garage
Tags
Neighborhood map
What this means for you Summary
Snapshot
- This is a 3 × 5-bed/3.0-bath units multifamily listed at $899k.
Deal economics
- At list price, monthly cash flow is $1k ($16k/yr) — positive. Per door: $454/mo.
- The deal already cash-flows at list — no discount required.
- Meets the 1% rule at list price ($10k rent vs $899k).
- Recommended offer: $845k (6.0% below list) — sets the bar for market timing.
- Cap rate 8.1% vs local median 3.2% in Peekskill — top-decile yield for the area; either an underpriced asset or a hidden risk that comps aren't pricing in. Stress-test before assuming the spread holds.
Location & tenants
- Location reads 79/100 on livability (#132 in NY, #2,121 nationally) — a middle-class / working-renter tenant base. Strengths: commute A+, health & safety A+, crime A-; Watch: schools C-, amenities F, cost of living F.
- Peekskill City School District (suburban): math 37% / reading 36% proficiency, ranked #670 of 755 in NY (top 89%) — families likely to look elsewhere, expect single-tenant / working-renter base with shorter leases; 64% free/reduced lunch — lower-income household profile, screen leases tightly.
- Market conditions: Rents flat; 117 active listings in the ZIP; solid renter incomes; 954 units permitted in Westchester County in 2024 (649 in 5+ unit buildings).
- At $10,298/mo this rent would consume 144% of the median local household income ($86k/yr) (locally 1507% of renters already pay >50% of income on rent) — very limited rent-growth headroom before tenants either downsize or default.
Forward outlook
- Local home prices are declining (-3.0%/yr); year-one equity from $6k of loan paydown is wiped out by about $27k of value loss. Plan a longer hold.
- Westchester County population projected at +10% by 2050 — modest demand growth; plan on rents tracking national, not racing it.
Negotiation context
- It's been on market 65 days — a 6% lower offer ($845k) is reasonable based on typical stale-listing flexibility.
- 4 sale attempts since 22y ago with the ask held roughly flat each time — persistent listings suggest the price (not the market) is what's stuck; bring a comps-based counter.
- Current owner paid $210k; list at $899k implies a 328% gain — meaningful room to come down on a strong offer.
Risks & watch-outs
- Watch-outs: built in 1880 — expect roof / HVAC / electrical / plumbing capex.
- Climate carrying-cost: extreme-heat days projected 7→15/yr by 2055 (HVAC capex compounding) — expect insurance premiums to compound above CPI over the hold.
Questions for the listing agent
- It's been on market 65 days. Have you received any prior offers? Is the seller open to a 6% concession, seller financing, or rate buy-down credit?
- Can we see the unit-by-unit rent roll, current vacancy, and any below-market leases? What's the average tenancy length?
- What capital expenditures (roof, boiler, parking lot, exteriors) have been made in the last 5 years, and what's planned in the next 2?
- Built in 1880 — when were the roof, HVAC, electrical panel, plumbing, and water heater last replaced?
- Why hasn't it sold? Are there any deal-killer items the seller is aware of (foundation, flood, title, zoning, code violations)?
- Is there a deadline driving the sale (1031 exchange, divorce, estate, relocation)? That informs how much negotiation room exists.
- What's the average days-on-market for RENTAL listings here right now (not sales)? A rising rental-DOM trend means longer vacancies and softer asking-rent achievability than the comps imply.
- What's the recent tenant-quality profile in this submarket — average credit score on applications, eviction rate, late-payment / NSF rate, and stable-employment percentage? A property-management company in the area should have these aggregated.
- How much new apartment / multifamily construction is in the pipeline within 1–3 miles? Heavy new supply (>2% of stock underway) typically softens rents 12–24 months out; light construction supports rent growth.
Investment metrics
- 1% rule
- 1.15% ✓
- Cap rate
- 8.11%
- Cash-on-cash
- 6.50%
- DSCR
- 1.29
- GRM
- 7.3
CMA / ARV
- ARV (median comp)
- $1,212,873
- List price
- $899,000
- Delta
- -25.88%
- Verdict
- UNDERPRICED
- Comps
- 20 within 1.0 mi
Projected returns pro-forma
-3.0% appreciation · 0.12% rent growth · sell at horizon
- IRR
- -9.8%
- Equity multiple
- 0.65×
- Total profit
- $-87,372
- Equity at exit
- $134,044
- IRR
- -5.3%
- Equity multiple
- 0.70×
- Total profit
- $-74,633
- Equity at exit
- $77,729
Cash invested: $251,720 (down + closing). Projections, not guarantees.
Landlord ↔ Tenant lean methodology
- Overall (STATE)
- 15 Strongly Tenant-Friendly
- State New York
- 15 Strongly Tenant-Friendly · D+10
- County
- — inherits STATE
- City
- — inherits STATE
ZIP-level market 10566
- Home prices YoY
- -23.9%
- Rents YoY
- 0.1%
- Active inventory
- 117
- Price-to-rent
- 21.8×
Monthly cashflow live
- Estimated rent
- $10,298 medium interval (Pro) →
- Mortgage (P&I)
- −$4,714
- Tax from tax record
- −$1,683 /mo · $20,200/yr
- Insurance
- −$375
- HOA
- −$0
- Vacancy / Maint / Mgmt
- −$2,163
- Net cashflow
- $1,363
Break-even live
3-unit breakdown (identical units grouped — click to expand)
| Units | Beds | Baths | Est. rent |
|---|---|---|---|
| 3× units | 5 | 3 | $10,299 |
| #1 | 5 | 3 | $3,433 |
| #2 | 5 | 3 | $3,433 |
| #3 | 5 | 3 | $3,433 |
| Total (3 units) | $10,298 | ||
UW: 25.0% down · 7.5% · 30yr · 1.5% tax · 5.0% vac · 8.0% maint · 8.0% mgmt
Financing live
Cash to close
- Down payment
- $224,750
- Closing costs
- $26,970
- Reserves months
- —
- Total cash needed
- —
Loan-product check · same deal, 3 products live
Conventional
25% down · 7.5% · 30yr
- Down + closing
- —
- Monthly P&I
- —
- Monthly cashflow
- —
- DSCR
- —
- Eligible?
- —
Personal DTI + credit; lowest rate.
DSCR
20% down · 8.5% · 30yr
- Down + closing
- —
- Monthly P&I
- —
- Monthly cashflow
- —
- DSCR
- —
- Eligible?
- —
No personal income docs; deal must DSCR.
Hard money
10% down · 12.0% · 12mo
- Down + closing
- —
- Monthly P&I
- —
- Monthly cashflow
- —
- DSCR
- —
- Eligible?
- —
Short-term bridge; refi at stabilization.
Listing history 13 events
-
2026-03-24$899,000 Active 809-char remark
Show marketing remark (809 chars)
Large income-producing 3-family property in a prime Peekskill location within walking distance to downtown, restaurants, shops, bus and Metro-North train station. This well-maintained multi-family offers a great opportunity for an owner-occupant or investor with strong rental income and additional upside. The property features a spacious 3-bedroom unit plus two 1-bedroom units, a full walk-up attic offering flexible space for office, studio or storage, and a rare 3-car garage with additional off-street parking. Separate utilities for most units and a recently replaced roof add to the value. With solid rental income, ample parking, and a highly walkable location, this property presents an excellent opportunity for long-term investment or owner-occupied living with rental income to offset expenses.
-
2015-06-19price $210,000 105-char remark
Show marketing remark (105 chars)
Great Investment opportunity for investor or first time home buyer. Don't miss this bank short sale deal.
-
2015-06-19soldstatus $210,000 Sold 105-char remark
Show marketing remark (105 chars)
Great Investment opportunity for investor or first time home buyer. Don't miss this bank short sale deal.
-
2015-02-23soldstatus $210,000
-
2015-02-23soldstatus $210,000
-
2014-01-27price $399,999
-
2013-08-02historical Pending 105-char remark
Show marketing remark (105 chars)
Great Investment opportunity for investor or first time home buyer. Don't miss this bank short sale deal.
-
2013-08-02price $299,000 105-char remark
Show marketing remark (105 chars)
Great Investment opportunity for investor or first time home buyer. Don't miss this bank short sale deal.
-
2013-05-07$299,000 Active 105-char remark
Show marketing remark (105 chars)
Great Investment opportunity for investor or first time home buyer. Don't miss this bank short sale deal.
-
2013-05-07$299,000
Show marketing remark (105 chars)
Great Investment opportunity for investor or first time home buyer. Don't miss this bank short sale deal.
-
2004-06-17soldstatus $445,000
-
2004-04-21historical
-
2004-03-26$445,000
ⓘ Source: listings_history table (triggers on properties + properties_extension) + one-shot
backfill from property_details.listing_events for pre-trigger history.
Tax reassessment forecast NY · Partial reset (capped growth)
- Current annual tax
- $20,200 · $1,683/mo
- Projected year-2 tax
- $20,200 · $1,683/mo
- Expected delta
- $0/yr ($0/mo · 0.0%)
ⓘ Screening estimate from a state-policy table — verify with the county assessor before closing.
Climate risk First Street
- Flood 1/10 Low FEMA zone X (unshaded) · 0% chance over 30 yrs
- Wildfire 4/10 Moderate
- Heat 6/10 Major 7 d/yr ≥99°F today · 15 d/yr by 30 yrs out
- Wind 4/10 Moderate 17% chance of damaging wind over 30 yrs
- Air quality 3/10 Moderate 2 unhealthy d/yr today · 4 by 30 yrs out
Nearby sold comps map
Loading sold comps map…
Walkable amenities ~0.75 mi
Loading nearby amenities…
Taxation est. · year 1
- Rental income
- $123,576
- − Mortgage interest
- −$50,358
- − Property taxes
- −$20,200
- − Insurance
- −$4,495
- − Repairs & maintenance
- −$9,886
- − Management
- −$9,886
- − Depreciation
- −$26,153
- Taxable income
- $2,598
- Est. tax owed @ 24.0%
- −$623
- After-tax cash flow
- $15,733/yr
For passive investors: Depreciation is non-cash, so a rental often shows a tax loss while cash-flowing — sheltering income. Rental losses are passive: they offset passive income freely, and up to $25,000/yr can offset ordinary (W-2) income if you actively participate and your MAGI is under $100k (phasing out to $0 by $150k); unused losses carry forward. On sale, claimed depreciation is recaptured at up to 25%, and gains may owe capital-gains tax (a 1031 exchange can defer both). Figures are a year-1 estimate at your 24.0% rate — not tax advice; consult a CPA.
Schools (NCES district)
- District
- Peekskill City School District
- NCES district ID
- 3622650
- Math proficiency
- 37% ▲ 4.00%
- Reading proficiency
- 36% ▲ 4.00%
- Median HH income
- $54,563
- Composite
- 34.6/100
- National rank
- #10089
- State rank
- #670 of 755 in NY
Livability — Peekskill
- Score
- 79/100
- State rank
- #132
- US rank
- #2121
Category grades
Schools grade is shown separately in the Schools card above.
Census & demographics
- Census place
- Peekskill, NY
- County
- Westchester County · 709,332 people
- City population
- 25,625
- Metro
- New York-Newark-Jersey City, NY-NJ-PA
- Population (ZIP)
- 25,625
- Household income
- $85,954
- Rent vs Own
- Severe rent burden
- 1507.0
Population outlook (Westchester County) Hauer SSP2
- Today (2025)
- 1,028,035 people
- By 2030
- 1,051,636 · +2.3%
- By 2040
- 1,098,520 · +6.9%
- By 2050
- 1,136,044 · +10.5%
- By 2075
- 1,196,925 · +16.4%
- By 2100
- 1,175,147 · +14.3%
Race, ethnicity, and origin ACS 2023
- Neighborhood character
- Diverse neighborhood (Simpson 0.65)
- Race & ethnicity
- Hispanic / Latino 46% White 32% Black 17% Two or more races 14% Native American 2% Asian 2%
- Hispanic origin (detail)
- Mexican 1% Puerto Rican 10% Cuban 3% Dominican 4%
- Common ancestry
- Romanian 2% Lithuanian 1% Slovak 1%
- Foreign-born
- 27% · Canada
- Languages at home
- 57% English-only · Spanish 37% Other Indo-European 2% French/Haitian/Cajun 1%
Political lean MEDSL · Westchester
- 2024 margin
- Strong D (+26.3) · D 63.1% · R 36.9%
- 2008→2024 swing
- -1.3pp toward R · 2008: 27.6pp · 2024: 26.3pp
- All cycles
- 2024: D+26.3 2020: D+36.3 2016: D+32.8 2012: D+22.2 2008: D+27.6
Not yet ingested
- Civics
- —
Market trends
- HPI YoY
- ▼ -96.67%
- Current HPI
- 307.944
- Rent YoY
- ▲ 0.12%
- Metro
- New York-Newark-Jersey City, NY-NJ-PA
- State GDP YoY
- ▲ 2.60%
- F500 in state
- 92
Industry mix (Fortune 500 HQ in NY)
| Industry | F500 HQs | Revenue |
|---|---|---|
| Financial Services | 10 | $950B |
|
||
| Consumer Goods | 9 | $162B |
|
||
| Insurance | 4 | $225B |
|
||
| Telecommunications | 2 | $144B |
|
||
| Pharmaceuticals | 2 | $112B |
|
||
| Media / Entertainment | 2 | $69B |
|
||
Price history
+102.0% since first listed13 events — show timeline
- 2026-03-24 Listed $899,000 OneKey® MLS as Distributed by MLS Grid
- 2015-06-19 Sold (MLS) $210,000 HGMLS
- 2015-06-19 Price Changed $210,000 HGMLS
- 2015-02-23 Sold (Public Records) $210,000 Public Records
- 2015-02-23 Sold (MLS) $210,000 OneKey® MLS as Distributed by MLS Grid
- 2014-01-27 Price Changed $399,999 HGMLS
- 2013-08-02 Contingent — HGMLS
- 2013-08-02 Price Changed $299,000 HGMLS
- 2013-05-07 Listed $299,000 HGMLS
- 2013-05-07 Listed $299,000 OneKey® MLS as Distributed by MLS Grid
- 2004-06-17 Sold (MLS) $445,000 HGMLS
- 2004-04-21 Delisted — HGMLS
- 2004-03-26 Listed $445,000 HGMLS
Property tax history
+4.2%/yrLatest (2025): $20,200 · +2.9% YoY. Source: county tax records.
Cash-flow waterfall
monthlySold comps — $/sqft
last 12 mo · ≤1 miLoading sold comps…