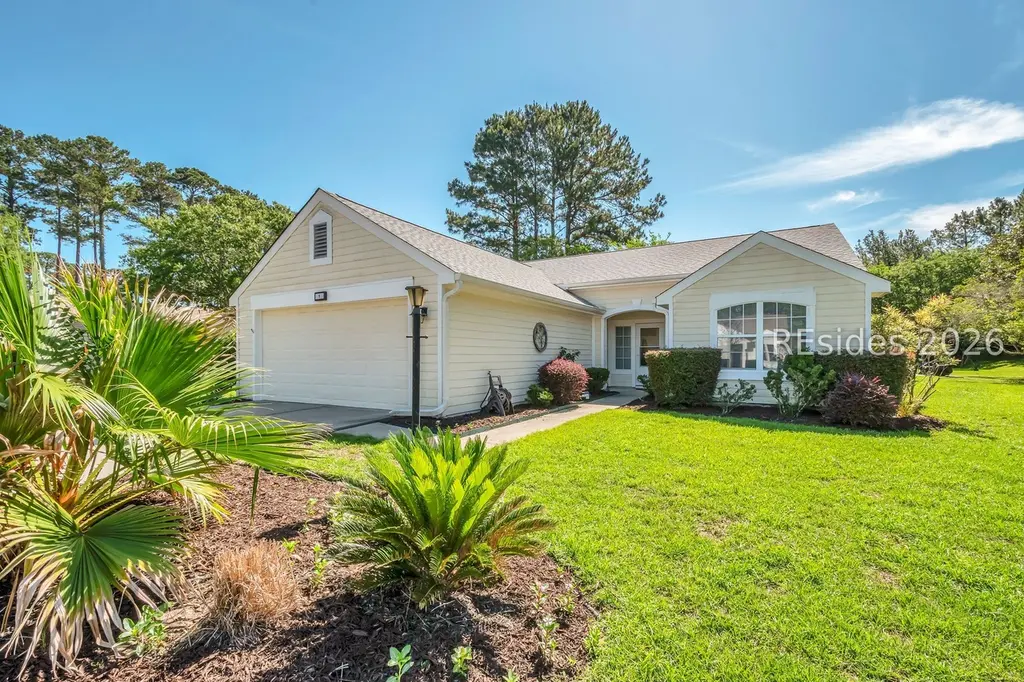
1 Coburn Ln · Bluffton, SC
Flood risk 4/10 · Minor
- FEMA flood zone
- X (unshaded)
- Chance of flooding over 30 yrs
- 0.2%
- Est. flood insurance / yr
- $507 – $1,088
Fire risk 3/10 · Minor
- Est. fire insurance / yr
- $783 – $1,453
Heat risk 9/10 · Severe
- Hot days now (above 107°F)
- 7 days/yr
- Hot days in 30 yrs
- 17 days/yr
Wind risk 8/10 · Major
- Chance of severe wind over 30 yrs
- 99.0%
Air-quality risk 2/10 · Minimal
- Unhealthy air days now
- 2 days/yr
- Unhealthy air days in 30 yrs
- 2 days/yr
Risk factors via First Street. Map © Google.
Why this score? — see what drove the C grade
The composite is a weighted blend of 9 inputs, each scored 0–100. Each bar is that input's sub-score; the figure is the points it added to the 100-point composite (weight × sub-score).
- Cash flow +18.4/30.0
- ARV discount +15.0/15.0
- DSCR +5.8/10.0
- Rent growth +4.8/5.0
- Schools +4.1/10.0
- 1% rule +3.7/10.0
- Livability +3.4/5.0
- Condition / age +2.5/5.0
- Appreciation +0.0/10.0
$298,000
🖨 Deal sheet (PDF) 📄 Offer letter ✓ Due diligence
Listing remarks MLS
Barton/Saratoga is nestled under a street lined with live oaks. model is move in ready. home features 2 bedrooms and 2 bathrooms. newer appliances and newly painted inside and out. home is finished in Hardiplank siding and architectural shingles.
Key facts
- Corner homesite
- Hardieplank siding
- Lvp flooring
Tags
Property features AI
Finance
- HOA & community: Community amenities include clubhouse, fitness center, trails, pool, tennis courts, pickleball, bocce court, dog park, restaurant, and guard; Senior community
Exterior
- Parking: 2-car garage; Garage
- Utilities: Public water
- Home design: Single-story; Composite siding; Asphalt roof
- Construction: Composite siding construction
- Exterior features: Sprinkler/irrigation; Community pool
Interior
- Kitchen: Dishwasher; Microwave; Range; Refrigerator
- Flooring: Luxury vinyl; Luxury vinyl plank; Tile
- Bathrooms: 2 full bathrooms
- Heating & cooling: Central heating (electric and gas); Central air conditioning (electric)
- Interior features: Ceiling fan(s); Main level primary; Unfurnished
- Laundry & utility: Laundry room; Utility room
Neighborhood map
What this means for you Summary
Snapshot
- This is a 2-bed/2.0-bath single-family listed at $298k.
Deal economics
- At list price, monthly cash flow is $279 ($3k/yr) — positive.
- The deal already cash-flows at list — no discount required.
- To meet the 1% rule (rent ≥ 1% of price), the offer needs to be $259k (13.1% below list).
- Recommended offer: $259k (13.1% below list) — sets the bar for 1% rule.
- Cap rate 7.4% vs local median 3.2% in Bluffton — top-decile yield for the area; either an underpriced asset or a hidden risk that comps aren't pricing in. Stress-test before assuming the spread holds.
Location & tenants
- Location reads 68/100 on livability (#76 in SC) — a middle-class / working-renter tenant base. Strengths: crime A+, employment A+, housing A+; Watch: amenities F, commute F, cost of living D-.
- Beaufort 01 (town): math 42% / reading 51% proficiency, ranked #17 of 80 in SC (top 21%) — families likely to look elsewhere, expect single-tenant / working-renter base with shorter leases.
- Zoned schools: Okatie Elementary (math 67% / reading 62%, grade B, #56 of 597 statewide, top 10%, 609 students, 26% FRL); Bluffton Middle (math 40% / reading 46%, grade D-, #60 of 229 statewide, top 26%, 872 students, 45% FRL); Bluffton High (math 69% / reading 85%, grade A-, #28 of 196 statewide, top 16%, 1,350 students, 38% FRL).
- Zoned-school proficiency averages 62% at this address vs 46% district-wide (+15 pts) — the actual schools serving this property are materially stronger than the Beaufort 01 average implies; a family-tenant draw the district grade alone would hide.
- Market conditions: Rents rising fast (+9.3%/yr); 657 active listings in the ZIP; 8 comparable units currently listed for rent nearby; rentals lingering (median 46d on market — plan ~5-8 weeks vacancy on turnover, expect pricing pressure); 50% of comp listings sitting > 30 days — soft ceiling on asking rent; solid renter incomes; 1,824 units permitted in Beaufort County in 2024 (618 in 5+ unit buildings).
Forward outlook
- Local home prices are declining (-3.0%/yr); year-one equity from $2k of loan paydown is wiped out by about $9k of value loss. Plan a longer hold.
- Beaufort County population projected at +30% by 2050 — long-run rental-demand tailwind backs the buy-and-hold thesis.
- At projected returns (-3.0% appreciation + 8.0% rent growth), your $83k cash investment doubles in ~10 years — after that, you're playing with house money.
Negotiation context
- It's been on market 60 days — a 3% lower offer ($289k) is reasonable based on typical stale-listing flexibility.
- 4 sale attempts since 14y ago; this cycle's ask has dropped $27k (8%) from the opening price — seller is motivated, your offer sets the floor, not the list.
- Current owner paid $173k; list at $298k implies a 72% gain — meaningful room to come down on a strong offer.
Risks & watch-outs
- Climate carrying-cost: severe wind risk, 99% chance of damaging wind over 30y; extreme-heat days projected 7→17/yr by 2055 (HVAC capex compounding) — expect insurance premiums to compound above CPI over the hold.
Questions for the listing agent
- It's been on market 60 days. Have you received any prior offers? Is the seller open to a 13% concession, seller financing, or rate buy-down credit?
- Is there a deadline driving the sale (1031 exchange, divorce, estate, relocation)? That informs how much negotiation room exists.
- Schools are B-rated — typically a magnet for longer-tenancy family renters. What's the average tenant stay here, and is there a school-zone premium baked into asking?
- What's the average days-on-market for RENTAL listings here right now (not sales)? A rising rental-DOM trend means longer vacancies and softer asking-rent achievability than the comps imply.
- What's the recent tenant-quality profile in this submarket — average credit score on applications, eviction rate, late-payment / NSF rate, and stable-employment percentage? A property-management company in the area should have these aggregated.
- How much new for-sale + rental construction is in the pipeline within 1–3 miles? Heavy new supply typically softens prices + rents 12–24 months out; constrained supply supports both.
Investment metrics
- 1% rule
- 0.87% ✗
- Cap rate
- 7.42%
- Cash-on-cash
- 4.01%
- DSCR
- 1.18
- GRM
- 9.6
CMA / ARV
- ARV (median comp)
- $390,386
- List price
- $298,000
- Delta
- -23.67%
- Verdict
- UNDERPRICED
- Comps
- 20 within 1.0 mi
Show comp detail 12 sales within ~0.75 mi
| Address | Dist | Beds/Ba | Sqft | Sold | Price | $/sf | Match |
|---|---|---|---|---|---|---|---|
| 20 Devant Dr E | 0.13mi | 2/2.0 | 1,362 (+6%) | 6mo | $340,000 | $250 | 78 |
| 129 Honesty Ln | 0.20mi | 2/2.0 | 1,356 (+6%) | 3mo | $350,000 | $258 | 78 |
| 23 Devant Dr E | 0.15mi | 2/2.0 | 1,162 (-9%) | 4mo | $312,900 | $269 | 74 |
| 10 Pelot Ct | 0.36mi | 2/2.0 | 1,389 (+8%) | 4mo | $315,000 | $227 | 66 |
| 22 Mongin Way | 0.25mi | 2/2.0 | 1,162 (-9%) | 9mo | $302,000 | $260 | 65 |
| 23 Mongin Way | 0.26mi | 2/2.0 | 1,183 (-8%) | 13mo | $320,500 | $271 | 65 |
| 37 Devant Dr E | 0.15mi | 2/2.0 | 1,445 (+13%) | 10mo | $370,000 | $256 | 63 |
| 110 Honesty Ln | 0.21mi | 2/2.0 | 1,470 (+15%) | 3mo | $399,000 | $271 | 63 |
| 37 Honesty Ln | 0.47mi | 2/2.0 | 1,406 (+10%) | 2mo | $380,000 | $270 | 60 |
| 3 Clover Dr | 0.30mi | 2/2.0 | 1,100 (-14%) | 6mo | $350,000 | $318 | 58 |
| 23 Coe Ct | 0.48mi | 2/2.0 | 1,380 (+8%) | 11mo | $275,000 | $199 | 56 |
| 8 Doharty Ln | 0.68mi | 2/2.0 | 1,376 (+8%) | 8mo | $315,000 | $229 | 49 |
Match score weights: distance 35% · size 25% · config 20% · recency 20%. Top-matched comps best support the ARV.
Projected returns pro-forma
-3.0% appreciation · 8.0% rent growth · sell at horizon
- IRR
- -5.2%
- Equity multiple
- 0.80×
- Total profit
- $-16,981
- Equity at exit
- $44,433
- IRR
- 9.1%
- Equity multiple
- 1.84×
- Total profit
- $69,803
- Equity at exit
- $25,766
Cash invested: $83,440 (down + closing). Projections, not guarantees.
Landlord ↔ Tenant lean methodology
- Overall (STATE)
- 90 Strongly Landlord-Friendly
- State South Carolina
- 90 Strongly Landlord-Friendly · R+6
- County
- — inherits STATE
- City
- — inherits STATE
ZIP-level market 29909
- Home prices YoY
- -12.5%
- Rents YoY
- 9.3%
- Active inventory
- 657
- Price-to-rent
- 9.6×
Monthly cashflow live
- Estimated rent
- $2,590 high interval (Pro) →
- Mortgage (P&I)
- −$1,563
- Tax from tax record
- −$80 /mo · $960/yr
- Insurance
- −$124
- HOA
- −$0
- Vacancy / Maint / Mgmt
- −$544
- Net cashflow
- $279
Break-even live
Sensitivity live
| Price | -10% $448 | -5% $363 | +0% $279 | +5% $195 | +10% $110 |
|---|---|---|---|---|---|
| Rent | -10% $74 | -5% $177 | +0% $279 | +5% $381 | +10% $483 |
| Rate | -1.0pp $429 | -0.5pp $355 | base $279 | +0.5pp $202 | +1.0pp $123 |
UW: 25.0% down · 7.5% · 30yr · 1.5% tax · 5.0% vac · 8.0% maint · 8.0% mgmt
Financing live
Cash to close
- Down payment
- $74,500
- Closing costs
- $8,940
- Reserves months
- —
- Total cash needed
- —
Loan-product check · same deal, 3 products live
Conventional
25% down · 7.5% · 30yr
- Down + closing
- —
- Monthly P&I
- —
- Monthly cashflow
- —
- DSCR
- —
- Eligible?
- —
Personal DTI + credit; lowest rate.
DSCR
20% down · 8.5% · 30yr
- Down + closing
- —
- Monthly P&I
- —
- Monthly cashflow
- —
- DSCR
- —
- Eligible?
- —
No personal income docs; deal must DSCR.
Hard money
10% down · 12.0% · 12mo
- Down + closing
- —
- Monthly P&I
- —
- Monthly cashflow
- —
- DSCR
- —
- Eligible?
- —
Short-term bridge; refi at stabilization.
Rent comps 8 comps
| Address | Beds | Baths | Sqft | Rent | $/sqft | DOM | Units | Dist |
|---|---|---|---|---|---|---|---|---|
| 17 Thomas Bee Dr Bluffton, SC | 3.0 | 2.0 | 1848 | $3,000 | $1.62 | 15d | 1 | 0.80mi |
| 60 Padgett Dr Bluffton, SC | 2.0 | 2.0 | 1089 | $2,300 | $2.11 | 45d | 1 | 0.89mi |
| 28 Darby Creek Ct Bluffton, SC | 2.0 | 2.0 | 1488 | $2,350 | $1.58 | 45d | 1 | 1.01mi |
| 61 Zubler St Bluffton, SC | 2.0 | 2.0 | 1053 | $1,970 | $1.87 | 23d | 1 | 1.11mi |
| 309 Hampton Pl Bluffton, SC | 2.0 | 2.0 | 1633 | $3,200 | $1.96 | 15d | 1 | 1.11mi |
| 11 Parklands Dr Bluffton, SC | 1.0–3.0 | 1.0–2.0 | 1088 | $2,260 | $2.08 | 15d | 33 | 1.29mi |
| 20 Fickling Ct Bluffton, SC | 2.0 | 2.0 | 1742 | $2,800 | $1.61 | 45d | 1 | 1.29mi |
| 55 Purry Cir Bluffton, SC | 2.0 | 2.0 | 1445 | $2,500 | $1.73 | 45d | 1 | 1.34mi |
Listing history 25 events
-
2026-06-21days on market $298,000 Active 60 DOM
-
2026-06-18days on market $298,000 Active 57 DOM
-
2026-06-17days on market $298,000 Active 56 DOM
-
2026-06-16days on market $298,000 Active 55 DOM
-
2026-06-15days on market $298,000 Active 54 DOM
-
2026-06-14days on market $298,000 Active 52 DOM
-
2026-06-13pricedays on market $298,000 Active 51 DOM
-
2026-06-10days on market $310,000 Active 49 DOM
-
2026-06-09days on market $310,000 Active 48 DOM
-
2026-06-08days on market $310,000 Active 47 DOM
-
2026-06-07days on market $310,000 Active 46 DOM
-
2026-06-05days on market $310,000 Active 43 DOM
-
2026-06-03days on market $310,000 Active 42 DOM
-
2026-06-02days on market $310,000 Active 41 DOM
-
2026-06-01days on market $310,000 Active 40 DOM
-
2026-05-31days on market $310,000 Active 39 DOM
-
2026-04-22$325,000 Active 667-char remark
-
2025-06-27price $350,000
-
2025-04-26$365,000 Active
-
2015-05-29soldstatus $173,000
-
2015-05-15soldstatus $173,000
Show marketing remark (247 chars)
Barton/Saratoga is nestled under a street lined with live oaks. model is move in ready. home features 2 bedrooms and 2 bathrooms. newer appliances and newly painted inside and out. home is finished in Hardiplank siding and architectural shingles.
-
2015-04-10$179,000
Show marketing remark (247 chars)
Barton/Saratoga is nestled under a street lined with live oaks. model is move in ready. home features 2 bedrooms and 2 bathrooms. newer appliances and newly painted inside and out. home is finished in Hardiplank siding and architectural shingles.
-
2013-02-05soldstatus $100,000
-
2012-10-24$107,900
-
1998-01-16soldstatus $123,783
ⓘ Source: listings_history table (triggers on properties + properties_extension) + one-shot
backfill from property_details.listing_events for pre-trigger history.
Tax reassessment forecast SC · Resets to sale price
- Current annual tax
- $960 · $80/mo
- Projected year-2 tax
- $1,699 · $142/mo
- Expected delta
- +$738/yr (+$62/mo · 76.9%)
ⓘ Screening estimate from a state-policy table — verify with the county assessor before closing.
Climate risk First Street
- Flood 4/10 Moderate FEMA zone X (unshaded) · 20% chance over 30 yrs
- Wildfire 3/10 Moderate
- Heat 9/10 Extreme 7 d/yr ≥107°F today · 17 d/yr by 30 yrs out
- Wind 8/10 Severe 99% chance of damaging wind over 30 yrs
- Air quality 2/10 Low 2 unhealthy d/yr today · 2 by 30 yrs out
Nearby sold comps map
Loading sold comps map…
Walkable amenities ~0.75 mi
Loading nearby amenities…
Taxation est. · year 1
- Rental income
- $31,076
- − Mortgage interest
- −$16,693
- − Property taxes
- −$960
- − Insurance
- −$1,490
- − Repairs & maintenance
- −$2,486
- − Management
- −$2,486
- − Depreciation
- −$8,669
- Taxable loss
- −$1,708
- Est. tax savings @ 24.0%
- +$410
- After-tax cash flow
- $3,757/yr
For passive investors: Depreciation is non-cash, so a rental often shows a tax loss while cash-flowing — sheltering income. Rental losses are passive: they offset passive income freely, and up to $25,000/yr can offset ordinary (W-2) income if you actively participate and your MAGI is under $100k (phasing out to $0 by $150k); unused losses carry forward. On sale, claimed depreciation is recaptured at up to 25%, and gains may owe capital-gains tax (a 1031 exchange can defer both). Figures are a year-1 estimate at your 24.0% rate — not tax advice; consult a CPA.
Schools (NCES district)
- District
- Beaufort 01
- NCES district ID
- 4501110
- Math proficiency
- 42% ▼ -8.00%
- Reading proficiency
- 51% ▲ 2.00%
- Median HH income
- $57,430
- Composite
- 40.56/100
- National rank
- #3699
- State rank
- #17 of 80 in SC
Livability — Bluffton
- Score
- 68/100
- State rank
- #76
- US rank
- #8936
Category grades
Schools grade is shown separately in the Schools card above.
Census & demographics
- County
- Beaufort County · 163,770 people
- City population
- 77,022
- Metro
- Hilton Head Island-Bluffton, SC
- Population (ZIP)
- 24,003
- Household income
- $91,294
- Rent vs Own
- Severe rent burden
- 268.0
Population outlook (Beaufort County) Hauer SSP2
- Today (2025)
- 211,915 people
- By 2030
- 227,272 · +7.2%
- By 2040
- 253,861 · +19.8%
- By 2050
- 275,126 · +29.8%
- By 2075
- 311,022 · +46.8%
- By 2100
- 321,286 · +51.6%
Race, ethnicity, and origin ACS 2023
- Neighborhood character
- Predominantly White (89%)
- Race & ethnicity
- White 89% Black 4% Hispanic / Latino 4% Two or more races 3% Asian 1%
- Common ancestry
- Romanian 5% Lithuanian 3% Slovak 2%
- Foreign-born
- 6% · Canada, Vietnam
- Languages at home
- 94% English-only · Spanish 2% Other Indo-European 1%
Political lean MEDSL · Beaufort
- 2024 margin
- R (+14.5) · D 42.1% · R 56.6% · Other 1.2%
- 2008→2024 swing
- -3.7pp toward R · 2008: -10.8pp · 2024: -14.5pp
- All cycles
- 2024: R+14.5 2020: R+10.0 2016: R+14.3 2012: R+17.5 2008: R+10.8
Not yet ingested
- Civics
- —
Market trends
- HPI YoY
- ▼ -27.99%
- Current HPI
- 196.0491
- Rent YoY
- ▲ 9.31%
- Metro
- Hilton Head Island-Bluffton, SC
- State GDP YoY
- ▲ 4.51%
- F500 in state
- 2
Industry mix (Fortune 500 HQ in SC)
| Industry | F500 HQs | Revenue |
|---|---|---|
| Packaging | 1 | $7B |
|
||
Price history
+140.7% since first listed11 events — show timeline
- 2026-06-11 Price Changed $298,000 RSMLS
- 2026-05-25 Price Changed $310,000 RSMLS
- 2026-04-22 Listed $325,000 RSMLS
- 2025-06-27 Price Changed $350,000 RSMLS
- 2025-04-26 Listed $365,000 RSMLS
- 2015-05-29 Sold (Public Records) $173,000 Public Records
- 2015-05-15 Sold (MLS) $173,000 RSMLS
- 2015-04-10 Listed $179,000 RSMLS
- 2013-02-05 Sold (MLS) $100,000 RSMLS
- 2012-10-24 Listed $107,900 RSMLS
- 1998-01-16 Sold (Public Records) $123,783 Public Records
Property tax history
-4.2%/yrLatest (2025): $960 · -0.1% YoY. Source: county tax records.
Cash-flow waterfall
monthlySold comps — $/sqft
last 12 mo · ≤1 miLoading sold comps…