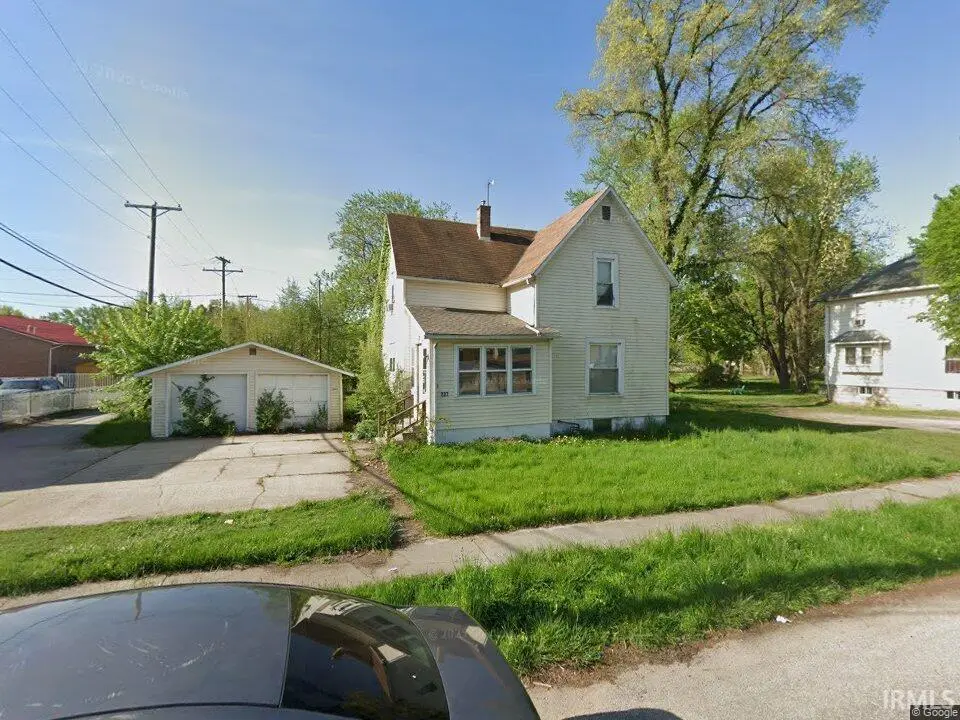
237 Park Ave · Elkhart, IN
Flood risk 8/10 · Major
- FEMA flood zone
- X (unshaded)
- Chance of flooding over 30 yrs
- 0.78%
- Est. flood insurance / yr
- $473 – $860
Fire risk 1/10 · Minimal
- Est. fire insurance / yr
- $717 – $1,331
Heat risk 3/10 · Minor
- Hot days now (above 101°F)
- 7 days/yr
- Hot days in 30 yrs
- 16 days/yr
Wind risk 2/10 · Minimal
- Chance of severe wind over 30 yrs
- —
Air-quality risk 3/10 · Minor
- Unhealthy air days now
- 2 days/yr
- Unhealthy air days in 30 yrs
- 3 days/yr
Risk factors via First Street. Map © Google.
Why this score? — see what drove the C+ grade
The composite is a weighted blend of 9 inputs, each scored 0–100. Each bar is that input's sub-score; the figure is the points it added to the 100-point composite (weight × sub-score).
- Cash flow +25.8/30.0
- ARV discount +11.3/15.0
- DSCR +8.6/10.0
- 1% rule +6.1/10.0
- Livability +3.4/5.0
- Rent growth +2.5/5.0
- Condition / age +2.5/5.0
- Schools +1.8/10.0
- Appreciation +0.0/10.0
$139,900
🖨 Deal sheet (PDF) 📄 Offer letter ✓ Due diligence
Listing remarks
Newly Remodeled 2 story home on the southside of downtown Elkhart. Close to downtown shopping, city parks. This home has a nice entry/mud room at the front of the home to greet guests. Formal Dining room, kitchen, family room and full bathroom all on the main floor. The second floor has 3 bedrooms. All which have new carpet. Many upgrades include a fresh kitchen work area and main bathroom. This home has a fenced in yard and a 2 stall detached garage.
Key facts
- Formal dining room
- Entry mud room
- Fenced in yard
Tags
Property features AI
Finance
- Other: Some energy-efficient features: doors, HVAC, water heater, windows, thermostat
- HOA & community: No association amenities
Exterior
- Parking: Detached garage with 2 parking spaces; Concrete driveway and off-street parking
- Utilities: Public water; Public sewer
- Home design: Single-family residence (site-built); 2 stories
- Construction: Vinyl siding; Brick/mortar and block foundation; Asphalt shingle roof; Built as site-built home
- Exterior features: Deck; Chain link fencing; Level lot; Lot dimensions approximately 73 x 123
Interior
- Kitchen: Eat-in kitchen; Laminate counters
- Bedrooms: Total of 15 rooms (bedroom count not specified)
- Flooring: Carpet; Laminate; Vinyl
- Bathrooms: One full bathroom (main level)
- Heating & cooling: Natural gas and electric heating; Forced air and floor furnace; No central cooling
- Interior features: Eat-in kitchen; Laminate countertops; Insulated windows; Full basement with exterior entry
- Laundry & utility: Electric dryer hookup in basement
Neighborhood map
What this means for you Summary
Snapshot
- This is a 3-bed/1.0-bath single-family listed at $140k.
Deal economics
- At list price, monthly cash flow is $283 ($3k/yr) — positive.
- The deal already cash-flows at list — no discount required.
- Meets the 1% rule at list price ($2k rent vs $140k).
- Cap rate 9.2% vs local median 4.0% in Elkhart — top-decile yield for the area; either an underpriced asset or a hidden risk that comps aren't pricing in. Stress-test before assuming the spread holds.
Location & tenants
- Location reads 68/100 on livability (#224 in IN) — a middle-class / working-renter tenant base. Strengths: cost of living A+, housing A+, health & safety A+; Watch: amenities C-, crime F, commute F.
- Elkhart Community Schools (urban): math 18% / reading 25% proficiency, ranked #271 of 301 in IN (top 90%) — low school quality limits family demand, transient renter base, plan for 1-2y turnover.
- Zoned schools: Monger Elementary School (math 25% / reading 24%, grade F, #762 of 994 statewide, top 78%, 427 students, 88% FRL); North Side Middle School (math 15% / reading 31%, grade F, #263 of 330 statewide, top 80%, 627 students, 72% FRL); Elkhart High School (math 17% / reading 51%, grade F, #285 of 369 statewide, top 78%, 3,325 students, 63% FRL).
- Market conditions: 152 active listings in the ZIP; 6 comparable units currently listed for rent nearby; rentals at typical pace (median 24d on market — plan ~3-4 weeks tenant-placement turnaround); 484 units permitted in Elkhart County in 2024 (136 in 5+ unit buildings).
- This rent runs 33% of the median local income ($56k/yr) — at the standard rent-burdened threshold; future hikes will face affordability resistance.
Forward outlook
- Local home prices are declining (-3.0%/yr); year-one equity from $967 of loan paydown is wiped out by about $4k of value loss. Plan a longer hold.
- Elkhart County population projected at +7% by 2050 — modest demand growth; plan on rents tracking national, not racing it.
Negotiation context
- Only 7 days on market — expect competitive offers; lowballing is unlikely to land.
- Current owner paid $58k; list at $140k implies a 143% gain — meaningful room to come down on a strong offer.
Risks & watch-outs
- Watch-outs: flood insurance adds $56/mo; built in 1910 — expect roof / HVAC / electrical / plumbing capex.
- Climate carrying-cost: severe flood risk — expect insurance premiums to compound above CPI over the hold.
Questions for the listing agent
- Built in 1910 — when were the roof, HVAC, electrical panel, plumbing, and water heater last replaced?
- What's the actual annual flood-insurance premium (NFIP or private), and is the property in a SFHA with mandatory coverage?
- Is there a deadline driving the sale (1031 exchange, divorce, estate, relocation)? That informs how much negotiation room exists.
- Schools are F-rated, which usually means shorter tenancies and higher turnover. Who's the typical renter profile here, and what's been the actual vacancy rate?
- Crime grade is F in this area — have there been break-ins, vandalism, or insurance claims at this property in the last 3 years? What carrier currently insures it and at what premium?
- What's the average days-on-market for RENTAL listings here right now (not sales)? A rising rental-DOM trend means longer vacancies and softer asking-rent achievability than the comps imply.
- What's the recent tenant-quality profile in this submarket — average credit score on applications, eviction rate, late-payment / NSF rate, and stable-employment percentage? A property-management company in the area should have these aggregated.
- How much new for-sale + rental construction is in the pipeline within 1–3 miles? Heavy new supply typically softens prices + rents 12–24 months out; constrained supply supports both.
Investment metrics
- 1% rule
- 1.11% ✓
- Cap rate
- 9.20%
- Cash-on-cash
- 10.38%
- DSCR
- 1.46
- GRM
- 7.5
CMA / ARV
- ARV (on-the-fly)
- $152,872
- Comps found
- 12
Show comp detail 12 sales within ~0.75 mi
| Address | Dist | Beds/Ba | Sqft | Sold | Price | $/sf | Match |
|---|---|---|---|---|---|---|---|
| 210 W Garfield Ave | 0.24mi | 2/1.0 (-1) | 1,625 (+3%) | 1mo | $170,000 | $105 | 78 |
| 616 Mcdonald St | 0.44mi | 4/1.0 (+1) | 1,588 (+1%) | 0mo | $185,000 | $116 | 73 |
| 314 Aspenwald Ave | 0.33mi | 4/1.0 (+1) | 1,656 (+5%) | 2mo | $160,000 | $97 | 69 |
| 810 W Wolf Ave | 0.65mi | 4/1.0 (+1) | 1,604 (+2%) | 0mo | $64,000 | $40 | 61 |
| 1618 Lane Ave | 0.63mi | 3/2.0 | 1,572 (-0%) | 6mo | $121,000 | $77 | 61 |
| 226 State St | 0.46mi | 3/1.0 | 1,440 (-9%) | 9mo | $170,900 | $119 | 57 |
| 2009 Roys Ave | 0.62mi | 3/1.5 | 1,682 (+7%) | 6mo | $140,000 | $83 | 52 |
| 916 W Cleveland Ave | 0.70mi | 3/1.0 | 1,484 (-6%) | 7mo | $136,000 | $92 | 51 |
| 510 W Franklin St | 0.64mi | 2/1.0 (-1) | 1,703 (+8%) | 2mo | $105,000 | $62 | 50 |
| 1016 Princeton St | 0.50mi | 3/1.5 | 1,353 (-14%) | 3mo | $140,000 | $103 | 49 |
| 731 W Blaine Ave | 0.69mi | 3/1.0 | 1,752 (+11%) | 5mo | $170,000 | $97 | 46 |
| 934 W Garfield Ave | 0.71mi | 3/1.5 | 1,440 (-9%) | 7mo | $180,000 | $125 | 44 |
Match score weights: distance 35% · size 25% · config 20% · recency 20%. Top-matched comps best support the ARV.
Projected returns pro-forma
-3.0% appreciation · 3.0% rent growth · sell at horizon
- IRR
- -3.1%
- Equity multiple
- 0.88×
- Total profit
- $-4,608
- Equity at exit
- $20,860
- IRR
- 6.6%
- Equity multiple
- 1.49×
- Total profit
- $19,272
- Equity at exit
- $12,096
Cash invested: $39,172 (down + closing). Projections, not guarantees.
Landlord ↔ Tenant lean methodology
- Overall (STATE)
- 90 Strongly Landlord-Friendly
- State Indiana
- 90 Strongly Landlord-Friendly · R+11
- County
- — inherits STATE
- City
- — inherits STATE
ZIP-level market 46516
- Active inventory
- 152
- Price-to-rent
- 7.5×
Monthly cashflow live
- Estimated rent
- $1,555 high interval (Pro) →
- Mortgage (P&I)
- −$734
- Tax from tax record
- −$97 /mo · $1,168/yr
- Insurance
- −$58
- Flood insurance flood zone
- −$56 /mo · $666/yr
- HOA
- −$0
- Lot rent
- −$0
- Vacancy / Maint / Mgmt
- −$327
- Net cashflow
- $283
Break-even live
Sensitivity live
| Price | -10% $363 | -5% $323 | +0% $283 | +5% $244 | +10% $204 |
|---|---|---|---|---|---|
| Rent | -10% $161 | -5% $222 | +0% $283 | +5% $345 | +10% $406 |
| Rate | -1.0pp $354 | -0.5pp $319 | base $283 | +0.5pp $247 | +1.0pp $210 |
UW: 25.0% down · 7.5% · 30yr · 1.5% tax · 5.0% vac · 8.0% maint · 8.0% mgmt
Financing live
Cash to close
- Down payment
- $34,975
- Closing costs
- $4,197
- Reserves months
- —
- Total cash needed
- —
Loan-product check · same deal, 3 products live
Conventional
25% down · 7.5% · 30yr
- Down + closing
- —
- Monthly P&I
- —
- Monthly cashflow
- —
- DSCR
- —
- Eligible?
- —
Personal DTI + credit; lowest rate.
DSCR
20% down · 8.5% · 30yr
- Down + closing
- —
- Monthly P&I
- —
- Monthly cashflow
- —
- DSCR
- —
- Eligible?
- —
No personal income docs; deal must DSCR.
Hard money
10% down · 12.0% · 12mo
- Down + closing
- —
- Monthly P&I
- —
- Monthly cashflow
- —
- DSCR
- —
- Eligible?
- —
Short-term bridge; refi at stabilization.
Rent comps 6 comps
| Address | Beds | Baths | Sqft | Rent | $/sqft | DOM | Units | Dist |
|---|---|---|---|---|---|---|---|---|
| 660 Stamp Dr Elkhart, IN | 2.0 | 1.0 | 1120 | $1,250 | $1.12 | 23d | 1 | 0.83mi |
| 200 Jr. Achievement Dr Elkhart, IN | 1.0–2.0 | 1.0–2.0 | 946 | $1,770 | $1.87 | 23d | 10 | 0.88mi |
| 1568 W Franklin St Elkhart, IN | 3.0 | 2.0 | 1486 | $1,600 | $1.08 | 23d | 1 | 1.15mi |
| 2700 Ridgewood Dr Elkhart, IN | 3.0 | 1.0–2.0 | 720 | $1,450 | $2.01 | 46d | 1 | 1.28mi |
| 1023 Cone St Elkhart, IN | 2.0 | 1.0 | 1112 | $1,200 | $1.08 | 47d | 1 | 1.38mi |
| 721 N Michigan St Elkhart, IN | 4.0 | 2.0 | 1952 | $2,499 | $1.28 | 23d | 1 | 1.42mi |
Listing history 2 events
-
2026-05-19$139,900 Active
-
2006-04-18soldstatus $57,500
ⓘ Source: listings_history table (triggers on properties + properties_extension) + one-shot
backfill from property_details.listing_events for pre-trigger history.
Tax reassessment forecast IN · Partial reset (capped growth)
- Current annual tax
- $1,168 · $97/mo
- Projected year-2 tax
- $1,179 · $98/mo
- Expected delta
- +$10/yr (+$1/mo · 0.9%)
ⓘ Screening estimate from a state-policy table — verify with the county assessor before closing.
Climate risk First Street
- Flood 8/10 Severe FEMA zone X (unshaded) · 78% chance over 30 yrs
- Wildfire 1/10 Low
- Heat 3/10 Moderate 7 d/yr ≥101°F today · 16 d/yr by 30 yrs out
- Wind 2/10 Low
- Air quality 3/10 Moderate 2 unhealthy d/yr today · 3 by 30 yrs out
Nearby sold comps map
Loading sold comps map…
Walkable amenities ~0.75 mi
Loading nearby amenities…
Taxation est. · year 1
- Rental income
- $18,657
- − Mortgage interest
- −$7,837
- − Property taxes
- −$1,168
- − Insurance
- −$1,366
- − Repairs & maintenance
- −$1,493
- − Management
- −$1,493
- − Depreciation
- −$4,070
- Taxable income
- $1,231
- Est. tax owed @ 24.0%
- −$296
- After-tax cash flow
- $3,106/yr
For passive investors: Depreciation is non-cash, so a rental often shows a tax loss while cash-flowing — sheltering income. Rental losses are passive: they offset passive income freely, and up to $25,000/yr can offset ordinary (W-2) income if you actively participate and your MAGI is under $100k (phasing out to $0 by $150k); unused losses carry forward. On sale, claimed depreciation is recaptured at up to 25%, and gains may owe capital-gains tax (a 1031 exchange can defer both). Figures are a year-1 estimate at your 24.0% rate — not tax advice; consult a CPA.
Schools (NCES district)
- District
- Elkhart Community Schools
- NCES district ID
- 1803270
- Math proficiency
- 18% ▼ -12.00%
- Reading proficiency
- 25% ▼ -9.00%
- Median HH income
- $42,881
- Composite
- 18.45/100
- National rank
- #8928
- State rank
- #271 of 301 in IN
Livability — Elkhart
- Score
- 68/100
- State rank
- #224
- US rank
- #9852
Category grades
Schools grade is shown separately in the Schools card above.
Census & demographics
- Census place
- Elkhart, IN
- County
- Elkhart County · 107,928 people
- City population
- 74,260
- Metro
- Elkhart-Goshen, IN
- Population (ZIP)
- 31,871
- Household income
- $56,492
- Rent vs Own
- Severe rent burden
- 995.0
Population outlook (Elkhart County) Hauer SSP2
- Today (2025)
- 213,761 people
- By 2030
- 218,103 · +2.0%
- By 2040
- 225,381 · +5.4%
- By 2050
- 229,447 · +7.3%
- By 2075
- 232,856 · +8.9%
- By 2100
- 214,088 · +0.2%
Race, ethnicity, and origin ACS 2023
- Neighborhood character
- Diverse neighborhood (Simpson 0.56)
- Race & ethnicity
- White 60% Hispanic / Latino 26% Black 9% Two or more races 8% Asian 1%
- Hispanic origin (detail)
- Mexican 15%
- Common ancestry
- Romanian 2% Iranian 2% Lithuanian 2%
- Foreign-born
- 15% · Canada
- Languages at home
- 77% English-only · Spanish 19% Other Indo-European 3%
Political lean MEDSL · Elkhart
- 2024 margin
- Solid R (+32.4) · D 33.1% · R 65.5% · Other 1.4%
- 2008→2024 swing
- -21.2pp toward R · 2008: -11.2pp · 2024: -32.4pp
- All cycles
- 2024: R+32.4 2020: R+28.1 2016: R+32.4 2012: R+26.5 2008: R+11.2
Not yet ingested
- Civics
- —
Market trends
- HPI YoY
- ▼ -233.42%
- Current HPI
- 239.2508
- Rent YoY
- —
- Metro
- Elkhart-Goshen, IN
- State GDP YoY
- ▲ 2.90%
- F500 in state
- 18
Industry mix (Fortune 500 HQ in IN)
| Industry | F500 HQs | Revenue |
|---|---|---|
| Industrial Machinery | 2 | $37B |
|
||
| Healthcare | 1 | $177B |
|
||
| Pharmaceuticals | 1 | $45B |
|
||
| Metals / Steel | 1 | $18B |
|
||
| Agriculture | 1 | $17B |
|
||
| Packaging | 1 | $12B |
|
||
Price history
+143.3% since first listed3 events — show timeline
- 2026-05-27 Pending — IRMLS
- 2026-05-19 Listed $139,900 IRMLS
- 2006-04-18 Sold (Public Records) $57,500 Public Records
Property tax history
-5.0%/yrLatest (2025): $1,168 · -19.7% YoY. Source: county tax records.
Cash-flow waterfall
monthlySold comps — $/sqft
last 12 mo · ≤1 miLoading sold comps…