118 Pauline Dr · Hazel Green, AL
Flood risk 1/10 · Minimal
- FEMA flood zone
- X (unshaded)
- Chance of flooding over 30 yrs
- 0.0%
- Est. flood insurance / yr
- $507 – $1,088
Fire risk 3/10 · Minor
- Est. fire insurance / yr
- $916 – $1,700
Heat risk 5/10 · Moderate
- Hot days now (above 104°F)
- 7 days/yr
- Hot days in 30 yrs
- 19 days/yr
Wind risk 4/10 · Minor
- Chance of severe wind over 30 yrs
- 18.0%
Air-quality risk 2/10 · Minimal
- Unhealthy air days now
- 0 days/yr
- Unhealthy air days in 30 yrs
- 1 days/yr
Risk factors via First Street. Map © Google.
Why this score? — see what drove the D grade
The composite is a weighted blend of 9 inputs, each scored 0–100. Each bar is that input's sub-score; the figure is the points it added to the 100-point composite (weight × sub-score).
- Appreciation +10.0/10.0
- Cash flow +7.8/30.0
- ARV discount +7.5/15.0
- Schools +3.7/10.0
- Livability +3.5/5.0
- Rent growth +2.5/5.0
- Condition / age +2.5/5.0
- DSCR +1.9/10.0
- 1% rule +1.1/10.0
$315,900
🖨 Deal sheet (PDF) 📄 Offer letter ✓ Due diligence
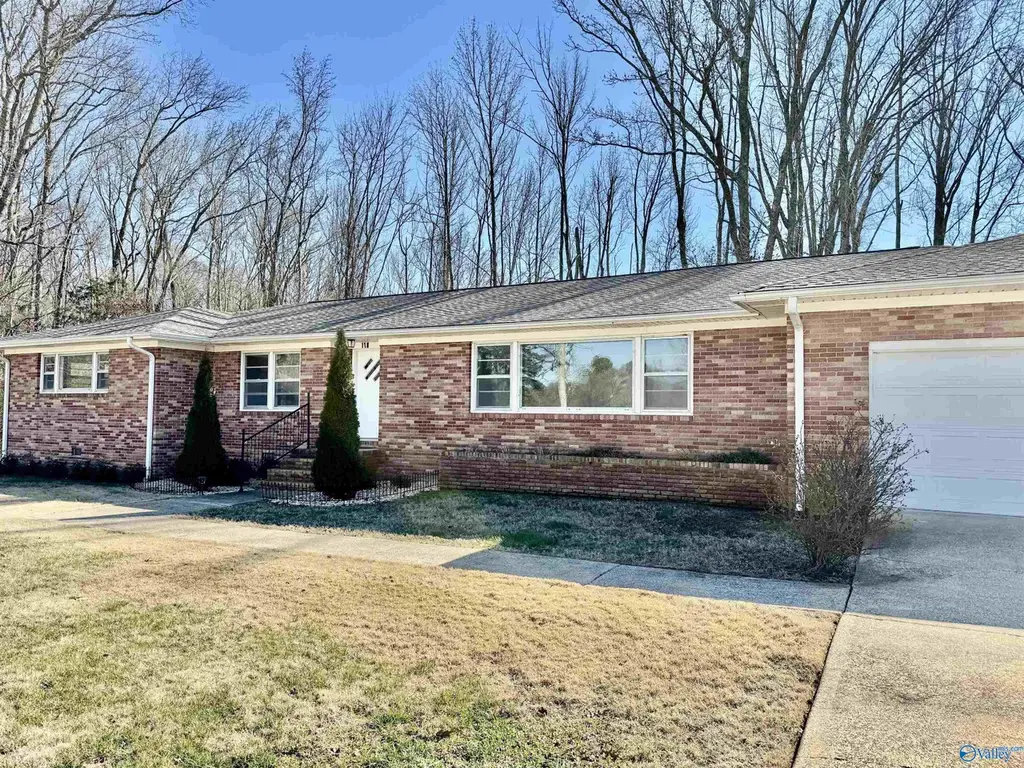
Listing remarks
PRICE REDUCED BY $34,000!!! PRIME LOCATION-This beautifully updated full brick home offers convenience to schools, shopping restaurants. Featuring 4 spacious bedrooms, 2 full baths, formal living room, plus an inviting family room with wood-burning fireplace. Interior completely refreshed interior, fresh paint throughout, stunning kitchen renovation with new tile floors modern countertops and new range, dishwasher, & refrigerator. Original hardwoods floors have been professionally refinished. Recent improvements also include new roof & HVAC system. Enjoy privacy with partial fencing & partial wooded from the large concrete patio.
Key facts
- Large concrete patio
- New roof
- New hvac system
Tags
Property features AI
Finance
- Financial info: Property may be used commercially or residentially (opportunity for office or business use)
- HOA & community: No homeowners association; Subdivision: Metes And Bounds
Exterior
- Parking: Attached two-car garage with garage door opener; Concrete driveway
- Utilities: Public water; Septic tank; Electric service (standard)
- Home design: Single-family residence; One-story; Brick construction
- Construction: Brick construction
- Exterior features: Public water; Septic tank
Interior
- Bathrooms: 1 full bathroom; 1 three-quarter bathroom
- Heating & cooling: Central heating; Central cooling
- Interior features: Wood-burning fireplace; Crawl space basement
Neighborhood map
What this means for you Summary
Snapshot
- This is a 4-bed/1.0-bath single-family listed at $316k.
Deal economics
- At list price, monthly cash flow is $-351 ($-4k/yr) — negative.
- To cash-flow at today's rent, offer at most $254k (19.6% below list).
- To meet the 1% rule (rent ≥ 1% of price), the offer needs to be $192k (39.3% below list).
- Recommended offer: $192k (39.3% below list) — sets the bar for 1% rule.
- Cap rate 5.0% vs local median 3.9% in Hazel Green — meaningfully above typical; check what's discounted (condition, days-on-market, listing class) to confirm the premium yield is real.
Location & tenants
- Location reads 69/100 on livability (#54 in AL) — a middle-class / working-renter tenant base. Strengths: cost of living A+, housing A+, crime A; Watch: amenities F, commute F, employment F.
- Madison County (rural): math 27% / reading 56% proficiency, ranked #19 of 129 in AL (top 15%) — families likely to look elsewhere, expect single-tenant / working-renter base with shorter leases.
- Zoned schools: Hazel Green Elementary School (math 23% / reading 58%, grade F, #238 of 627 statewide, top 38%, 738 students, 50% FRL); Meridianville Middle School (math 19% / reading 62%, grade F, #56 of 257 statewide, top 22%, 724 students, 45% FRL); Hazel Green High School (math 23% / reading 31%, grade F, #90 of 305 statewide, top 35%, 1,348 students, 42% FRL) — zoned schools average 46% FRL vs 29% district-wide (16 pts higher); higher-poverty schools than district average — tighter screening recommended.
- Market conditions: 260 active listings in the ZIP; 13 comparable units currently listed for rent nearby; rentals at typical pace (median 26d on market — plan ~3-4 weeks tenant-placement turnaround); 4,709 units permitted in Madison County in 2024 (1,186 in 5+ unit buildings).
- This rent runs 34% of the median local income ($68k/yr) — at the standard rent-burdened threshold; future hikes will face affordability resistance.
Forward outlook
- In year one you build about $34k of equity ($2k loan paydown + $32k appreciation (10.0% local appreciation)).
- Madison County population projected at +18% by 2050 — long-run rental-demand tailwind backs the buy-and-hold thesis.
- By year 2, paydown + projected appreciation supports a ~$54k cash-out refi (75% LTV) — recoverable capital for the next deal without selling this one.
Negotiation context
- It's been on market 62 days — a 6% lower offer ($297k) is reasonable based on typical stale-listing flexibility.
- 8 sale attempts since 11y ago; this cycle's ask has dropped $34k (10%) from the opening price — seller is motivated, your offer sets the floor, not the list.
- Current owner paid $210k; list at $316k implies a 50% gain — meaningful room to come down on a strong offer.
Risks & watch-outs
- Climate carrying-cost: extreme-heat days projected 7→19/yr by 2055 (HVAC capex compounding) — expect insurance premiums to compound above CPI over the hold.
Questions for the listing agent
- What do current leases actually rent for vs. the listed asking? Can we see a recent rent roll and the last 12 months of T-12 income?
- It's been on market 62 days. Have you received any prior offers? Is the seller open to a 39% concession, seller financing, or rate buy-down credit?
- Built in 1966 — when were the roof, HVAC, electrical panel, plumbing, and water heater last replaced?
- Why hasn't it sold? Are there any deal-killer items the seller is aware of (foundation, flood, title, zoning, code violations)?
- Is there a deadline driving the sale (1031 exchange, divorce, estate, relocation)? That informs how much negotiation room exists.
- The area grade is low — what's the realistic commute time and amenity access for the typical tenant pool here? Any planned neighborhood developments (good or bad) we should know about?
- What's the average days-on-market for RENTAL listings here right now (not sales)? A rising rental-DOM trend means longer vacancies and softer asking-rent achievability than the comps imply.
- What's the recent tenant-quality profile in this submarket — average credit score on applications, eviction rate, late-payment / NSF rate, and stable-employment percentage? A property-management company in the area should have these aggregated.
- How much new for-sale + rental construction is in the pipeline within 1–3 miles? Heavy new supply typically softens prices + rents 12–24 months out; constrained supply supports both.
Investment metrics
- 1% rule
- 0.61% ✗
- Cap rate
- 4.96%
- Cash-on-cash
- -4.76%
- DSCR
- 0.79
- GRM
- 13.7
CMA / ARV
No comps found within radius.
Projected returns pro-forma
10.0% appreciation · 3.0% rent growth · sell at horizon
- IRR
- 20.9%
- Equity multiple
- 2.69×
- Total profit
- $149,531
- Equity at exit
- $284,588
- IRR
- 18.9%
- Equity multiple
- 6.17×
- Total profit
- $457,591
- Equity at exit
- $613,724
Cash invested: $88,452 (down + closing). Projections, not guarantees.
Landlord ↔ Tenant lean methodology
- Overall (STATE)
- 90 Strongly Landlord-Friendly
- State Alabama
- 90 Strongly Landlord-Friendly · R+15
- County
- — inherits STATE
- City
- — inherits STATE
ZIP-level market 35750
- Home prices YoY
- 8.2%
- Active inventory
- 260
- Price-to-rent
- 13.7×
Monthly cashflow live
- Estimated rent
- $1,917 high interval (Pro) →
- Mortgage (P&I)
- −$1,657
- Tax from tax record
- −$77 /mo · $928/yr
- Insurance
- −$132
- HOA
- −$0
- Lot rent
- −$0
- Vacancy / Maint / Mgmt
- −$403
- Net cashflow
- $-351
Break-even live
Sensitivity live
| Price | -10% $-172 | -5% $-262 | +0% $-351 | +5% $-440 | +10% $-530 |
|---|---|---|---|---|---|
| Rent | -10% $-502 | -5% $-427 | +0% $-351 | +5% $-275 | +10% $-199 |
| Rate | -1.0pp $-192 | -0.5pp $-271 | base $-351 | +0.5pp $-433 | +1.0pp $-516 |
UW: 25.0% down · 7.5% · 30yr · 1.5% tax · 5.0% vac · 8.0% maint · 8.0% mgmt
Financing live
Cash to close
- Down payment
- $78,975
- Closing costs
- $9,477
- Reserves months
- —
- Total cash needed
- —
Loan-product check · same deal, 3 products live
Conventional
25% down · 7.5% · 30yr
- Down + closing
- —
- Monthly P&I
- —
- Monthly cashflow
- —
- DSCR
- —
- Eligible?
- —
Personal DTI + credit; lowest rate.
DSCR
20% down · 8.5% · 30yr
- Down + closing
- —
- Monthly P&I
- —
- Monthly cashflow
- —
- DSCR
- —
- Eligible?
- —
No personal income docs; deal must DSCR.
Hard money
10% down · 12.0% · 12mo
- Down + closing
- —
- Monthly P&I
- —
- Monthly cashflow
- —
- DSCR
- —
- Eligible?
- —
Short-term bridge; refi at stabilization.
Rent comps 13 comps
| Address | Beds | Baths | Sqft | Rent | $/sqft | DOM | Units | Dist |
|---|---|---|---|---|---|---|---|---|
| 228 Hibiscus Dr Hazel Green, AL | 4.0 | 3.0 | 2502 | $2,595 | $1.04 | 23d | 1 | 0.80mi |
| 120 Elledge Farm Dr Hazel Green, AL | 4.0 | 2.0 | 1999 | $1,999 | $1.00 | 25d | 1 | 1.16mi |
| 115 Elledge Farm Dr Hazel Green, AL | 4.0 | 2.5 | 1990 | $1,648 | $0.83 | 25d | 1 | 1.21mi |
| 174 Meadow Ridge Dr Hazel Green, AL | 4.0 | 2.5 | 1932 | $1,850 | $0.96 | 25d | 1 | 1.22mi |
| 102 London Calvin Way Hazel Green, AL | 4.0 | 2.5 | 1924 | $1,745 | $0.91 | 25d | 1 | 1.25mi |
| 104 London Calvin Way Hazel Green, AL | 4.0 | 2.5 | 1971 | $1,745 | $0.89 | 25d | 1 | 1.26mi |
| 106 London Calvin Way Hazel Green, AL | 4.0 | 2.0 | 1797 | $1,684 | $0.94 | 46d | 1 | 1.28mi |
| 203 Hailey May Ct Hazel Green, AL | 4.0 | 2.0 | 1797 | $1,695 | $0.94 | 25d | 1 | 1.31mi |
| 206 Hailey May Ct Hazel Green, AL | 4.0 | 2.5 | 1924 | $1,745 | $0.91 | 16d | 1 | 1.32mi |
| 115 London Calvin Way Hazel Green, AL | 4.0 | 2.5 | 1971 | $1,734 | $0.88 | 46d | 1 | 1.33mi |
| 214 Briarcrest Rd Hazel Green, AL | 4.0 | 2.5 | 2091 | $1,825 | $0.87 | 25d | 1 | 1.35mi |
| 214 Briarcrest Rd Hazel Green, AL | 4.0 | 2.5 | 2091 | $1,825 | $0.87 | 46d | 1 | 1.35mi |
| 119 London Calvin Way Hazel Green, AL | 4.0 | 2.5 | 1924 | $1,745 | $0.91 | 16d | 1 | 1.35mi |
Listing history 28 events
-
2026-06-22days on market $315,900 Active 62 DOM
-
2026-06-18days on market $315,900 Active 59 DOM
-
2026-06-17days on market $315,900 Active 58 DOM
-
2026-06-16days on market $315,900 Active 57 DOM
-
2026-06-15days on market $315,900 Active 56 DOM
-
2026-06-14days on market $315,900 Active 54 DOM
-
2026-06-10days on market $315,900 Active 51 DOM
-
2026-06-09days on market $315,900 Active 50 DOM
-
2026-06-08days on market $315,900 Active 49 DOM
-
2026-06-07days on market $315,900 Active 48 DOM
-
2026-06-02days on market $315,900 Active 43 DOM
-
2026-06-01days on market $315,900 Active 42 DOM
-
2026-05-31days on market $315,900 Active 41 DOM
-
2026-05-30days on market $315,900 Active 40 DOM
-
2026-05-19status Active
-
2026-02-12$349,900 Active
-
2026-02-03historical
-
2026-02-03$379,900
-
2025-09-06$389,900 Active
-
2025-05-29price $379,900
-
2025-01-16$400,000 Active
-
2024-06-10soldstatus $210,000
-
2024-03-26$250,000 Active
-
2020-07-22soldstatus $130,000 Sold
-
2020-07-07historical Contingent
-
2020-05-06$150,000 Active
-
2015-04-13soldstatus $107,000
-
2015-02-04$90,000
ⓘ Source: listings_history table (triggers on properties + properties_extension) + one-shot
backfill from property_details.listing_events for pre-trigger history.
Tax reassessment forecast AL · Resets to sale price
- Current annual tax
- $928 · $77/mo
- Projected year-2 tax
- $1,295 · $108/mo
- Expected delta
- +$367/yr (+$31/mo · 39.5%)
ⓘ Screening estimate from a state-policy table — verify with the county assessor before closing.
Climate risk First Street
- Flood 1/10 Low FEMA zone X (unshaded) · 0% chance over 30 yrs
- Wildfire 3/10 Moderate
- Heat 5/10 Major 7 d/yr ≥104°F today · 19 d/yr by 30 yrs out
- Wind 4/10 Moderate 18% chance of damaging wind over 30 yrs
- Air quality 2/10 Low 0 unhealthy d/yr today · 1 by 30 yrs out
Nearby sold comps map
Loading sold comps map…
Walkable amenities ~0.75 mi
Loading nearby amenities…
Taxation est. · year 1
- Rental income
- $23,008
- − Mortgage interest
- −$17,695
- − Property taxes
- −$928
- − Insurance
- −$1,580
- − Repairs & maintenance
- −$1,841
- − Management
- −$1,841
- − Depreciation
- −$9,190
- Taxable loss
- −$10,066
- Est. tax savings @ 24.0%
- +$2,416
- After-tax cash flow
- $-1,795/yr
For passive investors: Depreciation is non-cash, so a rental often shows a tax loss while cash-flowing — sheltering income. Rental losses are passive: they offset passive income freely, and up to $25,000/yr can offset ordinary (W-2) income if you actively participate and your MAGI is under $100k (phasing out to $0 by $150k); unused losses carry forward. On sale, claimed depreciation is recaptured at up to 25%, and gains may owe capital-gains tax (a 1031 exchange can defer both). Figures are a year-1 estimate at your 24.0% rate — not tax advice; consult a CPA.
Schools (NCES district)
- District
- Madison County
- NCES district ID
- 0102220
- Math proficiency
- 27% ▼ -32.00%
- Reading proficiency
- 56% ▼ -1.00%
- Median HH income
- $66,058
- Composite
- 37.15/100
- National rank
- #4483
- State rank
- #19 of 129 in AL
Livability — Hazel Green
- Score
- 69/100
- State rank
- #54
- US rank
- #8575
Category grades
Schools grade is shown separately in the Schools card above.
Census & demographics
- Census place
- Hazel Green, AL
- County
- Madison County · 380,832 people
- City population
- 13,413
- Metro
- Huntsville, AL
- Population (ZIP)
- 13,413
- Household income
- $68,389
- Rent vs Own
- Severe rent burden
- 162.0
Population outlook (Madison County) Hauer SSP2
- Today (2025)
- 392,086 people
- By 2030
- 409,788 · +4.5%
- By 2040
- 440,557 · +12.4%
- By 2050
- 460,990 · +17.6%
- By 2075
- 502,872 · +28.3%
- By 2100
- 513,623 · +31.0%
Race, ethnicity, and origin ACS 2023
- Neighborhood character
- Predominantly White (71%)
- Race & ethnicity
- White 71% Black 19% Asian 5% Two or more races 3% Hispanic / Latino 2%
- Common ancestry
- Slovak 1% Serbian 1% Romanian 1%
- Foreign-born
- 3% · Canada
- Languages at home
- 95% English-only · Spanish 2% Chinese 1% Korean 1%
Political lean MEDSL · Madison
- 2024 margin
- Lean R (+9.0) · D 44.7% · R 53.7% · Other 1.6%
- 2008→2024 swing
- +6.0pp toward D · 2008: -14.9pp · 2024: -9.0pp
- All cycles
- 2024: R+9.0 2020: R+8.0 2016: R+16.8 2012: R+18.7 2008: R+14.9
Not yet ingested
- Civics
- —
Market trends
- HPI YoY
- ▲ 33.59%
- Current HPI
- 444.7418
- Rent YoY
- —
- Metro
- Huntsville, AL
- State GDP YoY
- ▲ 2.94%
- F500 in state
- 4
Industry mix (Fortune 500 HQ in AL)
| Industry | F500 HQs | Revenue |
|---|---|---|
| Financial Services | 1 | $8B |
|
||
| Healthcare | 1 | $5B |
|
||
Price history
+288.8% since first listed14 events — show timeline
- 2026-05-19 Relisted — VMLS
- 2026-02-12 Listed $349,900 VMLS
- 2026-02-03 Listing Removed — REALTRACS as Distributed by MLS Grid
- 2026-02-03 Listed $379,900 REALTRACS as Distributed by MLS Grid
- 2025-09-06 Listed $389,900 VMLS
- 2025-05-29 Price Changed $379,900 VMLS
- 2025-01-16 Listed $400,000 VMLS
- 2024-06-10 Sold (Public Records) $210,000 Public Records
- 2024-03-26 Listed $250,000 VMLS
- 2020-07-22 Sold (MLS) $130,000 VMLS
- 2020-07-07 Contingent — VMLS
- 2020-05-06 Listed $150,000 VMLS
- 2015-04-13 Sold (MLS) $107,000 VMLS
- 2015-02-04 Listed $90,000 VMLS
Property tax history
+3.0%/yrLatest (2020): $928 · +5.2% YoY. Source: county tax records.
Cash-flow waterfall
monthlySold comps — $/sqft
last 12 mo · ≤1 miLoading sold comps…