 🏷️ Likely Rental
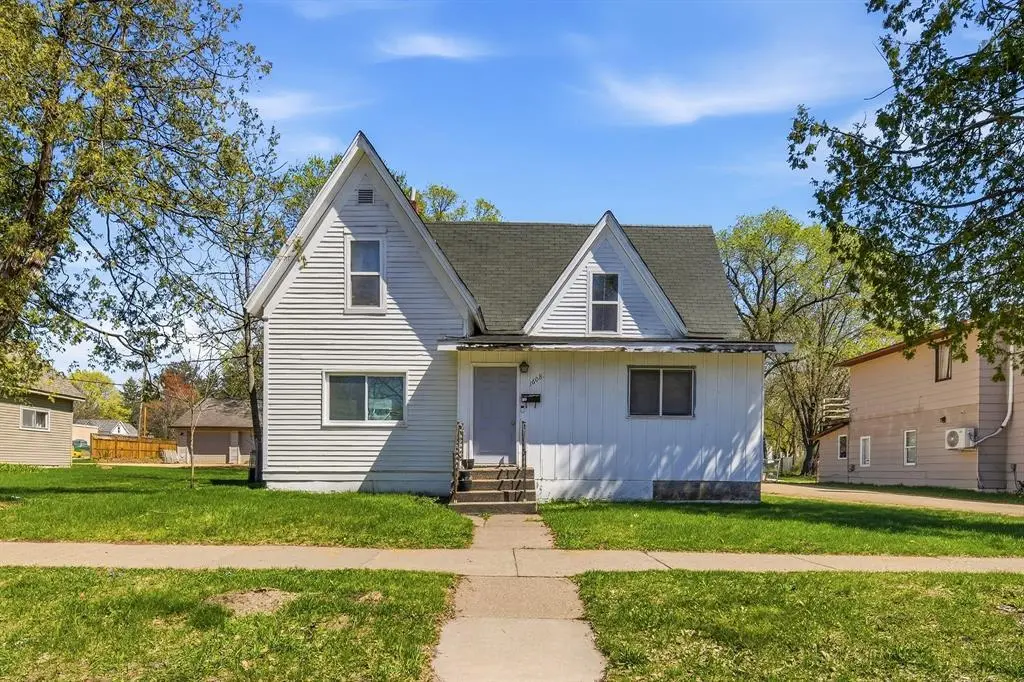
1608 9th St Unit house · Menomonie, WI
Flood risk 1/10 · Minimal
- FEMA flood zone
- X (unshaded)
- Chance of flooding over 30 yrs
- 0.0%
- Est. flood insurance / yr
- $473 – $860
Fire risk 2/10 · Minimal
- Est. fire insurance / yr
- $636 – $1,182
Heat risk 2/10 · Minimal
- Hot days now (above 99°F)
- 7 days/yr
- Hot days in 30 yrs
- 14 days/yr
Wind risk 1/10 · Minimal
- Chance of severe wind over 30 yrs
- —
Air-quality risk 1/10 · Minimal
- Unhealthy air days now
- 0 days/yr
- Unhealthy air days in 30 yrs
- 0 days/yr
Risk factors via First Street. Map © Google.
Why this score? — see what drove the C+ grade
The composite is a weighted blend of 9 inputs, each scored 0–100. Each bar is that input's sub-score; the figure is the points it added to the 100-point composite (weight × sub-score).
- Cash flow +22.3/30.0
- ARV discount +15.0/15.0
- DSCR +7.1/10.0
- 1% rule +5.8/10.0
- Livability +4.1/5.0
- Schools +3.4/10.0
- Rent growth +3.1/5.0
- Condition / age +2.5/5.0
- Appreciation +0.0/10.0
$185,000
🖨 Deal sheet 📄 Offer letter ✓ Due diligence
Listing remarks MLS
This 7-bedroom income-producing property boasts a strong rental history and is fully leased for the 2025?2026 school year at $1,590/month, with interest already building for 2026?2027. Fully leased for the year June 2026-May 2027 at $1800 a month, w/ tenants paying utilities. The main level features a spacious living room, two full bathrms, a large eat-in kitchen, and a convenient stackable washer and dryer. The interior is freshly painted in neutral tones, with well-maintained flooring throughout. Numerous windows have been updated for improved efficiency. A large, level parking area behind the home provides ample space for all tenants. Prime location near UW-Stout, Dick's Fresh Market, downtown Menomonie, and local parks.
Key facts
- Investment potential
- New windows
- Built 1900
Tags
Property features AI
Finance
- Other: Basement described as silo/other (see remarks)
Exterior
- Utilities: Municipal water; Municipal sewer; Natural gas
- Home design: Single-family, multi-level home; Estimated finished above-grade area about 1,846
- Construction: Finished above grade approximately 1,846
- Exterior features: Wood exterior; Less than 1/2 acre lot
Interior
- Kitchen: 13 x 13 kitchen; Range/Oven; Refrigerator; Dishwasher
- Bedrooms: Master bedroom on main level, about 13 x 10; Second bedroom on main level, about 13 x 14; Third bedroom on main level, about 13 x 7; Fourth bedroom on upper level, about 9 x 13
- Bathrooms: One full bathroom; One half bathroom
- Heating & cooling: Forced air heating (natural gas)
- Interior features: Circuit breakers
- Laundry & utility: Washer; Dryer
Neighborhood map
What this means for you Summary
Snapshot
- This is a 7-bed/1.5-bath other listed at $185k.
Deal economics
- At list price, monthly cash flow is $305 ($4k/yr) — positive.
- The deal already cash-flows at list — no discount required.
- Meets the 1% rule at list price ($2k rent vs $185k).
- Recommended offer: $179k (3.0% below list) — sets the bar for market timing.
- Cap rate 8.3% vs local median 3.7% in Menomonie — top-decile yield for the area; either an underpriced asset or a hidden risk that comps aren't pricing in. Stress-test before assuming the spread holds.
Location & tenants
- Location reads 82/100 on livability (#50 in WI, #1,248 nationally) — a professional / high-income tenant draw. Strengths: cost of living A+, housing A+, health & safety A+; Watch: schools D+, employment D+, amenities F.
- Menomonie Area School District (town): math 40% / reading 40% proficiency, ranked #157 of 342 in WI (top 46%) — families likely to look elsewhere, expect single-tenant / working-renter base with shorter leases.
- Market conditions: Rents rising (+2.6%/yr); 105 active listings in the ZIP; 151 units permitted in Dunn County in 2024 (0 in 5+ unit buildings).
- This rent runs 33% of the median local income ($72k/yr) — at the standard rent-burdened threshold; future hikes will face affordability resistance.
Forward outlook
- Local home prices are declining (-3.0%/yr); year-one equity from $1k of loan paydown is wiped out by about $6k of value loss. Plan a longer hold.
Negotiation context
- It's been on market 38 days — a 3% lower offer ($179k) is reasonable based on typical stale-listing flexibility.
- 5 sale attempts since 20y ago; this cycle's ask has dropped $10k (5%) from the opening price — seller is motivated, your offer sets the floor, not the list.
- Current owner paid $95k; list at $185k implies a 95% gain — meaningful room to come down on a strong offer.
Risks & watch-outs
- Watch-outs: built in 1900 — expect roof / HVAC / electrical / plumbing capex.
Questions for the listing agent
- It's been on market 38 days. Have you received any prior offers? Is the seller open to a 3% concession, seller financing, or rate buy-down credit?
- Built in 1900 — when were the roof, HVAC, electrical panel, plumbing, and water heater last replaced?
- Is there a deadline driving the sale (1031 exchange, divorce, estate, relocation)? That informs how much negotiation room exists.
- Schools are D-rated, which usually means shorter tenancies and higher turnover. Who's the typical renter profile here, and what's been the actual vacancy rate?
- What's the average days-on-market for RENTAL listings here right now (not sales)? A rising rental-DOM trend means longer vacancies and softer asking-rent achievability than the comps imply.
- What's the recent tenant-quality profile in this submarket — average credit score on applications, eviction rate, late-payment / NSF rate, and stable-employment percentage? A property-management company in the area should have these aggregated.
- How much new for-sale + rental construction is in the pipeline within 1–3 miles? Heavy new supply typically softens prices + rents 12–24 months out; constrained supply supports both.
Investment metrics
- 1% rule
- 1.08% ✓
- Cap rate
- 8.27%
- Cash-on-cash
- 7.07%
- DSCR
- 1.31
- GRM
- 7.7
CMA / ARV
- ARV (median comp)
- $287,486
- List price
- $185,000
- Delta
- -35.65%
- Verdict
- UNDERPRICED
- Comps
- 1 within 2.0 mi
Projected returns pro-forma
-3.0% appreciation · 2.59% rent growth · sell at horizon
- IRR
- -5.9%
- Equity multiple
- 0.78×
- Total profit
- $-11,325
- Equity at exit
- $27,584
- IRR
- 3.3%
- Equity multiple
- 1.23×
- Total profit
- $11,947
- Equity at exit
- $15,995
Cash invested: $51,800 (down + closing). Projections, not guarantees.
Landlord ↔ Tenant lean methodology
- Overall (STATE)
- 73 Landlord-Friendly
- State Wisconsin
- 73 Landlord-Friendly · R+2
- County
- — inherits STATE
- City
- — inherits STATE
ZIP-level market 54751
- Rents YoY
- 2.6%
- Active inventory
- 105
- Price-to-rent
- 7.7×
Monthly cashflow live
- Estimated rent
- $1,995 medium interval (Pro) →
- Mortgage (P&I)
- −$970
- Tax from tax record
- −$223 /mo · $2,678/yr
- Insurance
- −$77
- HOA
- −$0
- Vacancy / Maint / Mgmt
- −$419
- Net cashflow
- $305
Break-even live
UW: 25.0% down · 7.5% · 30yr · 1.5% tax · 5.0% vac · 8.0% maint · 8.0% mgmt
Financing live
Cash to close
- Down payment
- $46,250
- Closing costs
- $5,550
- Reserves months
- —
- Total cash needed
- —
Loan-product check · same deal, 3 products live
Conventional
25% down · 7.5% · 30yr
- Down + closing
- —
- Monthly P&I
- —
- Monthly cashflow
- —
- DSCR
- —
- Eligible?
- —
Personal DTI + credit; lowest rate.
DSCR
20% down · 8.5% · 30yr
- Down + closing
- —
- Monthly P&I
- —
- Monthly cashflow
- —
- DSCR
- —
- Eligible?
- —
No personal income docs; deal must DSCR.
Hard money
10% down · 12.0% · 12mo
- Down + closing
- —
- Monthly P&I
- —
- Monthly cashflow
- —
- DSCR
- —
- Eligible?
- —
Short-term bridge; refi at stabilization.
Listing history 27 events
-
2026-06-19days on market $185,000 Active 38 DOM
-
2026-06-18days on market $185,000 Active 37 DOM
-
2026-06-17days on market $185,000 Active 36 DOM
-
2026-06-16days on market $185,000 Active 35 DOM
-
2026-06-15days on market $185,000 Active 34 DOM
-
2026-06-14days on market $185,000 Active 32 DOM
-
2026-06-12days on market $185,000 Active 31 DOM
-
2026-06-09days on market $185,000 Active 28 DOM
-
2026-06-08days on market $185,000 Active 27 DOM
-
2026-06-07days on market $185,000 Active 26 DOM
-
2026-06-05pricedays on market $185,000 Active 24 DOM
-
2026-06-03days on market $195,000 Active 22 DOM
-
2026-06-02days on market $195,000 Active 21 DOM
-
2026-06-01days on market $195,000 Active 20 DOM
-
2026-05-31days on market $195,000 Active 19 DOM
-
2026-05-30days on market $195,000 Active 18 DOM
-
2026-05-12$195,000 Active 269-char remark
-
2025-09-26historical 733-char remark
Show marketing remark (733 chars)
This 7-bedroom income-producing property boasts a strong rental history and is fully leased for the 2025?2026 school year at $1,590/month, with interest already building for 2026?2027. Fully leased for the year June 2026-May 2027 at $1800 a month, w/ tenants paying utilities. The main level features a spacious living room, two full bathrms, a large eat-in kitchen, and a convenient stackable washer and dryer. The interior is freshly painted in neutral tones, with well-maintained flooring throughout. Numerous windows have been updated for improved efficiency. A large, level parking area behind the home provides ample space for all tenants. Prime location near UW-Stout, Dick's Fresh Market, downtown Menomonie, and local parks.
-
2025-03-25$185,000 Active 733-char remark
Show marketing remark (733 chars)
This 7-bedroom income-producing property boasts a strong rental history and is fully leased for the 2025?2026 school year at $1,590/month, with interest already building for 2026?2027. Fully leased for the year June 2026-May 2027 at $1800 a month, w/ tenants paying utilities. The main level features a spacious living room, two full bathrms, a large eat-in kitchen, and a convenient stackable washer and dryer. The interior is freshly painted in neutral tones, with well-maintained flooring throughout. Numerous windows have been updated for improved efficiency. A large, level parking area behind the home provides ample space for all tenants. Prime location near UW-Stout, Dick's Fresh Market, downtown Menomonie, and local parks.
-
2019-10-08soldstatus $95,000
-
2012-12-13historical
-
2012-07-13$109,000
-
2008-11-10historical
-
2008-06-09$115,000
-
2006-09-30historical
-
2006-04-01$119,900
-
2000-05-04soldstatus $70,000
ⓘ Source: listings_history table (triggers on properties + properties_extension) + one-shot
backfill from property_details.listing_events for pre-trigger history.
Tax reassessment forecast WI · Partial reset (capped growth)
- Current annual tax
- $2,678 · $223/mo
- Projected year-2 tax
- $3,050 · $254/mo
- Expected delta
- +$372/yr (+$31/mo · 13.9%)
ⓘ Screening estimate from a state-policy table — verify with the county assessor before closing.
Climate risk First Street
- Flood 1/10 Low FEMA zone X (unshaded) · 0% chance over 30 yrs
- Wildfire 2/10 Low
- Heat 2/10 Low 7 d/yr ≥99°F today · 14 d/yr by 30 yrs out
- Wind 1/10 Low
- Air quality 1/10 Low 0 unhealthy d/yr today · 0 by 30 yrs out
Nearby sold comps map
Loading sold comps map…
Walkable amenities ~0.75 mi
Loading nearby amenities…
Taxation est. · year 1
- Rental income
- $23,935
- − Mortgage interest
- −$10,363
- − Property taxes
- −$2,678
- − Insurance
- −$925
- − Repairs & maintenance
- −$1,915
- − Management
- −$1,915
- − Depreciation
- −$5,382
- Taxable income
- $758
- Est. tax owed @ 24.0%
- −$182
- After-tax cash flow
- $3,482/yr
For passive investors: Depreciation is non-cash, so a rental often shows a tax loss while cash-flowing — sheltering income. Rental losses are passive: they offset passive income freely, and up to $25,000/yr can offset ordinary (W-2) income if you actively participate and your MAGI is under $100k (phasing out to $0 by $150k); unused losses carry forward. On sale, claimed depreciation is recaptured at up to 25%, and gains may owe capital-gains tax (a 1031 exchange can defer both). Figures are a year-1 estimate at your 24.0% rate — not tax advice; consult a CPA.
Schools (NCES district)
- District
- Menomonie Area School District
- NCES district ID
- 5509090
- Math proficiency
- 40% ▼ -1.00%
- Reading proficiency
- 40% ▲ 2.00%
- Median HH income
- $47,172
- Composite
- 34.23/100
- National rank
- #5262
- State rank
- #157 of 342 in WI
Livability — Menomonie
- Score
- 82/100
- State rank
- #50
- US rank
- #1248
Category grades
Schools grade is shown separately in the Schools card above.
Census & demographics
- Census place
- Menomonie, WI
- County
- Dunn County · 26,193 people
- City population
- 26,193
- Metro
- Menomonie, WI
- Population (ZIP)
- 26,193
- Household income
- $72,028
- Rent vs Own
- Severe rent burden
- 821.0
Population outlook (Dunn County) Hauer SSP2
- Today (2025)
- 45,435 people
- By 2030
- 45,694 · +0.6%
- By 2040
- 45,329 · -0.2%
- By 2050
- 44,343 · -2.4%
- By 2075
- 42,497 · -6.5%
- By 2100
- 40,616 · -10.6%
Race, ethnicity, and origin ACS 2023
- Neighborhood character
- Predominantly White (89%)
- Race & ethnicity
- White 89% Asian 5% Two or more races 3% Hispanic / Latino 2% Black 1%
- Common ancestry
- Portuguese 15% Romanian 6% Lithuanian 3%
- Foreign-born
- 3% · China, Canada
- Languages at home
- 94% English-only · Other Asian/Pacific 3% Spanish 1% Chinese 1%
Political lean MEDSL · Dunn
- 2024 margin
- R (+15.9) · D 41.5% · R 57.4% · Other 1.2%
- 2008→2024 swing
- -30.9pp toward R · 2008: 14.9pp · 2024: -15.9pp
- All cycles
- 2024: R+15.9 2020: R+13.9 2016: R+11.2 2012: D+5.0 2008: D+14.9
Not yet ingested
- Civics
- —
Market trends
- HPI YoY
- ▼ -134.07%
- Current HPI
- 214.7943
- Rent YoY
- ▲ 2.59%
- Metro
- Menomonie, WI
- State GDP YoY
- ▲ 2.10%
- F500 in state
- 20
Industry mix (Fortune 500 HQ in WI)
| Industry | F500 HQs | Revenue |
|---|---|---|
| Industrial Machinery | 4 | $23B |
|
||
| Industrial Technology | 2 | $36B |
|
||
| Insurance | 1 | $36B |
|
||
| Professional Services | 1 | $19B |
|
||
| Utilities | 1 | $9B |
|
||
| Consumer Goods | 1 | $3B |
|
||
Price history
+164.3% since first listed12 events — show timeline
- 2026-06-05 Price Changed $185,000 RANWW
- 2026-05-12 Listed $195,000 RANWW
- 2025-09-26 Listing Removed — RANWW
- 2025-03-25 Listed $185,000 RANWW
- 2019-10-08 Sold (Public Records) $95,000 Public Records
- 2012-12-13 Listing Removed — NORTHSTARMLS as Distributed by MLS Grid
- 2012-07-13 Listed $109,000 NORTHSTARMLS as Distributed by MLS Grid
- 2008-11-10 Listing Removed — NORTHSTARMLS as Distributed by MLS Grid
- 2008-06-09 Listed $115,000 NORTHSTARMLS as Distributed by MLS Grid
- 2006-09-30 Listing Removed — NORTHSTARMLS as Distributed by MLS Grid
- 2006-04-01 Listed $119,900 NORTHSTARMLS as Distributed by MLS Grid
- 2000-05-04 Sold (Public Records) $70,000 Public Records
Property tax history
+1.2%/yrLatest (2025): $2,678 · +3.3% YoY. Source: county tax records.
Cash-flow waterfall
monthlySold comps — $/sqft
last 12 mo · ≤1 miLoading sold comps…