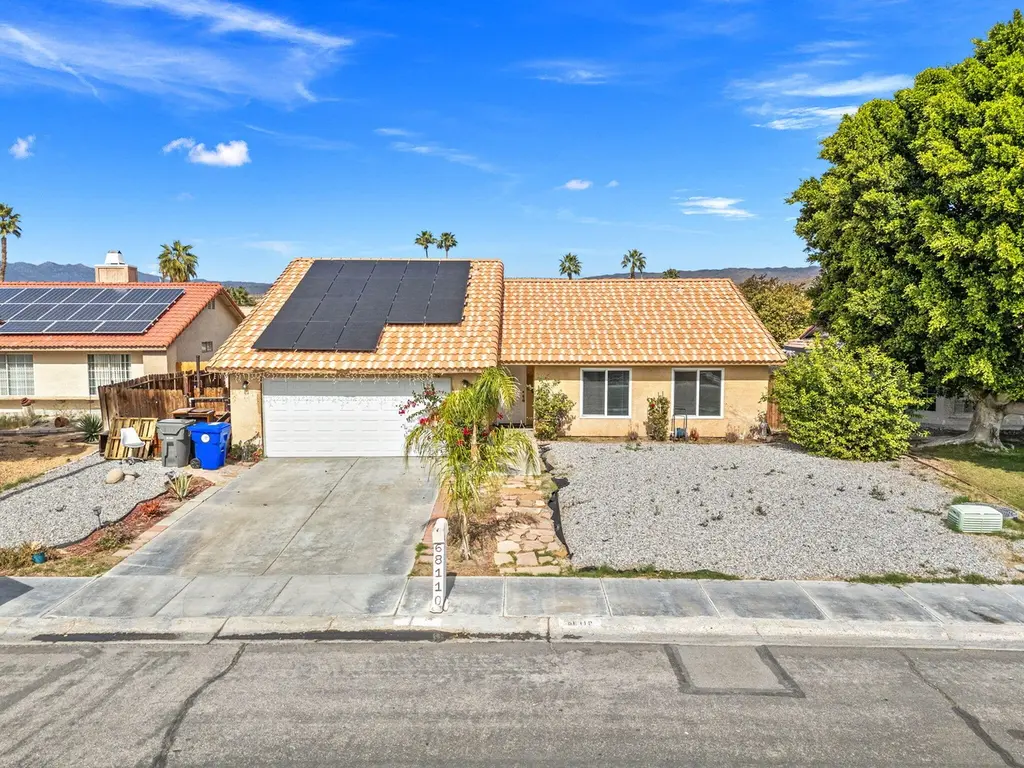
68110 Empalmo Rd · Cathedral City, CA
Flood risk 1/10 · Minimal
- FEMA flood zone
- X
- Chance of flooding over 30 yrs
- 0.0%
- Est. flood insurance / yr
- $507 – $1,088
Fire risk 1/10 · Minimal
- Est. fire insurance / yr
- $659 – $1,223
Heat risk 9/10 · Severe
- Hot days now (above 113°F)
- 6 days/yr
- Hot days in 30 yrs
- 18 days/yr
Wind risk 1/10 · Minimal
- Chance of severe wind over 30 yrs
- —
Air-quality risk 5/10 · Moderate
- Unhealthy air days now
- 6 days/yr
- Unhealthy air days in 30 yrs
- 8 days/yr
Risk factors via First Street. Map © Google.
Why this score? — see what drove the C- grade
The composite is a weighted blend of 9 inputs, each scored 0–100. Each bar is that input's sub-score; the figure is the points it added to the 100-point composite (weight × sub-score).
- Cash flow +17.4/30.0
- ARV discount +14.0/15.0
- DSCR +5.4/10.0
- 1% rule +3.9/10.0
- Rent growth +3.3/5.0
- Livability +3.3/5.0
- Schools +2.7/10.0
- Condition / age +2.5/5.0
- Appreciation +0.0/10.0
$439,000
🖨 Deal sheet 📄 Offer letter ✓ Due diligence
Listing remarks MLS
Lowest Priced Single Family Residence in Cathedral City | No HOA | Solar | No Lease Land | Fixer with Large Lot & Pool Potential As of the time of this listing, 68110 Empalmo Road is the lowest priced single family residence in all of Cathedral City creating a rare opportunity for both investors and homebuyers to enter the market at an exceptional price point. Located in the desirable Panorama neighborhood, known for its established homes and central convenience, this 3 bedroom, 2 bath residence offers approximately 1,477 square feet of living space on an oversized 8,000+ square foot lot. This fixer presents a blank canvas ready for your vision. Whether you're an investor seeking a value-add project or a homebuyer looking to personalize and build sweat equity, the functional layout, natural light, spacious living area, and 2 car garage provide a solid starting point. The expansive backyard offers ample room for a pool, outdoor entertaining space, or future enhancements- perfect for creating your own private desert retreat. Conveniently located near shopping, dining, schools, and commuter routes, this property combines location, lot size, and opportunity in one compelling package. Fixer. Blank canvas. Equity potential. Room to grow. Bring your ideas and make it your own!
Key facts
- No lease land
- Solar
- Large lot
Tags
Neighborhood map
What this means for you Summary
Snapshot
- This is a 3-bed/2.0-bath single-family listed at $439k.
Deal economics
- At list price, monthly cash flow is $330 ($4k/yr) — positive.
- The deal already cash-flows at list — no discount required.
- To meet the 1% rule (rent ≥ 1% of price), the offer needs to be $391k (11.0% below list).
- Recommended offer: $391k (11.0% below list) — sets the bar for 1% rule.
- Cap rate 7.2% vs local median 5.1% in Cathedral City — top-decile yield for the area; either an underpriced asset or a hidden risk that comps aren't pricing in. Stress-test before assuming the spread holds.
Location & tenants
- Location reads 66/100 on livability (#344 in CA) — a middle-class / working-renter tenant base. Strengths: commute A+, housing B+; Watch: employment D+, schools F, amenities D-.
- Palm Springs Unified (suburban): math 21% / reading 42% proficiency, ranked #328 of 517 in CA (top 63%) — families likely to look elsewhere, expect single-tenant / working-renter base with shorter leases; 73% free/reduced lunch — lower-income household profile, screen leases tightly.
- Market conditions: Rents rising (+3.2%/yr); 525 active listings in the ZIP; 40 comparable units currently listed for rent nearby; rentals lingering (median 44d on market — plan ~5-8 weeks vacancy on turnover, expect pricing pressure); 70% of comp listings sitting > 30 days — soft ceiling on asking rent; 9,195 units permitted in Riverside County in 2024 (1,512 in 5+ unit buildings).
- At $3,909/mo this rent would consume 64% of the median local household income ($74k/yr) (locally 1682% of renters already pay >50% of income on rent) — very limited rent-growth headroom before tenants either downsize or default.
Forward outlook
- Local home prices are declining (-3.0%/yr); year-one equity from $3k of loan paydown is wiped out by about $13k of value loss. Plan a longer hold.
- Riverside County population projected at +22% by 2050 — long-run rental-demand tailwind backs the buy-and-hold thesis.
Negotiation context
- It's been on market 90 days — a 6% lower offer ($413k) is reasonable based on typical stale-listing flexibility.
- Current owner paid $71k; list at $439k implies a 518% gain — meaningful room to come down on a strong offer.
Risks & watch-outs
- Climate carrying-cost: extreme-heat days projected 6→18/yr by 2055 (HVAC capex compounding) — expect insurance premiums to compound above CPI over the hold.
Questions for the listing agent
- It's been on market 90 days. Have you received any prior offers? Is the seller open to a 11% concession, seller financing, or rate buy-down credit?
- Why hasn't it sold? Are there any deal-killer items the seller is aware of (foundation, flood, title, zoning, code violations)?
- Is there a deadline driving the sale (1031 exchange, divorce, estate, relocation)? That informs how much negotiation room exists.
- Schools are F-rated, which usually means shorter tenancies and higher turnover. Who's the typical renter profile here, and what's been the actual vacancy rate?
- What's the average days-on-market for RENTAL listings here right now (not sales)? A rising rental-DOM trend means longer vacancies and softer asking-rent achievability than the comps imply.
- What's the recent tenant-quality profile in this submarket — average credit score on applications, eviction rate, late-payment / NSF rate, and stable-employment percentage? A property-management company in the area should have these aggregated.
- How much new for-sale + rental construction is in the pipeline within 1–3 miles? Heavy new supply typically softens prices + rents 12–24 months out; constrained supply supports both.
Investment metrics
- 1% rule
- 0.89% ✗
- Cap rate
- 7.19%
- Cash-on-cash
- 3.22%
- DSCR
- 1.14
- GRM
- 9.4
CMA / ARV
- ARV (median comp)
- $513,145
- List price
- $439,000
- Delta
- -14.45%
- Verdict
- UNDERPRICED
- Comps
- 20 within 1.0 mi
Show comp detail 12 sales within ~0.75 mi
| Address | Dist | Beds/Ba | Sqft | Sold | Price | $/sf | Match |
|---|---|---|---|---|---|---|---|
| 68015 Estio Rd | 0.19mi | 3/2.0 | 1,352 (-8%) | 2mo | $436,400 | $323 | 76 |
| 68073 Madrid Rd | 0.32mi | 3/2.0 | 1,580 (+7%) | 0mo | $526,500 | $333 | 73 |
| 68325 Peladora Rd | 0.33mi | 3/2.0 | 1,320 (-11%) | 2mo | $532,000 | $403 | 65 |
| 68750 Fortuna Rd | 0.61mi | 3/2.0 | 1,565 (+6%) | 2mo | $500,000 | $319 | 60 |
| 67705 Ovante Rd | 0.57mi | 4/2.0 (+1) | 1,531 (+4%) | 4mo | $467,000 | $305 | 59 |
| 68495 Pasada Rd | 0.30mi | 4/3.0 (+1) | 1,659 (+12%) | 0mo | $505,000 | $304 | 56 |
| 68090 Santelmo Rd | 0.30mi | 4/3.0 (+1) | 1,681 (+14%) | 0mo | $510,000 | $303 | 54 |
| 68220 Risueno Rd | 0.72mi | 3/2.0 | 1,350 (-9%) | 0mo | $469,000 | $347 | 52 |
| 29597 E Trancas Dr | 0.70mi | 2/2.5 (-1) | 1,576 (+7%) | 3mo | $419,000 | $266 | 47 |
| 67720 S Natoma Dr | 0.69mi | 3/2.5 | 1,684 (+14%) | 0mo | $474,900 | $282 | 42 |
| 68785 Jarana Rd | 0.70mi | 3/2.5 | 1,281 (-13%) | 3mo | $510,000 | $398 | 41 |
| 68875 Vista Chino | 0.66mi | 4/2.5 (+1) | 1,685 (+14%) | 4mo | $515,000 | $306 | 35 |
Match score weights: distance 35% · size 25% · config 20% · recency 20%. Top-matched comps best support the ARV.
Projected returns pro-forma
-3.0% appreciation · 3.22% rent growth · sell at horizon
- IRR
- -11.0%
- Equity multiple
- 0.60×
- Total profit
- $-49,364
- Equity at exit
- $65,456
- IRR
- -1.5%
- Equity multiple
- 0.90×
- Total profit
- $-12,797
- Equity at exit
- $37,957
Cash invested: $122,920 (down + closing). Projections, not guarantees.
Landlord ↔ Tenant lean methodology
- Overall (STATE)
- 18 Strongly Tenant-Friendly
- State California
- 18 Strongly Tenant-Friendly · D+13
- County
- — inherits STATE
- City
- — inherits STATE
ZIP-level market 92234
- Home prices YoY
- -27.7%
- Rents YoY
- 3.2%
- Active inventory
- 525
- Price-to-rent
- 9.4×
Monthly cashflow live
- Estimated rent
- $3,909 high interval (Pro) →
- Mortgage (P&I)
- −$2,302
- Tax from tax record
- −$273 /mo · $3,278/yr
- Insurance
- −$183
- HOA
- −$0
- Vacancy / Maint / Mgmt
- −$821
- Net cashflow
- $330
Break-even live
UW: 25.0% down · 7.5% · 30yr · 1.5% tax · 5.0% vac · 8.0% maint · 8.0% mgmt
Financing live
Cash to close
- Down payment
- $109,750
- Closing costs
- $13,170
- Reserves months
- —
- Total cash needed
- —
Loan-product check · same deal, 3 products live
Conventional
25% down · 7.5% · 30yr
- Down + closing
- —
- Monthly P&I
- —
- Monthly cashflow
- —
- DSCR
- —
- Eligible?
- —
Personal DTI + credit; lowest rate.
DSCR
20% down · 8.5% · 30yr
- Down + closing
- —
- Monthly P&I
- —
- Monthly cashflow
- —
- DSCR
- —
- Eligible?
- —
No personal income docs; deal must DSCR.
Hard money
10% down · 12.0% · 12mo
- Down + closing
- —
- Monthly P&I
- —
- Monthly cashflow
- —
- DSCR
- —
- Eligible?
- —
Short-term bridge; refi at stabilization.
Rent comps 40 comps
| Address | Beds | Baths | Sqft | Rent | $/sqft | DOM | Units | Dist |
|---|---|---|---|---|---|---|---|---|
| 68320 Espada Rd Cathedral City, CA | 4.0 | 3.0 | 1600 | $2,995 | $1.87 | 43d | 1 | 0.21mi |
| 68325 Peladora Rd Cathedral City, CA | 3.0 | 2.0 | 1320 | $3,199 | $2.42 | 14d | 1 | 0.30mi |
| 28763 E Portales Dr Cathedral City, CA | 2.0 | 2.0 | 984 | $4,200 | $4.27 | 7d | 1 | 0.33mi |
| 27875 Avenida Maravilla Cathedral City, CA | 4.0 | 3.0 | 1865 | $4,650 | $2.49 | 2d | 1 | 0.35mi |
| 67847 N Portales Dr Unit 288 Cathedral City, CA | 2.0 | 2.0 | 1212 | $4,200 | $3.47 | 43d | 1 | 0.40mi |
| 67821 N Portales Dr Cathedral City, CA | 2.0 | 2.0 | 1177 | $4,000 | $3.40 | 43d | 1 | 0.43mi |
| 67821 N Portales Dr Unit 251 Cathedral City, CA | 2.0 | 2.0 | 1177 | $4,000 | $3.40 | 24d | 1 | 0.43mi |
| 28868 Isleta Ct Unit 702 Cathedral City, CA | 2.0 | 2.0 | 1285 | $4,900 | $3.81 | 24d | 1 | 0.44mi |
| 28868 Isleta Ct Cathedral City, CA | 2.0 | 2.0 | 1285 | $4,900 | $3.81 | 43d | 1 | 0.44mi |
| 29199 E Portales Dr Unit 702 Cathedral City, CA | 2.0 | 2.0 | 1177 | $4,200 | $3.57 | 43d | 1 | 0.45mi |
| 68125 Alva Ct Cathedral City, CA | 3.0 | 2.0 | 1544 | $3,200 | $2.07 | 43d | 1 | 0.45mi |
| 28827 Isleta Ct Cathedral City, CA | 3.0 | 2.0 | 1285 | $4,500 | $3.50 | 43d | 1 | 0.46mi |
| 67765 Ovante Rd Cathedral City, CA | 3.0 | 2.0 | 1446 | $2,699 | $1.87 | 14d | 1 | 0.52mi |
| 68640 Tachevah Dr Cathedral City, CA | 3.0 | 2.0 | 1290 | $3,200 | $2.48 | 24d | 1 | 0.57mi |
| 68640 Tachevah Dr Cathedral City, CA | 3.0 | 2.0 | 1290 | $3,200 | $2.48 | 12d | 1 | 0.57mi |
| 28914 Desert Princess Dr Unit 702 Palm Springs, CA | 2.0 | 2.0 | 1212 | $4,200 | $3.47 | 24d | 1 | 0.59mi |
| 28964 Desert Princess Dr Cathedral City, CA | 2.0 | 2.0 | 1177 | $2,700 | $2.29 | 43d | 1 | 0.60mi |
| 28464 Taos Ct Cathedral City, CA | 2.0 | 2.0 | 1212 | $2,100 | $1.73 | 23d | 1 | 0.61mi |
| 29118 Desert Princess Dr Unit 702 Cathedral City, CA | 2.0 | 2.0 | 1212 | $4,200 | $3.47 | 43d | 1 | 0.61mi |
| 67645 S Natoma Dr Cathedral City, CA | 2.0 | 3.0 | 1686 | $6,800 | $4.03 | 43d | 1 | 0.62mi |
| 28602 Taos Ct Cathedral City, CA | 2.0 | 2.0 | 1212 | $4,000 | $3.30 | 43d | 1 | 0.63mi |
| 29521 E Trancas Dr Cathedral City, CA | 2.0 | 3.0 | 1576 | $5,500 | $3.49 | 43d | 1 | 0.64mi |
| 28477 Taos Ct Cathedral City, CA | 2.0 | 2.0 | 1212 | $4,000 | $3.30 | 43d | 1 | 0.64mi |
| 28859 Desert Princess Dr Cathedral City, CA | 3.0 | 2.0 | 1285 | $3,700 | $2.88 | 43d | 1 | 0.65mi |
| 28656 Taos Ct Cathedral City, CA | 2.0 | 2.0 | 1177 | $2,200 | $1.87 | 43d | 1 | 0.65mi |
| 67553 N Portales Dr Unit 288 Cathedral City, CA | 2.0 | 2.0 | 1212 | $4,200 | $3.47 | 24d | 1 | 0.67mi |
| 67553 N Portales Dr Cathedral City, CA | 2.0 | 2.0 | 1212 | $4,200 | $3.47 | 43d | 1 | 0.67mi |
| 68725 Tachevah Dr Cathedral City, CA | 3.0 | 3.0 | 1822 | $4,500 | $2.47 | 43d | 1 | 0.67mi |
| 28764 Taos Ct Cathedral City, CA | 2.0 | 2.0 | 1177 | $4,400 | $3.74 | 43d | 1 | 0.68mi |
| 67665 Lagos Way Cathedral City, CA | 3.0 | 2.0 | 1285 | $4,500 | $3.50 | 43d | 1 | 0.68mi |
| 67552 N Natoma Dr Cathedral City, CA | 2.0 | 2.0 | 1177 | $4,200 | $3.57 | 43d | 1 | 0.68mi |
| 29576 Sandy Ct Cathedral City, CA | 3.0 | 2.0 | 1503 | $5,000 | $3.33 | 43d | 1 | 0.69mi |
| 67727 S Natoma Dr Cathedral City, CA | 2.0 | 3.0 | 1425 | $4,500 | $3.16 | 43d | 1 | 0.70mi |
| 28455 Avenida La Vis Unit B Cathedral City, CA | 2.0 | 2.0 | 1100 | $1,995 | $1.81 | 43d | 1 | 0.71mi |
| 68705 Tortuga Rd Cathedral City, CA | 3.0 | 2.0 | 1248 | $3,600 | $2.88 | 43d | 1 | 0.75mi |
| 67595 Lagos Way Cathedral City, CA | 3.0 | 3.0 | 1285 | $3,500 | $2.72 | 43d | 1 | 0.75mi |
| 27500 Avenida Quintana Cathedral City, CA | 3.0 | 2.0 | 1865 | $3,500 | $1.88 | 21d | 1 | 0.76mi |
| 67646 S Natoma Dr Cathedral City, CA | 2.0 | 3.0 | 1686 | $6,000 | $3.56 | 43d | 1 | 0.76mi |
| 29756 Sandy Ct Cathedral City, CA | 3.0 | 3.0 | 1732 | $4,900 | $2.83 | 43d | 1 | 0.76mi |
| 67659 S Natoma Dr Cathedral City, CA | 2.0 | 2.5 | 1684 | $6,800 | $4.04 | 43d | 1 | 0.76mi |
Listing history 4 events
-
2026-04-22price $439,000 1297-char remark
Show marketing remark (1297 chars)
Lowest Priced Single Family Residence in Cathedral City | No HOA | Solar | No Lease Land | Fixer with Large Lot & Pool Potential As of the time of this listing, 68110 Empalmo Road is the lowest priced single family residence in all of Cathedral City creating a rare opportunity for both investors and homebuyers to enter the market at an exceptional price point. Located in the desirable Panorama neighborhood, known for its established homes and central convenience, this 3 bedroom, 2 bath residence offers approximately 1,477 square feet of living space on an oversized 8,000+ square foot lot. This fixer presents a blank canvas ready for your vision. Whether you're an investor seeking a value-add project or a homebuyer looking to personalize and build sweat equity, the functional layout, natural light, spacious living area, and 2 car garage provide a solid starting point. The expansive backyard offers ample room for a pool, outdoor entertaining space, or future enhancements- perfect for creating your own private desert retreat. Conveniently located near shopping, dining, schools, and commuter routes, this property combines location, lot size, and opportunity in one compelling package. Fixer. Blank canvas. Equity potential. Room to grow. Bring your ideas and make it your own!
-
2026-02-28$449,000 Active 1297-char remark
Show marketing remark (1297 chars)
Lowest Priced Single Family Residence in Cathedral City | No HOA | Solar | No Lease Land | Fixer with Large Lot & Pool Potential As of the time of this listing, 68110 Empalmo Road is the lowest priced single family residence in all of Cathedral City creating a rare opportunity for both investors and homebuyers to enter the market at an exceptional price point. Located in the desirable Panorama neighborhood, known for its established homes and central convenience, this 3 bedroom, 2 bath residence offers approximately 1,477 square feet of living space on an oversized 8,000+ square foot lot. This fixer presents a blank canvas ready for your vision. Whether you're an investor seeking a value-add project or a homebuyer looking to personalize and build sweat equity, the functional layout, natural light, spacious living area, and 2 car garage provide a solid starting point. The expansive backyard offers ample room for a pool, outdoor entertaining space, or future enhancements- perfect for creating your own private desert retreat. Conveniently located near shopping, dining, schools, and commuter routes, this property combines location, lot size, and opportunity in one compelling package. Fixer. Blank canvas. Equity potential. Room to grow. Bring your ideas and make it your own!
-
1995-12-29soldstatus $71,000
-
1989-03-03soldstatus $20,000
ⓘ Source: listings_history table (triggers on properties + properties_extension) + one-shot
backfill from property_details.listing_events for pre-trigger history.
Tax reassessment forecast CA · Resets to sale price
- Current annual tax
- $3,278 · $273/mo
- Projected year-2 tax
- $3,336 · $278/mo
- Expected delta
- +$58/yr (+$5/mo · 1.8%)
ⓘ Screening estimate from a state-policy table — verify with the county assessor before closing.
Climate risk First Street
- Flood 1/10 Low FEMA zone X · 0% chance over 30 yrs
- Wildfire 1/10 Low
- Heat 9/10 Extreme 6 d/yr ≥113°F today · 18 d/yr by 30 yrs out
- Wind 1/10 Low
- Air quality 5/10 Major 6 unhealthy d/yr today · 8 by 30 yrs out
Nearby sold comps map
Loading sold comps map…
Walkable amenities ~0.75 mi
Loading nearby amenities…
Taxation est. · year 1
- Rental income
- $46,910
- − Mortgage interest
- −$24,591
- − Property taxes
- −$3,278
- − Insurance
- −$2,195
- − Repairs & maintenance
- −$3,753
- − Management
- −$3,753
- − Depreciation
- −$12,771
- Taxable loss
- −$3,431
- Est. tax savings @ 24.0%
- +$823
- After-tax cash flow
- $4,783/yr
For passive investors: Depreciation is non-cash, so a rental often shows a tax loss while cash-flowing — sheltering income. Rental losses are passive: they offset passive income freely, and up to $25,000/yr can offset ordinary (W-2) income if you actively participate and your MAGI is under $100k (phasing out to $0 by $150k); unused losses carry forward. On sale, claimed depreciation is recaptured at up to 25%, and gains may owe capital-gains tax (a 1031 exchange can defer both). Figures are a year-1 estimate at your 24.0% rate — not tax advice; consult a CPA.
Schools (NCES district)
- District
- Palm Springs Unified
- NCES district ID
- 0629550
- Math proficiency
- 21% ▼ -7.00%
- Reading proficiency
- 42% ▬ 0.00%
- Median HH income
- $43,638
- Composite
- 26.76/100
- National rank
- #7131
- State rank
- #328 of 517 in CA
Livability — Cathedral City
- Score
- 66/100
- State rank
- #344
- US rank
- #11749
Category grades
Schools grade is shown separately in the Schools card above.
Census & demographics
- Census place
- Cathedral City, CA
- County
- Riverside County · 2,287,001 people
- City population
- 52,267
- Metro
- Riverside-San Bernardino-Ontario, CA
- Population (ZIP)
- 52,267
- Household income
- $73,572
- Rent vs Own
- Severe rent burden
- 1682.0
Population outlook (Riverside County) Hauer SSP2
- Today (2025)
- 2,664,475 people
- By 2030
- 2,802,692 · +5.2%
- By 2040
- 3,050,904 · +14.5%
- By 2050
- 3,256,783 · +22.2%
- By 2075
- 3,655,058 · +37.2%
- By 2100
- 3,766,594 · +41.4%
Race, ethnicity, and origin ACS 2023
- Neighborhood character
- Diverse neighborhood (Simpson 0.56)
- Race & ethnicity
- Hispanic / Latino 59% White 30% Two or more races 27% Asian 6% Native American 2% Black 2%
- Hispanic origin (detail)
- Mexican 51%
- Common ancestry
- Lithuanian 2% Romanian 1% Italian 1%
- Foreign-born
- 28% · Canada, Vietnam
- Languages at home
- 48% English-only · Spanish 46% Tagalog/Filipino 3% Other Asian/Pacific 1%
Political lean MEDSL · Riverside
- 2024 margin
- Toss-up / Even · D 48.0% · R 49.3% · Other 2.6%
- 2008→2024 swing
- -3.6pp toward R · 2008: 2.3pp · 2024: -1.3pp
- All cycles
- 2024: R+1.3 2020: D+8.0 2016: D+4.3 2012: R+0.4 2008: D+2.3
Not yet ingested
- Civics
- —
Market trends
- HPI YoY
- ▼ -136.57%
- Current HPI
- 356.9845
- Rent YoY
- ▲ 3.22%
- Metro
- Riverside-San Bernardino-Ontario, CA
- State GDP YoY
- ▲ 3.21%
- F500 in state
- 116
Industry mix (Fortune 500 HQ in CA)
| Industry | F500 HQs | Revenue |
|---|---|---|
| Technology | 27 | $1,492B |
|
||
| Financial Services | 3 | $174B |
|
||
| Retail | 3 | $44B |
|
||
| Insurance | 3 | $26B |
|
||
| Media / Entertainment | 2 | $115B |
|
||
| Pharmaceuticals / Biotech | 2 | $62B |
|
||
Price history
+2095.0% since first listed4 events — show timeline
- 2026-04-22 Price Changed $439,000 GPSMLS
- 2026-02-28 Listed $449,000 GPSMLS
- 1995-12-29 Sold (Public Records) $71,000 Public Records
- 1989-03-03 Sold (Public Records) $20,000 Public Records
Property tax history
+1.5%/yrLatest (2025): $3,278 · +0.4% YoY. Source: county tax records.
Cash-flow waterfall
monthlySold comps — $/sqft
last 12 mo · ≤1 miLoading sold comps…