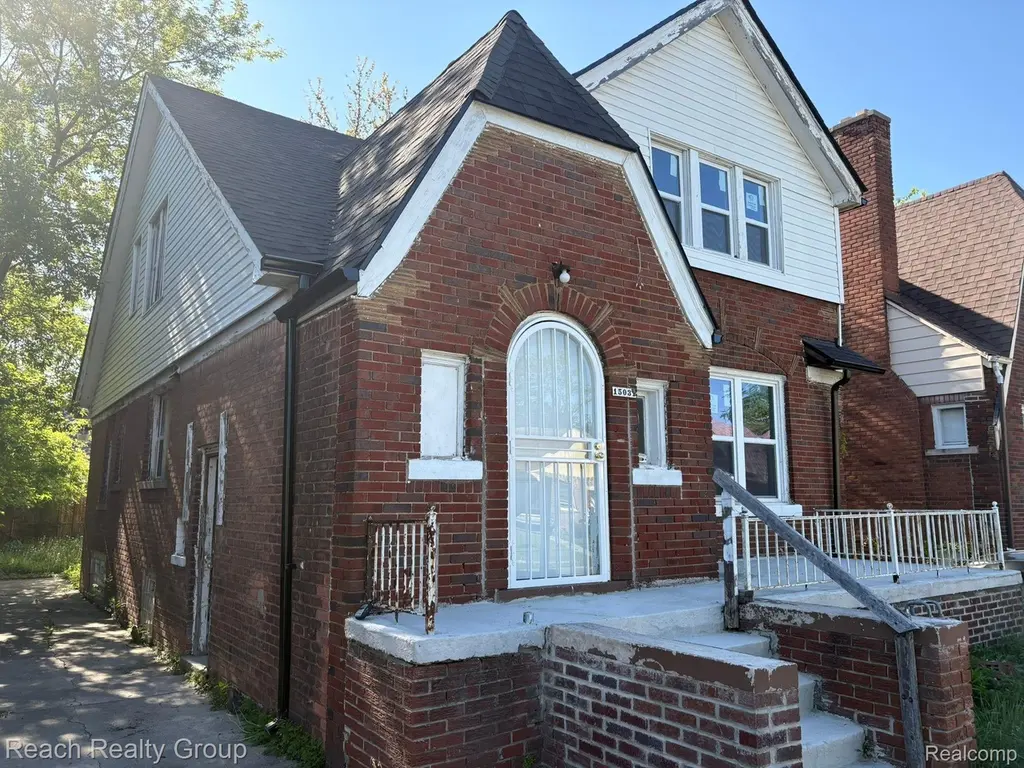
15031 Freeland St · Detroit, MI
Flood risk 1/10 · Minimal
- FEMA flood zone
- X (unshaded)
- Chance of flooding over 30 yrs
- 0.0%
- Est. flood insurance / yr
- $473 – $860
Fire risk 1/10 · Minimal
- Est. fire insurance / yr
- $784 – $1,456
Heat risk 3/10 · Minor
- Hot days now (above 98°F)
- 7 days/yr
- Hot days in 30 yrs
- 15 days/yr
Wind risk 2/10 · Minimal
- Chance of severe wind over 30 yrs
- —
Air-quality risk 3/10 · Minor
- Unhealthy air days now
- 2 days/yr
- Unhealthy air days in 30 yrs
- 5 days/yr
Risk factors via First Street. Map © Google.
Why this score? — see what drove the B- grade
The composite is a weighted blend of 9 inputs, each scored 0–100. Each bar is that input's sub-score; the figure is the points it added to the 100-point composite (weight × sub-score).
- Cash flow +30.0/30.0
- DSCR +10.0/10.0
- 1% rule +9.7/10.0
- ARV discount +7.5/15.0
- Rent growth +3.9/5.0
- Livability +3.7/5.0
- Condition / age +2.5/5.0
- Schools +1.3/10.0
- Appreciation +0.0/10.0
$99,000
🖨 Deal sheet 📄 Offer letter ✓ Due diligence
Listing remarks MLS
What an amazing block!!! This brick beauty will not last long!! The measurements should be verified. 495 transaction fee shall be paid by the buyer to listing broker at closing. New Roof , paint, finished flooring throughout , Cabinets in Kitchen. Info reliable but not 100%. Only Cash or Conventional terms. No land contracts.
Key facts
- Cabinets in kitchen
- New roof
- Finished flooring
Tags
Neighborhood map
What this means for you Summary
Snapshot
- This is a 4-bed/1.0-bath single-family listed at $99k.
Deal economics
- At list price, monthly cash flow is $531 ($6k/yr) — positive.
- The deal already cash-flows at list — no discount required.
- Meets the 1% rule at list price ($1k rent vs $99k).
- Recommended offer: $90k (9.0% below list) — sets the bar for market timing.
- Cap rate 12.7% vs local median 10.2% in Detroit — meaningfully above typical; check what's discounted (condition, days-on-market, listing class) to confirm the premium yield is real.
Location & tenants
- Location reads 73/100 on livability (#218 in MI) — a middle-class / working-renter tenant base. Strengths: amenities A+, commute A+, cost of living A+; Watch: schools F, crime F, employment F.
- Detroit Public Schools Community District (urban): math 10% / reading 24% proficiency, ranked #499 of 540 in MI (top 92%) — low school quality limits family demand, transient renter base, plan for 1-2y turnover; 90% free/reduced lunch — lower-income household profile, screen leases tightly.
- Market conditions: Rents rising fast (+5.6%/yr); 385 active listings in the ZIP; 40 comparable units currently listed for rent nearby; rentals at typical pace (median 17d on market — plan ~3-4 weeks tenant-placement turnaround); lower-income renter base — watch delinquency; 2,639 units permitted in Wayne County in 2024 (1,216 in 5+ unit buildings).
- At $1,452/mo this rent would consume 48% of the median local household income ($37k/yr) (locally 2371% of renters already pay >50% of income on rent) — very limited rent-growth headroom before tenants either downsize or default.
Forward outlook
- Local home prices are declining (-3.0%/yr); year-one equity from $684 of loan paydown is wiped out by about $3k of value loss. Plan a longer hold.
- Wayne County population projected at -17% by 2050 — secular population decline; favor cash flow + early exit over multi-decade hold.
- At projected returns (-3.0% appreciation + 5.6% rent growth), your $28k cash investment doubles in ~5 years — after that, you're playing with house money.
Negotiation context
- It's been on market 113 days — a 9% lower offer ($90k) is reasonable based on typical stale-listing flexibility.
- 12 sale attempts since 17y ago; this cycle's ask has dropped $6k (6%) from the opening price — seller is motivated, your offer sets the floor, not the list.
- Current owner paid $48k; list at $99k implies a 106% gain — meaningful room to come down on a strong offer.
Risks & watch-outs
- Watch-outs: built in 1931 — expect roof / HVAC / electrical / plumbing capex.
Questions for the listing agent
- It's been on market 113 days. Have you received any prior offers? Is the seller open to a 9% concession, seller financing, or rate buy-down credit?
- Built in 1931 — when were the roof, HVAC, electrical panel, plumbing, and water heater last replaced?
- Why hasn't it sold? Are there any deal-killer items the seller is aware of (foundation, flood, title, zoning, code violations)?
- Is there a deadline driving the sale (1031 exchange, divorce, estate, relocation)? That informs how much negotiation room exists.
- Schools are F-rated, which usually means shorter tenancies and higher turnover. Who's the typical renter profile here, and what's been the actual vacancy rate?
- Crime grade is F in this area — have there been break-ins, vandalism, or insurance claims at this property in the last 3 years? What carrier currently insures it and at what premium?
- What's the average days-on-market for RENTAL listings here right now (not sales)? A rising rental-DOM trend means longer vacancies and softer asking-rent achievability than the comps imply.
- What's the recent tenant-quality profile in this submarket — average credit score on applications, eviction rate, late-payment / NSF rate, and stable-employment percentage? A property-management company in the area should have these aggregated.
- How much new for-sale + rental construction is in the pipeline within 1–3 miles? Heavy new supply typically softens prices + rents 12–24 months out; constrained supply supports both.
Investment metrics
- 1% rule
- 1.47% ✓
- Cap rate
- 12.73%
- Cash-on-cash
- 22.99%
- DSCR
- 2.02
- GRM
- 5.7
CMA / ARV
- ARV (median comp)
- $62,257
- List price
- $99,000
- Delta
- 59.02%
- Verdict
- OVERPRICED
- Comps
- 20 within 1.0 mi
Show comp detail 12 sales within ~0.75 mi
| Address | Dist | Beds/Ba | Sqft | Sold | Price | $/sf | Match |
|---|---|---|---|---|---|---|---|
| 14905 Littlefield St | 0.51mi | 3/1.0 (-1) | 1,368 (-2%) | 1mo | $52,000 | $38 | 66 |
| 14644 Hubbell St | 0.28mi | 3/1.0 (-1) | 1,248 (-11%) | 2mo | $45,000 | $36 | 62 |
| 15103 Cheyenne St | 0.55mi | 4/2.0 | 1,317 (-6%) | 4mo | $121,500 | $92 | 57 |
| 15748 Freeland St | 0.43mi | 3/1.0 (-1) | 1,243 (-11%) | 4mo | $78,000 | $63 | 53 |
| 15053 Littlefield St | 0.49mi | 3/2.0 (-1) | 1,286 (-8%) | 2mo | $75,000 | $58 | 52 |
| 15328 Prest St E | 0.61mi | 3/1.5 (-1) | 1,298 (-7%) | 3mo | $66,999 | $52 | 50 |
| 14232 Lauder St | 0.65mi | 3/1.0 (-1) | 1,272 (-9%) | 2mo | $60,000 | $47 | 47 |
| 14974 Cheyenne St | 0.58mi | 3/2.5 (-1) | 1,300 (-7%) | 4mo | $155,000 | $119 | 47 |
| 14885 Ward Ave | 0.62mi | 4/1.0 | 1,222 (-13%) | 4mo | $45,000 | $37 | 47 |
| 15501 Whitcomb St | 0.65mi | 4/1.5 | 1,609 (+15%) | 1mo | $90,000 | $56 | 42 |
| 16183 Freeland Street St | 0.70mi | 3/1.0 (-1) | 1,224 (-13%) | 3mo | $150,000 | $123 | 39 |
| 15894 Snowden St | 0.75mi | 3/1.5 (-1) | 1,562 (+12%) | 4mo | $150,000 | $96 | 36 |
Match score weights: distance 35% · size 25% · config 20% · recency 20%. Top-matched comps best support the ARV.
Projected returns pro-forma
-3.0% appreciation · 5.59% rent growth · sell at horizon
- IRR
- 18.7%
- Equity multiple
- 1.78×
- Total profit
- $21,647
- Equity at exit
- $14,761
- IRR
- 28.7%
- Equity multiple
- 3.85×
- Total profit
- $79,123
- Equity at exit
- $8,560
Cash invested: $27,720 (down + closing). Projections, not guarantees.
Landlord ↔ Tenant lean methodology
- Overall (STATE)
- 62 Landlord-Friendly
- State Michigan
- 62 Landlord-Friendly · EVEN
- County
- — inherits STATE
- City
- — inherits STATE
ZIP-level market 48227
- Rents YoY
- 5.6%
- Active inventory
- 385
- Price-to-rent
- 5.7×
Monthly cashflow live
- Estimated rent
- $1,452 high interval (Pro) →
- Mortgage (P&I)
- −$519
- Tax from tax record
- −$55 /mo · $665/yr
- Insurance
- −$41
- HOA
- −$0
- Vacancy / Maint / Mgmt
- −$305
- Net cashflow
- $531
Break-even live
UW: 25.0% down · 7.5% · 30yr · 1.5% tax · 5.0% vac · 8.0% maint · 8.0% mgmt
Financing live
Cash to close
- Down payment
- $24,750
- Closing costs
- $2,970
- Reserves months
- —
- Total cash needed
- —
Loan-product check · same deal, 3 products live
Conventional
25% down · 7.5% · 30yr
- Down + closing
- —
- Monthly P&I
- —
- Monthly cashflow
- —
- DSCR
- —
- Eligible?
- —
Personal DTI + credit; lowest rate.
DSCR
20% down · 8.5% · 30yr
- Down + closing
- —
- Monthly P&I
- —
- Monthly cashflow
- —
- DSCR
- —
- Eligible?
- —
No personal income docs; deal must DSCR.
Hard money
10% down · 12.0% · 12mo
- Down + closing
- —
- Monthly P&I
- —
- Monthly cashflow
- —
- DSCR
- —
- Eligible?
- —
Short-term bridge; refi at stabilization.
Rent comps 40 comps
| Address | Beds | Baths | Sqft | Rent | $/sqft | DOM | Units | Dist |
|---|---|---|---|---|---|---|---|---|
| 14600 Strathmoor St Detroit, MI | 4.0 | 1.0 | 1300 | $1,450 | $1.12 | 43d | 1 | 0.28mi |
| 14590 Ardmore St Detroit, MI | 3.0 | 1.0 | 1200 | $1,195 | $1.00 | 2d | 1 | 0.29mi |
| 14903 Tracey St Detroit, MI | 3.0 | 1.0 | 1004 | $1,100 | $1.10 | 16d | 1 | 0.30mi |
| 15387 Lesure St Detroit, MI | 3.0 | 1.0 | 1064 | $1,350 | $1.27 | 12d | 1 | 0.33mi |
| 15341 Lauder St Detroit, MI | 4.0 | 1.5 | 1080 | $1,475 | $1.37 | 16d | 1 | 0.34mi |
| 14891 Hartwell St Detroit, MI | 3.0 | 1.0 | 1000 | $1,150 | $1.15 | 43d | 1 | 0.41mi |
| 15328 Coyle St Detroit, MI | 3.0 | 1.0 | 1000 | $1,450 | $1.45 | 17d | 1 | 0.42mi |
| 15330 Coyle St Unit 1 Detroit, MI | 3.0 | 1.0 | 1000 | $1,375 | $1.38 | 24d | 1 | 0.42mi |
| 15330 Coyle St Unit 1 Detroit, MI | 3.0 | 1.0 | 1000 | $1,425 | $1.43 | 12d | 1 | 0.42mi |
| 15330 Coyle St Unit 2 Detroit, MI | 3.0 | 1.0 | 1000 | $1,450 | $1.45 | 24d | 1 | 0.42mi |
| 15762 Mark Twain St Detroit, MI | 3.0 | 2.0 | 1430 | $1,250 | $0.87 | 16d | 1 | 0.47mi |
| 14814 Sussex St Unit 2 Detroit, MI | 3.0 | 1.0 | 1100 | $1,000 | $0.91 | 43d | 1 | 0.48mi |
| 14375 Terry St Detroit, MI | 3.0 | 2.0 | 1300 | $1,425 | $1.10 | 43d | 1 | 0.54mi |
| 14284 Cruse St Detroit, MI | 3.0 | 1.0 | 1121 | $1,150 | $1.03 | 16d | 1 | 0.55mi |
| 15810 Robson St Detroit, MI | 3.0 | 1.0 | 1142 | $1,500 | $1.31 | 24d | 1 | 0.61mi |
| 14893 Prest St Detroit, MI | 3.0 | 1.0 | 1100 | $1,000 | $0.91 | 14d | 1 | 0.61mi |
| 16151 Robson St Detroit, MI | 3.0 | 1.0 | 1300 | $1,525 | $1.17 | 14d | 1 | 0.77mi |
| 14104 Coyle St Detroit, MI | 3.0 | 1.0 | 1327 | $1,350 | $1.02 | 4d | 1 | 0.81mi |
| 16505 Stansbury St Detroit, MI | 3.0 | 1.0 | 1100 | $1,250 | $1.14 | 10d | 1 | 0.83mi |
| 16505 Stansbury St Detroit, MI | 3.0 | 1.0 | 1700 | $1,345 | $0.79 | 43d | 1 | 0.83mi |
| 15375 Prevost St Detroit, MI | 4.0 | 1.0 | 907 | $1,300 | $1.43 | 16d | 1 | 0.91mi |
| 16014 Hackett St Detroit, MI | 4.0 | 2.0 | 1142 | $1,500 | $1.31 | 43d | 1 | 0.95mi |
| 16230 Cheyenne St Detroit, MI | 3.0 | 1.0 | 1653 | $1,450 | $0.88 | 43d | 1 | 0.96mi |
| 13331 Strathmoor St Detroit, MI | 3.0 | 1.0 | 1084 | $1,100 | $1.01 | 16d | 1 | 0.98mi |
| 15752 Rutherford St Detroit, MI | 3.0 | 2.0 | 1174 | $1,386 | $1.18 | 4d | 1 | 1.01mi |
| 15332 Saint Marys St Detroit, MI | 3.0 | 1.0 | 1200 | $1,200 | $1.00 | 16d | 1 | 1.04mi |
| 16204 Steel St Detroit, MI | 3.0 | 1.0 | 969 | $1,150 | $1.19 | 43d | 1 | 1.06mi |
| 14881 Mendota St Detroit, MI | 3.0 | 1.0 | 1026 | $1,100 | $1.07 | 24d | 1 | 1.07mi |
| 14504 Saint Marys St Detroit, MI | 4.0 | 1.0 | 1362 | $1,473 | $1.08 | 43d | 1 | 1.08mi |
| 13279 Coyle St Detroit, MI | 3.0 | 1.0 | 1444 | $1,373 | $0.95 | 43d | 1 | 1.11mi |
| 15866 Mansfield St Detroit, MI | 3.0 | 1.0 | 1324 | $1,425 | $1.08 | 24d | 1 | 1.12mi |
| 14800 Woodmont Ave Detroit, MI | 3.0 | 2.0 | 1612 | $1,525 | $0.95 | 14d | 1 | 1.17mi |
| 12778 Strathmoor St Detroit, MI | 3.0 | 1.0 | 1597 | $1,150 | $0.72 | 4d | 1 | 1.20mi |
| 15708 Birwood St Detroit, MI | 3.0 | 1.0 | 1255 | $1,100 | $0.88 | 4d | 1 | 1.21mi |
| 12754 Marlowe St Detroit, MI | 3.0 | 2.0 | 1008 | $1,400 | $1.39 | 16d | 1 | 1.23mi |
| 16837 Winthrop St Detroit, MI | 5.0 | 2.0 | 1500 | $2,000 | $1.33 | 20d | 1 | 1.27mi |
| 15736 Biltmore St Detroit, MI | 3.0 | 1.5 | 1000 | $1,200 | $1.20 | 16d | 1 | 1.30mi |
| 13965 Mendota St Detroit, MI | 3.0 | 1.0 | 1222 | $1,294 | $1.06 | 17d | 1 | 1.31mi |
| 15065 Gilchrist St Detroit, MI | 3.0 | 1.0 | 1100 | $1,250 | $1.14 | 43d | 1 | 1.32mi |
| 16210 Ferguson St Detroit, MI | 4.0 | 2.0 | 1493 | $1,750 | $1.17 | 3d | 1 | 1.39mi |
Listing history 50 events
-
2026-06-18days on market $99,000 Active 113 DOM
-
2026-06-17days on market $99,000 Active 112 DOM
-
2026-06-15days on market $99,000 Active 110 DOM
-
2026-06-13days on market $99,000 Active 108 DOM
-
2026-06-13days on market $99,000 Active 107 DOM
-
2026-06-09days on market $99,000 Active 104 DOM
-
2026-06-08days on market $99,000 Active 103 DOM
-
2026-06-08remarks 372-char remark
-
2026-06-07days on market $99,000 Active 102 DOM
-
2026-06-04days on market $99,000 Active 99 DOM
-
2026-06-03days on market $99,000 Active 98 DOM
-
2026-06-01days on market $99,000 Active 96 DOM
-
2026-05-31days on market $99,000 Active 95 DOM
-
2026-03-05price $99,000 327-char remark
Show marketing remark (327 chars)
What an amazing block!!! This brick beauty will not last long!! The measurements should be verified. 495 transaction fee shall be paid by the buyer to listing broker at closing. New Roof , paint, finished flooring throughout , Cabinets in Kitchen. Info reliable but not 100%. Only Cash or Conventional terms. No land contracts.
-
2026-03-04price $99,000 327-char remark
Show marketing remark (327 chars)
What an amazing block!!! This brick beauty will not last long!! The measurements should be verified. 495 transaction fee shall be paid by the buyer to listing broker at closing. New Roof , paint, finished flooring throughout , Cabinets in Kitchen. Info reliable but not 100%. Only Cash or Conventional terms. No land contracts.
-
2026-02-23$105,000 Active 327-char remark
Show marketing remark (327 chars)
What an amazing block!!! This brick beauty will not last long!! The measurements should be verified. 495 transaction fee shall be paid by the buyer to listing broker at closing. New Roof , paint, finished flooring throughout , Cabinets in Kitchen. Info reliable but not 100%. Only Cash or Conventional terms. No land contracts.
-
2026-02-13historical
-
2026-02-13historical
-
2026-02-03price $105,000
-
2026-02-02price $105,000
-
2025-12-16price $116,000
-
2025-12-16price $116,000
-
2025-12-12$120,000 Active
-
2025-12-12$120,000 Active
-
2025-11-14historical
-
2025-11-14historical
-
2025-09-20price $110,000
-
2025-09-19price $110,000
-
2025-08-19price $115,000
-
2025-08-18price $115,000
-
2025-08-13$120,000 Active
-
2025-08-13$120,000 Active
-
2025-08-13historical
-
2025-08-13historical
-
2025-08-01price $115,000
-
2025-07-31price $115,000
-
2025-05-13$120,000 Active
-
2025-05-13$120,000 Active
-
2024-12-19soldstatus $48,000
-
2024-11-14soldstatus $48,000 Sold
-
2024-11-14soldstatus $48,000 Closed
-
2024-10-09price $52,000
-
2024-10-08price $52,000
-
2024-09-20$55,000 Active
-
2024-09-19$55,000 Active
-
2009-10-09soldstatus $5,000
-
2009-08-21$5,500
-
2009-08-20historical
-
2009-07-10$5,500
ⓘ Source: listings_history table (triggers on properties + properties_extension) + one-shot
backfill from property_details.listing_events for pre-trigger history.
Tax reassessment forecast MI · Partial reset (capped growth)
- Current annual tax
- $665 · $55/mo
- Projected year-2 tax
- $1,095 · $91/mo
- Expected delta
- +$430/yr (+$36/mo · 64.6%)
ⓘ Screening estimate from a state-policy table — verify with the county assessor before closing.
Climate risk First Street
- Flood 1/10 Low FEMA zone X (unshaded) · 0% chance over 30 yrs
- Wildfire 1/10 Low
- Heat 3/10 Moderate 7 d/yr ≥98°F today · 15 d/yr by 30 yrs out
- Wind 2/10 Low
- Air quality 3/10 Moderate 2 unhealthy d/yr today · 5 by 30 yrs out
Nearby sold comps map
Loading sold comps map…
Walkable amenities ~0.75 mi
Loading nearby amenities…
Taxation est. · year 1
- Rental income
- $17,422
- − Mortgage interest
- −$5,546
- − Property taxes
- −$665
- − Insurance
- −$495
- − Repairs & maintenance
- −$1,394
- − Management
- −$1,394
- − Depreciation
- −$2,880
- Taxable income
- $5,049
- Est. tax owed @ 24.0%
- −$1,212
- After-tax cash flow
- $5,162/yr
For passive investors: Depreciation is non-cash, so a rental often shows a tax loss while cash-flowing — sheltering income. Rental losses are passive: they offset passive income freely, and up to $25,000/yr can offset ordinary (W-2) income if you actively participate and your MAGI is under $100k (phasing out to $0 by $150k); unused losses carry forward. On sale, claimed depreciation is recaptured at up to 25%, and gains may owe capital-gains tax (a 1031 exchange can defer both). Figures are a year-1 estimate at your 24.0% rate — not tax advice; consult a CPA.
Schools (NCES district)
- District
- Detroit Public Schools Community District
- NCES district ID
- 2601103
- Math proficiency
- 10% ▼ -2.00%
- Reading proficiency
- 24% ▲ 6.00%
- Median HH income
- $25,815
- Composite
- 13.06/100
- National rank
- #9564
- State rank
- #499 of 540 in MI
Livability — Detroit
- Score
- 73/100
- State rank
- #218
- US rank
- #5427
Category grades
Schools grade is shown separately in the Schools card above.
Census & demographics
- Census place
- Detroit, MI
- County
- Wayne County · 1,562,939 people
- City population
- 572,865
- Metro
- Detroit-Warren-Dearborn, MI
- Population (ZIP)
- 40,302
- Household income
- $36,527
- Rent vs Own
- Severe rent burden
- 2371.0
Population outlook (Wayne County) Hauer SSP2
- Today (2025)
- 1,675,273 people
- By 2030
- 1,620,300 · -3.3%
- By 2040
- 1,502,341 · -10.3%
- By 2050
- 1,384,039 · -17.4%
- By 2075
- 1,124,592 · -32.9%
- By 2100
- 881,193 · -47.4%
Race, ethnicity, and origin ACS 2023
- Neighborhood character
- Predominantly Black (95%)
- Race & ethnicity
- Black 95% Two or more races 3% White 1%
- Foreign-born
- 1%
- Languages at home
- 98% English-only · Spanish 1% French/Haitian/Cajun 1%
Political lean MEDSL · Wayne
- 2024 margin
- Strong D (+29.0) · D 62.7% · R 33.7% · Other 3.6%
- 2008→2024 swing
- -20.5pp toward R · 2008: 49.5pp · 2024: 29.0pp
- All cycles
- 2024: D+29.0 2020: D+38.1 2016: D+37.3 2012: D+46.9 2008: D+49.5
Not yet ingested
- Civics
- —
Market trends
- HPI YoY
- ▼ -125.00%
- Current HPI
- 186.4158
- Rent YoY
- ▲ 5.59%
- Metro
- Detroit-Warren-Dearborn, MI
- State GDP YoY
- ▲ 1.37%
- F500 in state
- 28
Industry mix (Fortune 500 HQ in MI)
| Industry | F500 HQs | Revenue |
|---|---|---|
| Automotive Parts | 3 | $48B |
|
||
| Automotive | 2 | $372B |
|
||
| Chemicals | 1 | $45B |
|
||
| Automotive Retail | 1 | $29B |
|
||
| Healthcare / Medical Devices | 1 | $23B |
|
||
| Automotive Technology | 1 | $20B |
|
||
Price history
+1700.0% since first listed37 events — show timeline
- 2026-03-05 Price Changed $99,000 MiRealSource-MiMLS
- 2026-03-04 Price Changed $99,000 REALCOMP
- 2026-02-23 Listed $105,000 REALCOMP
- 2026-02-23 Listed $105,000 MiRealSource-MiMLS
- 2026-02-13 Listing Removed — REALCOMP
- 2026-02-13 Listing Removed — MiRealSource-MiMLS
- 2026-02-03 Price Changed $105,000 MiRealSource-MiMLS
- 2026-02-02 Price Changed $105,000 REALCOMP
- 2025-12-16 Price Changed $116,000 MiRealSource-MiMLS
- 2025-12-16 Price Changed $116,000 REALCOMP
- 2025-12-12 Listed $120,000 MiRealSource-MiMLS
- 2025-12-12 Listed $120,000 REALCOMP
- 2025-11-14 Listing Removed — MiRealSource-MiMLS
- 2025-11-14 Listing Removed — REALCOMP
- 2025-09-20 Price Changed $110,000 MiRealSource-MiMLS
- 2025-09-19 Price Changed $110,000 REALCOMP
- 2025-08-19 Price Changed $115,000 MiRealSource-MiMLS
- 2025-08-18 Price Changed $115,000 REALCOMP
- 2025-08-13 Listing Removed — MiRealSource-MiMLS
- 2025-08-13 Listing Removed — REALCOMP
- 2025-08-13 Listed $120,000 MiRealSource-MiMLS
- 2025-08-13 Listed $120,000 REALCOMP
- 2025-08-01 Price Changed $115,000 MiRealSource-MiMLS
- 2025-07-31 Price Changed $115,000 REALCOMP
- 2025-05-13 Listed $120,000 REALCOMP
- 2025-05-13 Listed $120,000 MiRealSource-MiMLS
- 2024-12-19 Sold (Public Records) $48,000 Public Records
- 2024-11-14 Sold (MLS) $48,000 MiRealSource-MiMLS
- 2024-11-14 Sold (MLS) $48,000 REALCOMP
- 2024-10-09 Price Changed $52,000 MiRealSource-MiMLS
- 2024-10-08 Price Changed $52,000 REALCOMP
- 2024-09-20 Listed $55,000 REALCOMP
- 2024-09-19 Listed $55,000 MiRealSource-MiMLS
- 2009-10-09 Sold (MLS) $5,000 REALCOMP
- 2009-08-21 Listed $5,500 REALCOMP
- 2009-08-20 Listing Removed — REALCOMP
- 2009-07-10 Listed $5,500 REALCOMP
Property tax history
-5.0%/yrLatest (2025): $665 · +15.6% YoY. Source: county tax records.
Cash-flow waterfall
monthlySold comps — $/sqft
last 12 mo · ≤1 miLoading sold comps…