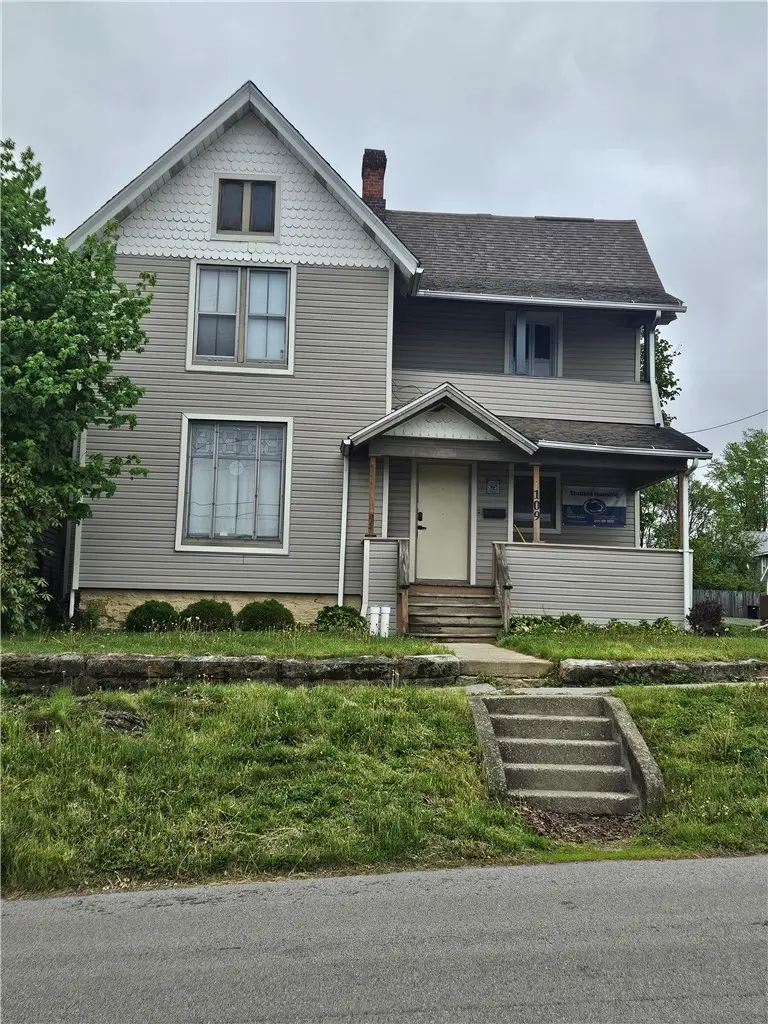
109 E Dubois Ave · DuBois, PA
Flood risk 1/10 · Minimal
- FEMA flood zone
- X (unshaded)
- Chance of flooding over 30 yrs
- 0.0%
- Est. flood insurance / yr
- $473 – $860
Fire risk 2/10 · Minimal
- Est. fire insurance / yr
- $511 – $949
Heat risk 3/10 · Minor
- Hot days now (above 93°F)
- 7 days/yr
- Hot days in 30 yrs
- 18 days/yr
Wind risk 2/10 · Minimal
- Chance of severe wind over 30 yrs
- —
Air-quality risk 2/10 · Minimal
- Unhealthy air days now
- 1 days/yr
- Unhealthy air days in 30 yrs
- 2 days/yr
Risk factors via First Street. Map © Google.
Why this score? — see what drove the D grade
The composite is a weighted blend of 9 inputs, each scored 0–100. Each bar is that input's sub-score; the figure is the points it added to the 100-point composite (weight × sub-score).
- Appreciation +10.0/10.0
- Cash flow +9.1/30.0
- ARV discount +7.5/15.0
- Livability +4.0/5.0
- Schools +3.9/10.0
- DSCR +2.5/10.0
- Rent growth +2.5/5.0
- Condition / age +2.5/5.0
- 1% rule +2.0/10.0
$168,000
🖨 Deal sheet (PDF) 📄 Offer letter ✓ Due diligence
Listing remarks
Large 7-bedroom, 3-bath home offering approximately 2,800+ sq ft of living space. Property features a remodeled kitchen and updated flooring in the main living areas. Spacious layout with generously sized bedrooms provides flexibility for a variety of uses. Situated on a sizable lot with additional basement space for storage. Built in 1900 with solid structure and functional layout. Prior sale in 2022. Property presents a strong opportunity for investors or buyers looking for a value-add property. Please allow notice for showings. Contact listing agent to schedule all appointments.
Key facts
- Remodeled kitchen
- Updated flooring
- Sizable lot
Tags
Property features AI
Exterior
- Parking: Off-street parking for 3 vehicles
- Utilities: Public water; Public sewer
- Home design: Vinyl siding
- Construction: Vinyl siding construction
- Exterior features: Off-street parking (3 total spaces); Resale property
Interior
- Kitchen: Kitchen included; Refrigerator; Stove
- Bedrooms: Upper-level bedrooms including Bedroom 2, Bedroom 3, Bedroom 4, Bedroom 5; Main-level bedroom (Bedroom 2); Bonus rooms on main and upper levels
- Bathrooms: 2 full bathrooms; 1 half bathroom
- Heating & cooling: Gas heating
- Interior features: Interior entry basement; Total of 11 rooms
- Laundry & utility: Washer; Dryer; Some gas appliances
Neighborhood map
What this means for you Summary
Snapshot
- This is a 7-bed/2.5-bath other listed at $168k.
Deal economics
- At list price, monthly cash flow is $-128 ($-2k/yr) — negative.
- To cash-flow at today's rent, offer at most $145k (13.4% below list).
- To meet the 1% rule (rent ≥ 1% of price), the offer needs to be $118k (29.7% below list).
- Recommended offer: $118k (29.7% below list) — sets the bar for 1% rule.
Location & tenants
- Location reads 81/100 on livability (#165 in PA, #1,370 nationally) — a professional / high-income tenant draw. Strengths: amenities A+, cost of living A+, housing A+; Watch: employment D+, commute F.
- Dubois Area SD (town): math 38% / reading 55% proficiency, ranked #262 of 539 in PA (top 49%) — families likely to look elsewhere, expect single-tenant / working-renter base with shorter leases.
- Zoned schools: Juniata El Sch (math 47% / reading 57%, grade C-, #586 of 1,518 statewide, top 42%, 273 students, 100% FRL); Dubois Area Ms (math 26% / reading 51%, grade F, #275 of 512 statewide, top 55%, 1,062 students, 100% FRL); Dubois Area Shs (math 72% / reading 24%, grade D, #153 of 437 statewide, top 37%, 924 students, 100% FRL) — zoned schools average 100% FRL vs 45% district-wide (55 pts higher); higher-poverty schools than district average — tighter screening recommended.
- Market conditions: 42 active listings in the ZIP; 99 units permitted in Clearfield County in 2024 (10 in 5+ unit buildings).
Forward outlook
- In year one you build about $18k of equity ($1k loan paydown + $17k appreciation (10.0% local appreciation)).
- Clearfield County population projected at -12% by 2050 — secular population decline; favor cash flow + early exit over multi-decade hold.
- By year 3, paydown + projected appreciation supports a ~$45k cash-out refi (75% LTV) — recoverable capital for the next deal without selling this one.
Negotiation context
- It's been on market 54 days — a 3% lower offer ($163k) is reasonable based on typical stale-listing flexibility.
Risks & watch-outs
- Watch-outs: built in 1900 — expect roof / HVAC / electrical / plumbing capex.
Questions for the listing agent
- What do current leases actually rent for vs. the listed asking? Can we see a recent rent roll and the last 12 months of T-12 income?
- It's been on market 54 days. Have you received any prior offers? Is the seller open to a 30% concession, seller financing, or rate buy-down credit?
- Built in 1900 — when were the roof, HVAC, electrical panel, plumbing, and water heater last replaced?
- Is there a deadline driving the sale (1031 exchange, divorce, estate, relocation)? That informs how much negotiation room exists.
- Schools are A-rated — typically a magnet for longer-tenancy family renters. What's the average tenant stay here, and is there a school-zone premium baked into asking?
- The area grade is low — what's the realistic commute time and amenity access for the typical tenant pool here? Any planned neighborhood developments (good or bad) we should know about?
- What's the average days-on-market for RENTAL listings here right now (not sales)? A rising rental-DOM trend means longer vacancies and softer asking-rent achievability than the comps imply.
- What's the recent tenant-quality profile in this submarket — average credit score on applications, eviction rate, late-payment / NSF rate, and stable-employment percentage? A property-management company in the area should have these aggregated.
- How much new for-sale + rental construction is in the pipeline within 1–3 miles? Heavy new supply typically softens prices + rents 12–24 months out; constrained supply supports both.
Investment metrics
- 1% rule
- 0.70% ✗
- Cap rate
- 5.38%
- Cash-on-cash
- -3.26%
- DSCR
- 0.85
- GRM
- 11.9
CMA / ARV
No comps found within radius.
Projected returns pro-forma
10.0% appreciation · 3.0% rent growth · sell at horizon
- IRR
- 21.9%
- Equity multiple
- 2.77×
- Total profit
- $83,312
- Equity at exit
- $151,348
- IRR
- 19.7%
- Equity multiple
- 6.35×
- Total profit
- $251,654
- Equity at exit
- $326,387
Cash invested: $47,040 (down + closing). Projections, not guarantees.
Landlord ↔ Tenant lean methodology
- Overall (STATE)
- 62 Landlord-Friendly
- State Pennsylvania
- 62 Landlord-Friendly · EVEN
- County
- — inherits STATE
- City
- — inherits STATE
ZIP-level market 15801
- Home prices YoY
- 6.3%
- Active inventory
- 42
- Price-to-rent
- 11.9×
Monthly cashflow live
- Estimated rent
- $1,181 medium interval (Pro) →
- Mortgage (P&I)
- −$881
- Tax from tax record
- −$110 /mo · $1,316/yr
- Insurance
- −$70
- HOA
- −$0
- Vacancy / Maint / Mgmt
- −$248
- Net cashflow
- $-128
Break-even live
Sensitivity live
| Price | -10% $-33 | -5% $-80 | +0% $-128 | +5% $-175 | +10% $-223 |
|---|---|---|---|---|---|
| Rent | -10% $-221 | -5% $-174 | +0% $-128 | +5% $-81 | +10% $-35 |
| Rate | -1.0pp $-43 | -0.5pp $-85 | base $-128 | +0.5pp $-171 | +1.0pp $-216 |
UW: 25.0% down · 7.5% · 30yr · 1.5% tax · 5.0% vac · 8.0% maint · 8.0% mgmt
Financing live
Cash to close
- Down payment
- $42,000
- Closing costs
- $5,040
- Reserves months
- —
- Total cash needed
- —
Loan-product check · same deal, 3 products live
Conventional
25% down · 7.5% · 30yr
- Down + closing
- —
- Monthly P&I
- —
- Monthly cashflow
- —
- DSCR
- —
- Eligible?
- —
Personal DTI + credit; lowest rate.
DSCR
20% down · 8.5% · 30yr
- Down + closing
- —
- Monthly P&I
- —
- Monthly cashflow
- —
- DSCR
- —
- Eligible?
- —
No personal income docs; deal must DSCR.
Hard money
10% down · 12.0% · 12mo
- Down + closing
- —
- Monthly P&I
- —
- Monthly cashflow
- —
- DSCR
- —
- Eligible?
- —
Short-term bridge; refi at stabilization.
Listing history 19 events
-
2026-06-21days on market $168,000 Active 54 DOM
-
2026-06-21days on market $168,000 Active 53 DOM
-
2026-06-18days on market $168,000 Active 51 DOM
-
2026-06-17days on market $168,000 Active 50 DOM
-
2026-06-16days on market $168,000 Active 49 DOM
-
2026-06-15days on market $168,000 Active 48 DOM
-
2026-06-13days on market $168,000 Active 46 DOM
-
2026-06-12days on market $168,000 Active 45 DOM
-
2026-06-09days on market $168,000 Active 42 DOM
-
2026-06-08days on market $168,000 Active 41 DOM
-
2026-06-08days on market $168,000 Active 40 DOM
-
2026-06-07days on market $168,000 Active 39 DOM
-
2026-06-04days on market $168,000 Active 36 DOM
-
2026-06-02days on market $168,000 Active 35 DOM
-
2026-06-01days on market $168,000 Active 34 DOM
-
2026-05-31days on market $168,000 Active 33 DOM
-
2026-04-28$168,000 Active 588-char remark
-
2022-05-18soldstatus $183,000
-
2015-11-19soldstatus $90,500
ⓘ Source: listings_history table (triggers on properties + properties_extension) + one-shot
backfill from property_details.listing_events for pre-trigger history.
Tax reassessment forecast PA · Partial reset (capped growth)
- Current annual tax
- $1,316 · $110/mo
- Projected year-2 tax
- $1,985 · $165/mo
- Expected delta
- +$669/yr (+$56/mo · 50.8%)
ⓘ Screening estimate from a state-policy table — verify with the county assessor before closing.
Climate risk First Street
- Flood 1/10 Low FEMA zone X (unshaded) · 0% chance over 30 yrs
- Wildfire 2/10 Low
- Heat 3/10 Moderate 7 d/yr ≥93°F today · 18 d/yr by 30 yrs out
- Wind 2/10 Low
- Air quality 2/10 Low 1 unhealthy d/yr today · 2 by 30 yrs out
Nearby sold comps map
Loading sold comps map…
Walkable amenities ~0.75 mi
Loading nearby amenities…
Taxation est. · year 1
- Rental income
- $14,170
- − Mortgage interest
- −$9,411
- − Property taxes
- −$1,316
- − Insurance
- −$840
- − Repairs & maintenance
- −$1,134
- − Management
- −$1,134
- − Depreciation
- −$4,887
- Taxable loss
- −$4,551
- Est. tax savings @ 24.0%
- +$1,092
- After-tax cash flow
- $-442/yr
For passive investors: Depreciation is non-cash, so a rental often shows a tax loss while cash-flowing — sheltering income. Rental losses are passive: they offset passive income freely, and up to $25,000/yr can offset ordinary (W-2) income if you actively participate and your MAGI is under $100k (phasing out to $0 by $150k); unused losses carry forward. On sale, claimed depreciation is recaptured at up to 25%, and gains may owe capital-gains tax (a 1031 exchange can defer both). Figures are a year-1 estimate at your 24.0% rate — not tax advice; consult a CPA.
Schools (NCES district)
- District
- Dubois Area SD
- NCES district ID
- 4207830
- Math proficiency
- 38% ▼ -7.00%
- Reading proficiency
- 55% ▼ -10.00%
- Median HH income
- $42,951
- Composite
- 39.15/100
- National rank
- #4031
- State rank
- #262 of 539 in PA
Livability — DuBois
- Score
- 81/100
- State rank
- #165
- US rank
- #1370
Category grades
Schools grade is shown separately in the Schools card above.
Census & demographics
- Census place
- DuBois, PA
- Population (ZIP)
- 20,251
Population outlook (Clearfield County) Hauer SSP2
- Today (2025)
- 79,658 people
- By 2030
- 78,358 · -1.6%
- By 2040
- 74,670 · -6.3%
- By 2050
- 70,186 · -11.9%
- By 2075
- 60,391 · -24.2%
- By 2100
- 46,886 · -41.1%
Race, ethnicity, and origin ACS 2023
- Neighborhood character
- Predominantly White (95%)
- Race & ethnicity
- White 95% Hispanic / Latino 3% Two or more races 2%
- Common ancestry
- Romanian 8% Slovak 2% Italian 2%
- Foreign-born
- 1%
- Languages at home
- 98% English-only · Spanish 1%
Political lean MEDSL · Clearfield
- 2024 margin
- Solid R (+51.5) · D 23.9% · R 75.4%
- 2008→2024 swing
- -39.4pp toward R · 2008: -12.1pp · 2024: -51.5pp
- All cycles
- 2024: R+51.5 2020: R+49.5 2016: R+49.6 2012: R+28.9 2008: R+12.1
Not yet ingested
- Civics
- —
Market trends
- HPI YoY
- ▲ 16.17%
- Current HPI
- 273.6078
- Rent YoY
- —
- Metro
- —
- State GDP YoY
- ▲ 1.68%
- F500 in state
- 34
Industry mix (Fortune 500 HQ in PA)
| Industry | F500 HQs | Revenue |
|---|---|---|
| Healthcare | 2 | $309B |
|
||
| Insurance | 2 | $27B |
|
||
| Telecommunications / Media | 1 | $124B |
|
||
| Industrial Distribution | 1 | $22B |
|
||
| Financial Services | 1 | $20B |
|
||
| Chemicals / Materials | 1 | $18B |
|
||
Price history
+85.6% since first listed3 events — show timeline
- 2026-04-28 Listed $168,000 West Penn MLS
- 2022-05-18 Sold (Public Records) $183,000 Public Records
- 2015-11-19 Sold (Public Records) $90,500 Public Records
Property tax history
+3.2%/yrLatest (2026): $1,316 · +3.5% YoY. Source: county tax records.
Cash-flow waterfall
monthlySold comps — $/sqft
last 12 mo · ≤1 miLoading sold comps…