28174 Us 64 Hwy · Ozark, AR
Flood risk 1/10 · Minimal
- FEMA flood zone
- X (unshaded)
- Chance of flooding over 30 yrs
- 0.0%
- Est. flood insurance / yr
- $507 – $1,088
Fire risk 5/10 · Moderate
- Est. fire insurance / yr
- $1,499 – $2,785
Heat risk 6/10 · Moderate
- Hot days now (above 111°F)
- 7 days/yr
- Hot days in 30 yrs
- 20 days/yr
Wind risk 2/10 · Minimal
- Chance of severe wind over 30 yrs
- 2.0%
Air-quality risk 1/10 · Minimal
- Unhealthy air days now
- 0 days/yr
- Unhealthy air days in 30 yrs
- 0 days/yr
Risk factors via First Street. Map © Google.
Why this score? — see what drove the C grade
The composite is a weighted blend of 9 inputs, each scored 0–100. Each bar is that input's sub-score; the figure is the points it added to the 100-point composite (weight × sub-score).
- Cash flow +24.9/30.0
- DSCR +8.1/10.0
- ARV discount +7.5/15.0
- 1% rule +6.5/10.0
- Livability +3.0/5.0
- Schools +2.6/10.0
- Rent growth +2.5/5.0
- Condition / age +2.2/5.0
- Appreciation +0.0/10.0
$120,000
🖨 Deal sheet 📄 Offer letter ✓ Due diligence
Listing remarks MLS
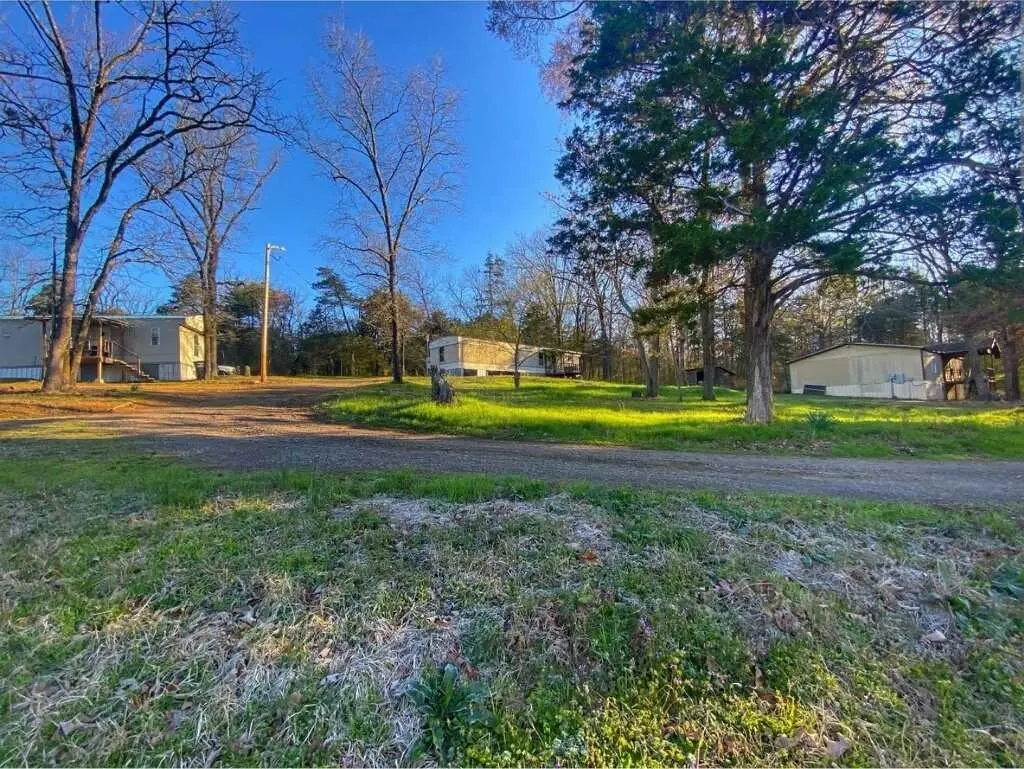
income-producing mobile home park on 1.5 acres of unrestricted land. Property includes three mobile homes, all fully rented and generating consistent cash flow. Utilities are already installed and servicing each unit. With no known restrictions, there is potential for future expansion or additional development. Great opportunity for investors looking for steady returns and long-term growth.
Key facts
- Future expansion
- Fully rented
- Unrestricted land
Tags
Neighborhood map
What this means for you Summary
Snapshot
- This is a 7-bed/5.0-bath manufactured listed at $120k. Condition is rated fair.
Deal economics
- At list price, monthly cash flow is $259 ($3k/yr) — positive.
- The deal already cash-flows at list — no discount required.
- Meets the 1% rule at list price ($1k rent vs $120k).
- Recommended offer: $113k (6.0% below list) — sets the bar for market timing.
- Cap rate 8.9% vs local median 3.1% in Ozark — top-decile yield for the area; either an underpriced asset or a hidden risk that comps aren't pricing in. Stress-test before assuming the spread holds.
Location & tenants
- Location reads 60/100 on livability (#258 in AR) — a middle-class / working-renter tenant base. Strengths: cost of living A+, housing A; Watch: schools D-, crime F, amenities F.
- Lamar School District (rural): math 32% / reading 30% proficiency, ranked #152 of 238 in AR (top 64%) — families likely to look elsewhere, expect single-tenant / working-renter base with shorter leases.
- Market conditions: 81 active listings in the ZIP; 12 units permitted in Johnson County in 2024 (0 in 5+ unit buildings).
Forward outlook
- Local home prices are declining (-3.0%/yr); year-one equity from $830 of loan paydown is wiped out by about $4k of value loss. Plan a longer hold.
- Johnson County population projected at +8% by 2050 — modest demand growth; plan on rents tracking national, not racing it.
Negotiation context
- It's been on market 89 days — a 6% lower offer ($113k) is reasonable based on typical stale-listing flexibility.
- 2 sale attempts since 5y ago with the ask held roughly flat each time — persistent listings suggest the price (not the market) is what's stuck; bring a comps-based counter.
- Current owner paid $56k; list at $120k implies a 114% gain — meaningful room to come down on a strong offer.
Risks & watch-outs
- Climate carrying-cost: moderate wildfire risk; extreme-heat days projected 7→20/yr by 2055 (HVAC capex compounding) — expect insurance premiums to compound above CPI over the hold.
Questions for the listing agent
- It's been on market 89 days. Have you received any prior offers? Is the seller open to a 6% concession, seller financing, or rate buy-down credit?
- Have any recent inspections been done? Can we get a copy of the seller's disclosures and any deferred-maintenance estimates?
- Why hasn't it sold? Are there any deal-killer items the seller is aware of (foundation, flood, title, zoning, code violations)?
- Is there a deadline driving the sale (1031 exchange, divorce, estate, relocation)? That informs how much negotiation room exists.
- Schools are D-rated, which usually means shorter tenancies and higher turnover. Who's the typical renter profile here, and what's been the actual vacancy rate?
- Crime grade is F in this area — have there been break-ins, vandalism, or insurance claims at this property in the last 3 years? What carrier currently insures it and at what premium?
- What's the average days-on-market for RENTAL listings here right now (not sales)? A rising rental-DOM trend means longer vacancies and softer asking-rent achievability than the comps imply.
- What's the recent tenant-quality profile in this submarket — average credit score on applications, eviction rate, late-payment / NSF rate, and stable-employment percentage? A property-management company in the area should have these aggregated.
- How much new for-sale + rental construction is in the pipeline within 1–3 miles? Heavy new supply typically softens prices + rents 12–24 months out; constrained supply supports both.
Investment metrics
- 1% rule
- 1.15% ✓
- Cap rate
- 8.88%
- Cash-on-cash
- 9.24%
- DSCR
- 1.41
- GRM
- 7.3
CMA / ARV
No comps found within radius.
Projected returns pro-forma
-3.0% appreciation · 3.0% rent growth · sell at horizon
- IRR
- -2.3%
- Equity multiple
- 0.91×
- Total profit
- $-2,948
- Equity at exit
- $17,892
- IRR
- 7.4%
- Equity multiple
- 1.56×
- Total profit
- $18,732
- Equity at exit
- $10,375
Cash invested: $33,600 (down + closing). Projections, not guarantees.
Landlord ↔ Tenant lean methodology
- Overall (STATE)
- 92 Strongly Landlord-Friendly
- State Arkansas
- 92 Strongly Landlord-Friendly · R+14
- County
- — inherits STATE
- City
- — inherits STATE
ZIP-level market 72949
- Home prices YoY
- -14.4%
- Active inventory
- 81
- Price-to-rent
- 7.3×
Monthly cashflow live
- Estimated rent
- $1,377 medium interval (Pro) →
- Mortgage (P&I)
- −$629
- Tax est. 1.5%
- −$150 /mo · $1,800/yr
- Insurance
- −$50
- HOA
- −$0
- Vacancy / Maint / Mgmt
- −$289
- Net cashflow
- $259
Break-even live
UW: 25.0% down · 7.5% · 30yr · 1.5% tax · 5.0% vac · 8.0% maint · 8.0% mgmt
Financing live
Cash to close
- Down payment
- $30,000
- Closing costs
- $3,600
- Reserves months
- —
- Total cash needed
- —
Loan-product check · same deal, 3 products live
Conventional
25% down · 7.5% · 30yr
- Down + closing
- —
- Monthly P&I
- —
- Monthly cashflow
- —
- DSCR
- —
- Eligible?
- —
Personal DTI + credit; lowest rate.
DSCR
20% down · 8.5% · 30yr
- Down + closing
- —
- Monthly P&I
- —
- Monthly cashflow
- —
- DSCR
- —
- Eligible?
- —
No personal income docs; deal must DSCR.
Hard money
10% down · 12.0% · 12mo
- Down + closing
- —
- Monthly P&I
- —
- Monthly cashflow
- —
- DSCR
- —
- Eligible?
- —
Short-term bridge; refi at stabilization.
Listing history 3 events
-
2026-02-26$120,000 Active 393-char remark
Show marketing remark (393 chars)
income-producing mobile home park on 1.5 acres of unrestricted land. Property includes three mobile homes, all fully rented and generating consistent cash flow. Utilities are already installed and servicing each unit. With no known restrictions, there is potential for future expansion or additional development. Great opportunity for investors looking for steady returns and long-term growth.
-
2022-03-31soldstatus $56,000 42-char remark
Show marketing remark (42 chars)
Nice rental property 3 rentals good income
-
2021-04-05$65,000 42-char remark
Show marketing remark (42 chars)
Nice rental property 3 rentals good income
ⓘ Source: listings_history table (triggers on properties + properties_extension) + one-shot
backfill from property_details.listing_events for pre-trigger history.
Climate risk First Street
- Flood 1/10 Low FEMA zone X (unshaded) · 0% chance over 30 yrs
- Wildfire 5/10 Major
- Heat 6/10 Major 7 d/yr ≥111°F today · 20 d/yr by 30 yrs out
- Wind 2/10 Low 2% chance of damaging wind over 30 yrs
- Air quality 1/10 Low 0 unhealthy d/yr today · 0 by 30 yrs out
Nearby sold comps map
Loading sold comps map…
Walkable amenities ~0.75 mi
Loading nearby amenities…
Taxation est. · year 1
- Rental income
- $16,526
- − Mortgage interest
- −$6,722
- − Property taxes
- −$1,800
- − Insurance
- −$600
- − Repairs & maintenance
- −$1,322
- − Management
- −$1,322
- − Depreciation
- −$3,491
- Taxable income
- $1,269
- Est. tax owed @ 24.0%
- −$305
- After-tax cash flow
- $2,800/yr
For passive investors: Depreciation is non-cash, so a rental often shows a tax loss while cash-flowing — sheltering income. Rental losses are passive: they offset passive income freely, and up to $25,000/yr can offset ordinary (W-2) income if you actively participate and your MAGI is under $100k (phasing out to $0 by $150k); unused losses carry forward. On sale, claimed depreciation is recaptured at up to 25%, and gains may owe capital-gains tax (a 1031 exchange can defer both). Figures are a year-1 estimate at your 24.0% rate — not tax advice; consult a CPA.
Condition & rehab AI · 12 photos
A fair condition mobile home with moderate repairs and maintenance needed. Upgrades to exterior and interior can significantly enhance its value.
Repairs flagged
- Minor landscaping — some debris and overgrown areas
- Minor exterior paint — some wear
Value-add opportunities
- Both painting and updating exterior — enhances curb appeal and resale value
- Both landscaping and yard work — improves curb appeal and rental value
- Both kitchen and bathroom updates — modernizes spaces and increases value
Renovation cost estimate screening
| Repair item | Severity | Est. cost |
|---|---|---|
| landscaping · some debris and overgrown areas | Minor | $500–3,000 |
| exterior paint · some wear | Minor | $500–3,000 |
| Total estimated repair cost · 2 items | $1,000–6,000 |
Value-add ROI direction
- Both painting and updating exterior — enhances curb appeal and resale value ↑
- Both landscaping and yard work — improves curb appeal and rental value ↑
- Both kitchen and bathroom updates — modernizes spaces and increases value ↑
ⓘ Cost ranges are severity-bucket heuristics (US national rule-of-thumb). Get contractor quotes + a written scope before underwriting a rehab budget.
Schools (NCES district)
- District
- Lamar School District
- NCES district ID
- 0508700
- Math proficiency
- 32% ▼ -18.00%
- Reading proficiency
- 30% ▼ -9.00%
- Median HH income
- $34,106
- Composite
- 25.53/100
- National rank
- #7432
- State rank
- #152 of 238 in AR
Livability — Ozark
- Score
- 60/100
- State rank
- #258
- US rank
- #18601
Category grades
Schools grade is shown separately in the Schools card above.
Census & demographics
- Population (ZIP)
- 9,474
Population outlook (Johnson County) Hauer SSP2
- Today (2025)
- 27,452 people
- By 2030
- 28,003 · +2.0%
- By 2040
- 28,960 · +5.5%
- By 2050
- 29,627 · +7.9%
- By 2075
- 31,000 · +12.9%
- By 2100
- 31,173 · +13.6%
Race, ethnicity, and origin ACS 2023
- Neighborhood character
- Predominantly White (87%)
- Race & ethnicity
- White 87% Two or more races 11% Hispanic / Latino 3%
- Common ancestry
- Lithuanian 1% Serbian 1% Portuguese 1%
- Foreign-born
- 0%
- Languages at home
- 98% English-only · Other Indo-European 1% Spanish 1% German/W. Germanic 1%
Political lean MEDSL · Johnson
- 2024 margin
- Solid R (+51.4) · D 23.3% · R 74.7% · Other 2.0%
- 2008→2024 swing
- -28.4pp toward R · 2008: -23.1pp · 2024: -51.4pp
- All cycles
- 2024: R+51.4 2020: R+49.0 2016: R+40.6 2012: R+28.0 2008: R+23.1
Not yet ingested
- Civics
- —
Market trends
- HPI YoY
- ▼ -30.41%
- Current HPI
- 180.3194
- Rent YoY
- —
- Metro
- —
- State GDP YoY
- ▲ 3.80%
- F500 in state
- 10
Industry mix (Fortune 500 HQ in AR)
| Industry | F500 HQs | Revenue |
|---|---|---|
| Retail | 1 | $681B |
|
||
| Food / Agriculture | 1 | $53B |
|
||
| Retail / Energy | 1 | $22B |
|
||
| Transportation / Logistics | 1 | $12B |
|
||
| Energy | 1 | $4B |
|
||
Price history
+84.6% since first listed3 events — show timeline
- 2026-02-26 Listed $120,000 NWARMLS
- 2022-03-31 Sold (MLS) $56,000 NWARMLS
- 2021-04-05 Listed $65,000 NWARMLS
Cash-flow waterfall
monthlySold comps — $/sqft
last 12 mo · ≤1 miLoading sold comps…