3901 E Pinnacle Peak Rd #76 · Phoenix, AZ
Flood risk 1/10 · Minimal
- FEMA flood zone
- X (shaded)
- Chance of flooding over 30 yrs
- 0.0%
- Est. flood insurance / yr
- $507 – $1,088
Fire risk 5/10 · Moderate
- Est. fire insurance / yr
- $610 – $1,132
Heat risk 8/10 · Major
- Hot days now (above 110°F)
- 7 days/yr
- Hot days in 30 yrs
- 17 days/yr
Wind risk 1/10 · Minimal
- Chance of severe wind over 30 yrs
- —
Air-quality risk 3/10 · Minor
- Unhealthy air days now
- 3 days/yr
- Unhealthy air days in 30 yrs
- 5 days/yr
Risk factors via First Street. Map © Google.
Why this score? — see what drove the B grade
The composite is a weighted blend of 9 inputs, each scored 0–100. Each bar is that input's sub-score; the figure is the points it added to the 100-point composite (weight × sub-score).
- Cash flow +30.0/30.0
- ARV discount +10.4/15.0
- 1% rule +10.0/10.0
- DSCR +10.0/10.0
- Condition / age +4.0/5.0
- Schools +3.8/10.0
- Livability +3.8/5.0
- Rent growth +3.0/5.0
- Appreciation +0.0/10.0
$139,000
🖨 Deal sheet 📄 Offer letter ✓ Due diligence
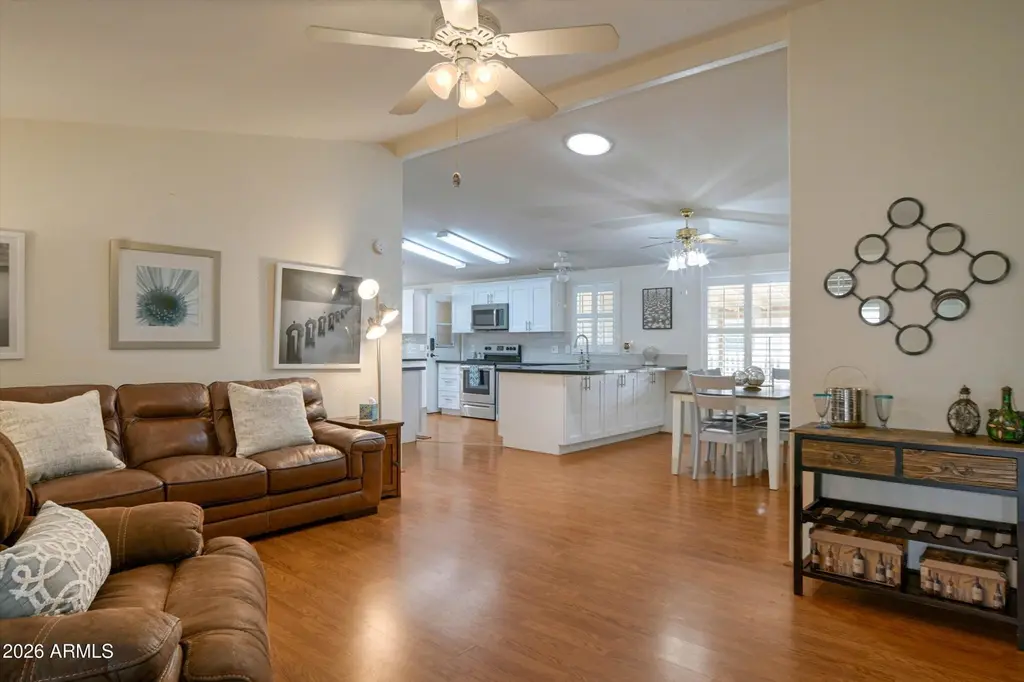
Listing remarks
Discover this 3-bedroom, 2-bath home featuring a bright, open design and a desirable split floor plan. The remodeled kitchen is a chef's dream, complete with new appliances, stone countertops & modern pull-out cabinets for effortless organization. Step outside to find the large screened patio perfect for seamless indoor-outdoor living. The spacious backyard, secured by a private 6ft block wall, offers a blank canvas with endless potential to create your own personal oasis. This 55+ park has a 9 hole executive golf course, 24/7 manned guard gate, heated pool/spa, pickleball, horse shoes, basketball and a Frank Lloyd Wright designed clubhouse with ample activities available. Additionall
Key facts
- 4 parking spots
- Community pool
- Built 1996
Property features AI
Finance
- Other: Association fee includes other items (see remarks)
- Financial info: Land lease amount: monthly fee applies
- HOA & community: Land lease (monthly); Monthly land lease payment; Association rules prohibit visible trucks, trailers, RVs, and boats; Community pool; Community spa (heated); Golf; Pickleball courts
Exterior
- Parking: 2 covered parking spaces; 2 open parking spaces; 2 carport spaces
- Security: Gated community with guarded entry
- Utilities: City water; Sewer: other
- Home design: Manufactured/Mobile home; Leasehold ownership
- Construction: Wood siding; Wood frame construction; Composition roof
- Exterior features: Heated spa; Shed(s); Block fencing; Gravel/stone front and back; Private maintained road
Interior
- Kitchen: Built-in microwave; Non-laminate counters; Refrigerator; Dishwasher; Disposal
- Bedrooms: Up to 3 bedrooms
- Flooring: Laminate flooring
- Bathrooms: 2 full bathrooms
- Heating & cooling: Electric heating; Ceiling fan(s); Has heating and cooling
- Interior features: Double vanity in bathroom; No interior steps; Full bath in primary bedroom; Skylight(s)
Neighborhood map
What this means for you Summary
Snapshot
- This is a 3-bed/2.0-bath manufactured listed at $139k. Condition is rated good.
Deal economics
- At list price, monthly cash flow is $2k ($24k/yr) — positive.
- The deal already cash-flows at list — no discount required.
- Meets the 1% rule at list price ($4k rent vs $139k).
- Recommended offer: $135k (3.0% below list) — sets the bar for market timing.
- Cap rate 23.4% vs local median 3.3% in Phoenix — top-decile yield for the area; either an underpriced asset or a hidden risk that comps aren't pricing in. Stress-test before assuming the spread holds.
Location & tenants
- Location reads 75/100 on livability (#16 in AZ, #3,924 nationally) — a middle-class / working-renter tenant base. Strengths: amenities A+, commute A+, housing A+; Watch: health & safety C-, crime F.
- Paradise Valley Unified District (4241) (urban): math 39% / reading 46% proficiency, ranked #56 of 249 in AZ (top 22%) — families likely to look elsewhere, expect single-tenant / working-renter base with shorter leases.
- Market conditions: Rents rising (+2.0%/yr); 218 active listings in the ZIP; 17 comparable units currently listed for rent nearby; rentals at typical pace (median 22d on market — plan ~3-4 weeks tenant-placement turnaround); high-income renter base; 36,011 units permitted in Maricopa County in 2024 (12,801 in 5+ unit buildings).
- This rent runs 32% of the median local income ($140k/yr) — at the standard rent-burdened threshold; future hikes will face affordability resistance.
Forward outlook
- Local home prices are declining (-3.0%/yr); year-one equity from $961 of loan paydown is wiped out by about $4k of value loss. Plan a longer hold.
- Maricopa County population projected at +38% by 2050 — long-run rental-demand tailwind backs the buy-and-hold thesis.
- At projected returns (-3.0% appreciation + 2.0% rent growth), your $39k cash investment doubles in ~2 years — after that, you're playing with house money.
Negotiation context
- It's been on market 41 days — a 3% lower offer ($135k) is reasonable based on typical stale-listing flexibility.
Risks & watch-outs
- Climate carrying-cost: moderate wildfire risk; extreme-heat days projected 7→17/yr by 2055 (HVAC capex compounding) — expect insurance premiums to compound above CPI over the hold.
Questions for the listing agent
- It's been on market 41 days. Have you received any prior offers? Is the seller open to a 3% concession, seller financing, or rate buy-down credit?
- Is there a deadline driving the sale (1031 exchange, divorce, estate, relocation)? That informs how much negotiation room exists.
- Crime grade is F in this area — have there been break-ins, vandalism, or insurance claims at this property in the last 3 years? What carrier currently insures it and at what premium?
- What's the average days-on-market for RENTAL listings here right now (not sales)? A rising rental-DOM trend means longer vacancies and softer asking-rent achievability than the comps imply.
- What's the recent tenant-quality profile in this submarket — average credit score on applications, eviction rate, late-payment / NSF rate, and stable-employment percentage? A property-management company in the area should have these aggregated.
- How much new for-sale + rental construction is in the pipeline within 1–3 miles? Heavy new supply typically softens prices + rents 12–24 months out; constrained supply supports both.
Investment metrics
- 1% rule
- 2.68% ✓
- Cap rate
- 23.42%
- Cash-on-cash
- 61.15%
- DSCR
- 3.72
- GRM
- 3.1
CMA / ARV
- ARV (median comp)
- $148,500
- List price
- $139,000
- Delta
- -6.40%
- Verdict
- FAIR
- Comps
- 20 within 1.0 mi
Show comp detail 12 sales within ~0.75 mi
| Address | Dist | Beds/Ba | Sqft | Sold | Price | $/sf | Match |
|---|---|---|---|---|---|---|---|
| 3901 E Pinnacle Peak Rd #108 | 0.00mi | 3/2.0 | 1,248 (-8%) | 1mo | $132,000 | $106 | 86 |
| 3901 E Pinnacle Peak Rd #109 | 0.07mi | 2/2.0 (-1) | 1,400 (+4%) | 1mo | $130,000 | $93 | 85 |
| 3901 E Pinnacle Peak Rd #240 | 0.00mi | 3/2.0 | 1,456 (+8%) | 3mo | $152,500 | $105 | 85 |
| 3901 E Pinnacle Peak Rd #323 | 0.07mi | 2/2.0 (-1) | 1,296 (-4%) | 4mo | $159,000 | $123 | 81 |
| 3901 E Pinnacle Peak Rd #67 | 0.07mi | 2/2.0 (-1) | 1,316 (-3%) | 8mo | $172,000 | $131 | 81 |
| 3901 E Pinnacle Peak Rd #4 | 0.07mi | 3/2.0 | 1,456 (+8%) | 4mo | $179,000 | $123 | 81 |
| 3901 E Pinnacle Peak Rd #250 | 0.07mi | 2/2.0 (-1) | 1,248 (-8%) | 3mo | $152,000 | $122 | 77 |
| 3901 E Pinnacle Peak Rd #193 | 0.07mi | 2/2.0 (-1) | 1,400 (+4%) | 11mo | $175,000 | $125 | 77 |
| 3901 E Pinnacle Peak Rd #39 | 0.07mi | 3/2.0 | 1,250 (-8%) | 10mo | $158,000 | $126 | 76 |
| 3901 E Pinnacle Peak Rd #329 | 0.07mi | 2/2.0 (-1) | 1,486 (+10%) | 10mo | $83,000 | $56 | 67 |
| 3901 E Pinnacle Peak Rd #65 | 0.00mi | 2/2.0 (-1) | 1,534 (+14%) | 7mo | $207,000 | $135 | 66 |
| 3901 E Pinnacle Peak Rd #339 | 0.05mi | 2/2.0 (-1) | 1,550 (+15%) | 4mo | $170,000 | $110 | 65 |
Match score weights: distance 35% · size 25% · config 20% · recency 20%. Top-matched comps best support the ARV.
Projected returns pro-forma
-3.0% appreciation · 1.98% rent growth · sell at horizon
- IRR
- 58.8%
- Equity multiple
- 3.57×
- Total profit
- $100,070
- Equity at exit
- $20,725
- IRR
- 63.3%
- Equity multiple
- 7.03×
- Total profit
- $234,810
- Equity at exit
- $12,018
Cash invested: $38,920 (down + closing). Projections, not guarantees.
Landlord ↔ Tenant lean methodology
- Overall (STATE)
- 87 Strongly Landlord-Friendly
- State Arizona
- 87 Strongly Landlord-Friendly · R+3
- County
- — inherits STATE
- City
- — inherits STATE
ZIP-level market 85050
- Home prices YoY
- -21.9%
- Rents YoY
- 2.0%
- Active inventory
- 218
- Price-to-rent
- 3.1×
Monthly cashflow live
- Estimated rent
- $3,727 high interval (Pro) →
- Mortgage (P&I)
- −$729
- Tax est. 1.5%
- −$174 /mo · $2,085/yr
- Insurance
- −$58
- HOA
- −$0
- Vacancy / Maint / Mgmt
- −$783
- Net cashflow
- $1,983
Break-even live
UW: 25.0% down · 7.5% · 30yr · 1.5% tax · 5.0% vac · 8.0% maint · 8.0% mgmt
Financing live
Cash to close
- Down payment
- $34,750
- Closing costs
- $4,170
- Reserves months
- —
- Total cash needed
- —
Loan-product check · same deal, 3 products live
Conventional
25% down · 7.5% · 30yr
- Down + closing
- —
- Monthly P&I
- —
- Monthly cashflow
- —
- DSCR
- —
- Eligible?
- —
Personal DTI + credit; lowest rate.
DSCR
20% down · 8.5% · 30yr
- Down + closing
- —
- Monthly P&I
- —
- Monthly cashflow
- —
- DSCR
- —
- Eligible?
- —
No personal income docs; deal must DSCR.
Hard money
10% down · 12.0% · 12mo
- Down + closing
- —
- Monthly P&I
- —
- Monthly cashflow
- —
- DSCR
- —
- Eligible?
- —
Short-term bridge; refi at stabilization.
Rent comps 17 comps
| Address | Beds | Baths | Sqft | Rent | $/sqft | DOM | Units | Dist |
|---|---|---|---|---|---|---|---|---|
| 3935 E Rough Rider Rd Phoenix, AZ | 2.0 | 2.5–3.0 | 1490 | $4,750 | $3.19 | 43d | 2 | 0.70mi |
| 3935 E Rough Rider Rd Phoenix, AZ | 2.0 | 2.5 | 1383 | $4,350 | $3.15 | 17d | 2 | 0.70mi |
| 3935 E Rough Rider Rd Phoenix, AZ | 2.0–3.0 | 2.5 | 1405 | $6,000 | $4.27 | 18d | 3 | 0.70mi |
| 4066 E Melinda Ln Phoenix, AZ | 3.0 | 2.5 | 1269 | $3,500 | $2.76 | 43d | 1 | 1.02mi |
| 4211 E Kirkland Rd Phoenix, AZ | 4.0 | 2.0 | 1828 | $5,000 | $2.74 | 43d | 1 | 1.08mi |
| 4211 E Kirkland Rd Phoenix, AZ | 4.0 | 2.0 | 1828 | $10,000 | $5.47 | 24d | 1 | 1.08mi |
| 4517 E Melinda Ln Phoenix, AZ | 3.0 | 2.0 | 1663 | $3,100 | $1.86 | 14d | 1 | 1.35mi |
| 4509 E Lone Cactus Dr Phoenix, AZ | 3.0 | 2.0 | 1663 | $4,500 | $2.71 | 43d | 1 | 1.36mi |
| 21624 N 46th Pl Phoenix, AZ | 3.0 | 2.0 | 1540 | $3,200 | $2.08 | 5d | 1 | 1.41mi |
| 4632 E Mossman Rd Phoenix, AZ | 3.0 | 2.0 | 1519 | $3,800 | $2.50 | 43d | 1 | 1.41mi |
| 3626 E Potter Dr Phoenix, AZ | 3.0 | 2.0 | 1519 | $2,500 | $1.65 | 24d | 1 | 1.44mi |
| 3706 E Potter Dr Phoenix, AZ | 4.0 | 2.0 | 1782 | $2,550 | $1.43 | 24d | 1 | 1.45mi |
| 3706 E Potter Dr Phoenix, AZ | 4.0 | 2.0 | 1782 | $2,550 | $1.43 | 22d | 1 | 1.45mi |
| 20729 N 37th Way Phoenix, AZ | 3.0 | 2.0 | 1670 | $3,000 | $1.80 | 15d | 1 | 1.46mi |
| 4726 E Mossman Rd Phoenix, AZ | 3.0 | 2.5 | 1610 | $2,500 | $1.55 | 7d | 1 | 1.46mi |
| 4723 E Weaver Rd Phoenix, AZ | 3.0 | 2.0 | 1663 | $2,595 | $1.56 | 14d | 1 | 1.48mi |
| 20660 N 40th St Phoenix, AZ | 2.0–3.0 | 2.0 | 1325 | $3,500 | $2.64 | 18d | 4 | 1.49mi |
Listing history 15 events
-
2026-06-18days on market $139,000 Active 41 DOM
-
2026-06-17days on market $139,000 Active 40 DOM
-
2026-06-16days on market $139,000 Active 39 DOM
-
2026-06-15days on market $139,000 Active 38 DOM
-
2026-06-13days on market $139,000 Active 36 DOM
-
2026-06-13days on market $139,000 Active 35 DOM
-
2026-06-09pricedays on market $139,000 Active 32 DOM
-
2026-06-08days on market $149,500 Active 31 DOM
-
2026-06-07days on market $149,500 Active 30 DOM
-
2026-06-04days on market $149,500 Active 27 DOM
-
2026-06-03days on market $149,500 Active 26 DOM
-
2026-06-02days on market $149,500 Active 25 DOM
-
2026-06-01days on market $149,500 Active 24 DOM
-
2026-05-31days on market $149,500 Active 23 DOM
-
2026-05-08$149,500 Active 775-char remark
ⓘ Source: listings_history table (triggers on properties + properties_extension) + one-shot
backfill from property_details.listing_events for pre-trigger history.
Climate risk First Street
- Flood 1/10 Low FEMA zone X (shaded) · 0% chance over 30 yrs
- Wildfire 5/10 Major
- Heat 8/10 Severe 7 d/yr ≥110°F today · 17 d/yr by 30 yrs out
- Wind 1/10 Low
- Air quality 3/10 Moderate 3 unhealthy d/yr today · 5 by 30 yrs out
Nearby sold comps map
Loading sold comps map…
Walkable amenities ~0.75 mi
Loading nearby amenities…
Taxation est. · year 1
- Rental income
- $44,719
- − Mortgage interest
- −$7,786
- − Property taxes
- −$2,085
- − Insurance
- −$695
- − Repairs & maintenance
- −$3,578
- − Management
- −$3,578
- − Depreciation
- −$4,044
- Taxable income
- $22,954
- Est. tax owed @ 24.0%
- −$5,509
- After-tax cash flow
- $18,292/yr
For passive investors: Depreciation is non-cash, so a rental often shows a tax loss while cash-flowing — sheltering income. Rental losses are passive: they offset passive income freely, and up to $25,000/yr can offset ordinary (W-2) income if you actively participate and your MAGI is under $100k (phasing out to $0 by $150k); unused losses carry forward. On sale, claimed depreciation is recaptured at up to 25%, and gains may owe capital-gains tax (a 1031 exchange can defer both). Figures are a year-1 estimate at your 24.0% rate — not tax advice; consult a CPA.
Condition & rehab AI · 14 photos
This 3-bedroom, 2-bath home features a bright, open design and a desirable split floor plan. The remodeled kitchen is a chef's dream, complete with new appliances, stone countertops & modern pull-out cabinets for effortless organization. The spacious backyard, secured by a private 6ft block wall, offers a blank canvas with endless potential to create your own personal oasis.
Value-add opportunities
- Both Paint interior walls — Neutral paint can be refreshed to enhance curb appeal and interior aesthetics
- Both Replace ceiling fans with modern fixtures — Modern fans can improve airflow and aesthetics
- Both Install smart home devices — Smart home devices can increase convenience and property value
- Both Add smart thermostat — Smart thermostat can improve energy efficiency and comfort
- Both Add smart lighting — Smart lighting can improve energy efficiency and aesthetics
Renovation cost estimate screening
Value-add ROI direction
- Both Paint interior walls — Neutral paint can be refreshed to enhance curb appeal and interior aesthetics ↑
- Both Replace ceiling fans with modern fixtures — Modern fans can improve airflow and aesthetics ↑
- Both Install smart home devices — Smart home devices can increase convenience and property value ↑
- Both Add smart thermostat — Smart thermostat can improve energy efficiency and comfort ↑
- Both Add smart lighting — Smart lighting can improve energy efficiency and aesthetics ↑
ⓘ Cost ranges are severity-bucket heuristics (US national rule-of-thumb). Get contractor quotes + a written scope before underwriting a rehab budget.
Schools (NCES district)
- District
- Paradise Valley Unified District (4241)
- NCES district ID
- 0405930
- Math proficiency
- 39% ▼ -11.00%
- Reading proficiency
- 46% ▼ -7.00%
- Median HH income
- $64,106
- Composite
- 37.89/100
- National rank
- #4316
- State rank
- #56 of 249 in AZ
Livability — Phoenix
- Score
- 75/100
- State rank
- #16
- US rank
- #3924
Category grades
Schools grade is shown separately in the Schools card above.
Census & demographics
- Census place
- Phoenix, AZ
- County
- Maricopa County · 4,537,380 people
- City population
- 1,500,198
- Metro
- Phoenix-Mesa-Chandler, AZ
- Population (ZIP)
- 33,118
- Household income
- $139,836
- Rent vs Own
- Severe rent burden
- 432.0
Population outlook (Maricopa County) Hauer SSP2
- Today (2025)
- 4,979,203 people
- By 2030
- 5,378,229 · +8.0%
- By 2040
- 6,156,598 · +23.6%
- By 2050
- 6,872,376 · +38.0%
- By 2075
- 8,401,270 · +68.7%
- By 2100
- 9,247,439 · +85.7%
Race, ethnicity, and origin ACS 2023
- Neighborhood character
- Predominantly White (71%)
- Race & ethnicity
- White 71% Hispanic / Latino 11% Two or more races 11% Asian 9% Black 2%
- Hispanic origin (detail)
- Mexican 8%
- Common ancestry
- Romanian 5% Italian 4% Lithuanian 3%
- Foreign-born
- 15% · Canada, China, Vietnam
- Languages at home
- 82% English-only · Spanish 6% Other Indo-European 5% Other Asian/Pacific 2%
Political lean MEDSL · Maricopa
- 2024 margin
- Toss-up / Even · D 47.7% · R 51.2% · Other 1.1%
- 2008→2024 swing
- +7.1pp toward D · 2008: -10.6pp · 2024: -3.5pp
- All cycles
- 2024: R+3.5 2020: D+2.2 2016: R+3.5 2012: R+12.0 2008: R+10.6
Not yet ingested
- Civics
- —
Market trends
- HPI YoY
- ▼ -86.38%
- Current HPI
- 308.7483
- Rent YoY
- ▲ 1.98%
- Metro
- Phoenix-Mesa-Chandler, AZ
- State GDP YoY
- ▲ 4.54%
- F500 in state
- 20
Industry mix (Fortune 500 HQ in AZ)
| Industry | F500 HQs | Revenue |
|---|---|---|
| Technology | 2 | $13B |
|
||
| Mining / Metals | 1 | $23B |
|
||
| Environmental Services | 1 | $16B |
|
||
| Metals / Steel | 1 | $14B |
|
||
| Technology Distribution | 1 | $9B |
|
||
| Homebuilding | 1 | $8B |
|
||
Price history
-7.0% since first listed2 events — show timeline
- 2026-06-09 Price Changed $139,000 ARMLS
- 2026-05-08 Listed $149,500 ARMLS
Cash-flow waterfall
monthlySold comps — $/sqft
last 12 mo · ≤1 miLoading sold comps…