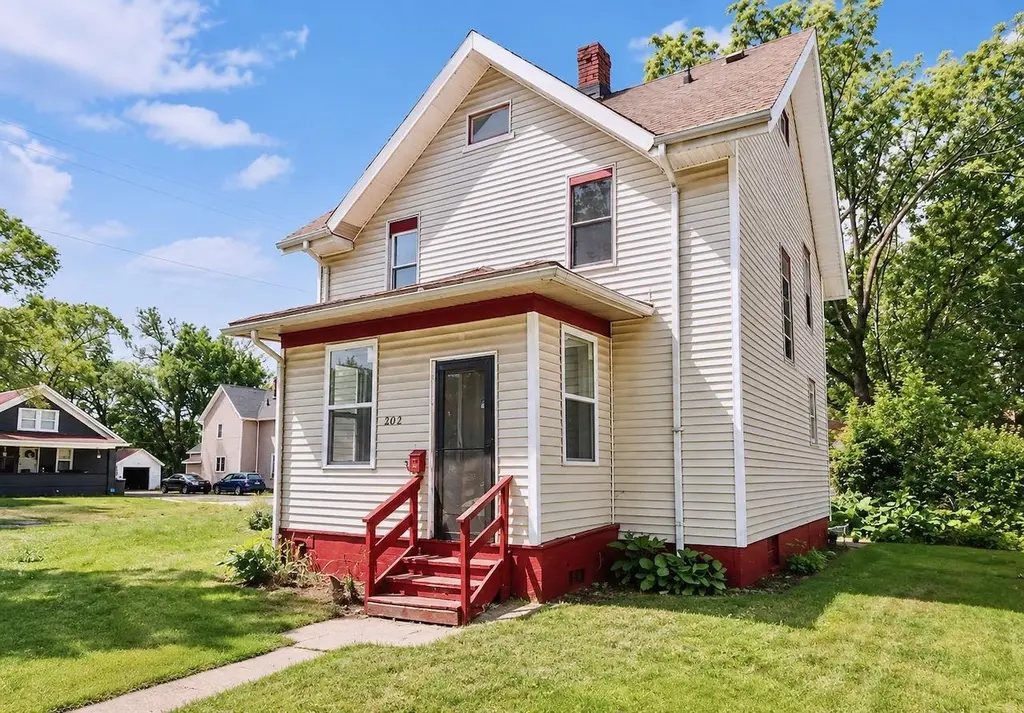
202 Soper Ave · Rockford, IL
Flood risk 1/10 · Minimal
- FEMA flood zone
- X (unshaded)
- Chance of flooding over 30 yrs
- 0.0%
- Est. flood insurance / yr
- $473 – $860
Fire risk 1/10 · Minimal
- Est. fire insurance / yr
- $804 – $1,492
Heat risk 2/10 · Minimal
- Hot days now (above 102°F)
- 7 days/yr
- Hot days in 30 yrs
- 15 days/yr
Wind risk 2/10 · Minimal
- Chance of severe wind over 30 yrs
- —
Air-quality risk 2/10 · Minimal
- Unhealthy air days now
- 1 days/yr
- Unhealthy air days in 30 yrs
- 2 days/yr
Risk factors via First Street. Map © Google.
Why this score? — see what drove the B grade
The composite is a weighted blend of 9 inputs, each scored 0–100. Each bar is that input's sub-score; the figure is the points it added to the 100-point composite (weight × sub-score).
- Cash flow +30.0/30.0
- ARV discount +13.9/15.0
- 1% rule +10.0/10.0
- DSCR +10.0/10.0
- Rent growth +4.0/5.0
- Livability +3.1/5.0
- Condition / age +2.5/5.0
- Schools +1.2/10.0
- Appreciation +0.0/10.0
$87,000
🖨 Deal sheet 📄 Offer letter ✓ Due diligence
Listing remarks
Investor Opportunity! This 3-bedroom, 1-bath home is full of potential and waiting for the right owner to bring it back to life. Situated on a desirable corner lot with a generously sized yard, this property offers plenty of space and possibilities for renovation. The home is being sold as-is, and the seller will make no repairs. The property will not qualify for FHA financing. Cash buyers and renovation loan financing only. With some vision, hard work, and updates, this property could truly shine once again. Don't miss your chance to transform this diamond in the rough into something special! Buyer to verify all room dimensions and property information as needed.
Key facts
- Corner lot
- 8,276 sq ft lot
- Garage
Tags
Property features AI
Exterior
- Parking: Detached concrete garage; 1 garage space
- Utilities: Public water; Public sewer
- Home design: Single-family residence; Residential house; 2-story
- Exterior features: Shingle roof; Lot approximately 0.19 acres
Interior
- Kitchen: Gas cooktop
- Bathrooms: 1 full bathroom
- Heating & cooling: Forced air heating; Natural gas heating
- Interior features: Gas cooktop; Gas water heater; Full basement
- Laundry & utility: Gas water heater
Neighborhood map
What this means for you Summary
Snapshot
- This is a 3-bed/1.0-bath single-family listed at $87k.
Deal economics
- At list price, monthly cash flow is $565 ($7k/yr) — positive.
- The deal already cash-flows at list — no discount required.
- Meets the 1% rule at list price ($1k rent vs $87k).
- Recommended offer: $86k (1.5% below list) — sets the bar for market timing.
- Cap rate 14.1% vs local median 6.1% in Rockford — top-decile yield for the area; either an underpriced asset or a hidden risk that comps aren't pricing in. Stress-test before assuming the spread holds.
Location & tenants
- Location reads 62/100 on livability (#876 in IL) — a middle-class / working-renter tenant base. Strengths: cost of living A+, housing A+, health & safety A+; Watch: crime F, amenities F, commute F.
- Rockford SD 205 (urban): math 12% / reading 16% proficiency, ranked #533 of 620 in IL (top 86%) — low school quality limits family demand, transient renter base, plan for 1-2y turnover; 73% free/reduced lunch — lower-income household profile, screen leases tightly.
- Zoned schools: Lewis Lemon Elementary (math 2% / reading 2%, grade F, #1,927 of 2,056 statewide, top 100%, 339 students, 0% FRL); Kennedy Middle School (math 3% / reading 2%, grade F, #660 of 665 statewide, top 100%, 380 students, 0% FRL); Auburn High School (math 26% / reading 32%, grade F, #210 of 693 statewide, top 30%, 1,936 students, 0% FRL) — zoned schools average 0% FRL vs 73% district-wide (73 pts lower); this property's tenant base skews higher-income than the district average.
- Market conditions: Rents rising fast (+5.9%/yr); 151 active listings in the ZIP; 22 comparable units currently listed for rent nearby; rentals at typical pace (median 21d on market — plan ~3-4 weeks tenant-placement turnaround); 41% of comp listings sitting > 30 days — soft ceiling on asking rent; solid renter incomes; 285 units permitted in Winnebago County in 2024 (0 in 5+ unit buildings).
Forward outlook
- Local home prices are declining (-3.0%/yr); year-one equity from $601 of loan paydown is wiped out by about $3k of value loss. Plan a longer hold.
- Winnebago County population projected at -20% by 2050 — secular population decline; favor cash flow + early exit over multi-decade hold.
- At projected returns (-3.0% appreciation + 5.9% rent growth), your $24k cash investment doubles in ~4 years — after that, you're playing with house money.
Negotiation context
- It's been on market 17 days — a 2% lower offer ($86k) is reasonable based on typical stale-listing flexibility.
- 5 sale attempts since 8y ago with the ask held roughly flat each time — persistent listings suggest the price (not the market) is what's stuck; bring a comps-based counter.
Risks & watch-outs
- Watch-outs: built in 1900 — expect roof / HVAC / electrical / plumbing capex.
Questions for the listing agent
- Built in 1900 — when were the roof, HVAC, electrical panel, plumbing, and water heater last replaced?
- Is there a deadline driving the sale (1031 exchange, divorce, estate, relocation)? That informs how much negotiation room exists.
- Schools are F-rated, which usually means shorter tenancies and higher turnover. Who's the typical renter profile here, and what's been the actual vacancy rate?
- Crime grade is F in this area — have there been break-ins, vandalism, or insurance claims at this property in the last 3 years? What carrier currently insures it and at what premium?
- What's the average days-on-market for RENTAL listings here right now (not sales)? A rising rental-DOM trend means longer vacancies and softer asking-rent achievability than the comps imply.
- What's the recent tenant-quality profile in this submarket — average credit score on applications, eviction rate, late-payment / NSF rate, and stable-employment percentage? A property-management company in the area should have these aggregated.
- How much new for-sale + rental construction is in the pipeline within 1–3 miles? Heavy new supply typically softens prices + rents 12–24 months out; constrained supply supports both.
Investment metrics
- 1% rule
- 1.69% ✓
- Cap rate
- 14.08%
- Cash-on-cash
- 27.81%
- DSCR
- 2.24
- GRM
- 4.9
CMA / ARV
- ARV (on-the-fly)
- $101,376
- Comps found
- 12
Show comp detail 12 sales within ~0.75 mi
| Address | Dist | Beds/Ba | Sqft | Sold | Price | $/sf | Match |
|---|---|---|---|---|---|---|---|
| 2222 Mulberry St | 0.09mi | 3/1.0 | 1,144 (-1%) | 6mo | $119,000 | $104 | 89 |
| 2114 W Jefferson St | 0.17mi | 2/1.0 (-1) | 1,090 (-5%) | 2mo | $80,000 | $73 | 76 |
| 425 Albert Ave | 0.35mi | 3/1.0 | 1,232 (+7%) | 0mo | $50,000 | $41 | 72 |
| 204 Willard Ave | 0.39mi | 3/1.0 | 1,209 (+5%) | 2mo | $130,000 | $108 | 72 |
| 320 Howard Ave | 0.31mi | 3/1.0 | 1,074 (-7%) | 6mo | $90,000 | $84 | 69 |
| 617 N Central Ave | 0.57mi | 4/1.0 (+1) | 1,164 (+1%) | 3mo | $75,000 | $64 | 64 |
| 319 Foster Ave | 0.27mi | 4/1.5 (+1) | 1,264 (+10%) | 2mo | $170,000 | $134 | 63 |
| 707 Royal Ave | 0.43mi | 3/1.0 | 1,279 (+11%) | 1mo | $87,000 | $68 | 60 |
| 2511 Ashland Ave | 0.46mi | 3/1.0 | 1,252 (+9%) | 5mo | $110,000 | $88 | 59 |
| 721 Vista Ter | 0.71mi | 3/1.0 | 1,200 (+4%) | 2mo | $87,500 | $73 | 58 |
| 1425 Green St | 0.72mi | 3/1.5 | 1,188 (+3%) | 2mo | $105,000 | $88 | 57 |
| 435 Waveland Ave | 0.63mi | 3/2.0 | 1,310 (+14%) | 2mo | $142,000 | $108 | 42 |
Match score weights: distance 35% · size 25% · config 20% · recency 20%. Top-matched comps best support the ARV.
Projected returns pro-forma
-3.0% appreciation · 5.92% rent growth · sell at horizon
- IRR
- 25.2%
- Equity multiple
- 2.08×
- Total profit
- $26,312
- Equity at exit
- $12,972
- IRR
- 34.7%
- Equity multiple
- 4.64×
- Total profit
- $88,605
- Equity at exit
- $7,522
Cash invested: $24,360 (down + closing). Projections, not guarantees.
Landlord ↔ Tenant lean methodology
- Overall (STATE)
- 43 Moderately Tenant-Leaning
- State Illinois
- 43 Moderately Tenant-Leaning · D+7
- County
- — inherits STATE
- City
- — inherits STATE
ZIP-level market 61107
- Home prices YoY
- -20.1%
- Rents YoY
- 5.9%
- Active inventory
- 151
- Price-to-rent
- 4.9×
Monthly cashflow live
- Estimated rent
- $1,466 high interval (Pro) →
- Mortgage (P&I)
- −$456
- Tax from tax record
- −$101 /mo · $1,217/yr
- Insurance
- −$36
- HOA
- −$0
- Vacancy / Maint / Mgmt
- −$308
- Net cashflow
- $565
Break-even live
UW: 25.0% down · 7.5% · 30yr · 1.5% tax · 5.0% vac · 8.0% maint · 8.0% mgmt
Financing live
Cash to close
- Down payment
- $21,750
- Closing costs
- $2,610
- Reserves months
- —
- Total cash needed
- —
Loan-product check · same deal, 3 products live
Conventional
25% down · 7.5% · 30yr
- Down + closing
- —
- Monthly P&I
- —
- Monthly cashflow
- —
- DSCR
- —
- Eligible?
- —
Personal DTI + credit; lowest rate.
DSCR
20% down · 8.5% · 30yr
- Down + closing
- —
- Monthly P&I
- —
- Monthly cashflow
- —
- DSCR
- —
- Eligible?
- —
No personal income docs; deal must DSCR.
Hard money
10% down · 12.0% · 12mo
- Down + closing
- —
- Monthly P&I
- —
- Monthly cashflow
- —
- DSCR
- —
- Eligible?
- —
Short-term bridge; refi at stabilization.
Rent comps 22 comps
| Address | Beds | Baths | Sqft | Rent | $/sqft | DOM | Units | Dist |
|---|---|---|---|---|---|---|---|---|
| 2403 Elm St Rockford, IL | 2.0 | 1.0 | 1373 | $1,400 | $1.02 | 13d | 1 | 0.15mi |
| 2403 Elm St Rockford, IL | 2.0 | 1.0 | 1373 | $1,400 | $1.02 | 44d | 1 | 0.15mi |
| 2222 Andrews St Rockford, IL | 4.0 | 1.0 | 1400 | $1,600 | $1.14 | 13d | 1 | 0.15mi |
| 2305 School St Unit 2305-7 Rockford, IL | 2.0 | 1.0 | 875 | $995 | $1.14 | 44d | 1 | 0.24mi |
| 2315 Green St Rockford, IL | 3.0 | 1.0 | 1290 | $1,600 | $1.24 | 44d | 1 | 0.29mi |
| 2011 School St Rockford, IL | 3.0 | 1.0 | 950 | $1,500 | $1.58 | 44d | 1 | 0.33mi |
| 3016 School St Rockford, IL | 4.0 | 1.0 | 1090 | $1,400 | $1.28 | 44d | 1 | 0.44mi |
| 1826 Green St Rockford, IL | 2.0 | 1.0 | 1000 | $1,300 | $1.30 | 21d | 1 | 0.46mi |
| 207 N Central Ave Rockford, IL | 4.0 | 1.5 | 1296 | $1,500 | $1.16 | 13d | 1 | 0.47mi |
| 901 N Horace Ave Rockford, IL | 3.0 | 2.0 | 1400 | $1,700 | $1.21 | 13d | 1 | 0.58mi |
| 1510 School St Unit 1 Rockford, IL | 3.0 | 1.5 | 1400 | $1,200 | $0.86 | 44d | 1 | 0.59mi |
| 418 Orchard Park Rockford, IL | 3.0 | 1.0 | 1232 | $1,500 | $1.22 | 13d | 1 | 0.65mi |
| 924 N Sunset Ave Rockford, IL | 2.0 | 1.0 | 725 | $1,050 | $1.45 | 13d | 1 | 0.65mi |
| 504 Lexington Ave Rockford, IL | 2.0 | 1.0 | 700 | $1,300 | $1.86 | 13d | 1 | 0.74mi |
| 912 Furman St Rockford, IL | 2.0 | 1.0 | 1000 | $1,300 | $1.30 | 13d | 1 | 0.86mi |
| 1116 Irving Ave Unit 1116-301 Rockford, IL | 2.0 | 1.0 | 800 | $950 | $1.19 | 21d | 1 | 0.90mi |
| 1146 Fairview Ave Rockford, IL | 4.0 | 1.5 | 1344 | $1,250 | $0.93 | 21d | 1 | 0.92mi |
| 615 Newport Ave Rockford, IL | 2.0 | 1.0 | 700 | $1,300 | $1.86 | 13d | 1 | 1.05mi |
| 3834 Preston St Rockford, IL | 3.0 | 1.0 | 912 | $1,300 | $1.43 | 13d | 1 | 1.06mi |
| 1617 Vermont St Rockford, IL | 2.0 | 1.0 | 1375 | $1,325 | $0.96 | 44d | 1 | 1.17mi |
| 1413 La Belle Ave Rockford, IL | 2.0 | 1.0 | 900 | $1,200 | $1.33 | 44d | 1 | 1.40mi |
| 1614 Pauline Ave Rockford, IL | 2.0 | 1.0 | 956 | $1,400 | $1.46 | 44d | 1 | 1.46mi |
Listing history 13 events
-
2026-06-19days on market $87,000 Active 17 DOM
-
2026-06-18days on market $87,000 Active 16 DOM
-
2026-06-17days on market $87,000 Active 15 DOM
-
2026-06-16days on market $87,000 Active 14 DOM
-
2026-06-15days on market $87,000 Active 13 DOM
-
2026-06-14days on market $87,000 Active 11 DOM
-
2026-06-13days on market $87,000 Active 10 DOM
-
2026-06-10days on market $87,000 Active 8 DOM
-
2026-06-09days on market $87,000 Active 7 DOM
-
2026-06-08days on market $87,000 Active 6 DOM
-
2026-06-07days on market $87,000 Active 5 DOM
-
2026-06-03remarks 673-char remark
-
2026-06-03$87,000 Active 1 DOM
ⓘ Source: listings_history table (triggers on properties + properties_extension) + one-shot
backfill from property_details.listing_events for pre-trigger history.
Tax reassessment forecast IL · Partial reset (capped growth)
- Current annual tax
- $1,217 · $101/mo
- Projected year-2 tax
- $1,596 · $133/mo
- Expected delta
- +$379/yr (+$32/mo · 31.1%)
ⓘ Screening estimate from a state-policy table — verify with the county assessor before closing.
Climate risk First Street
- Flood 1/10 Low FEMA zone X (unshaded) · 0% chance over 30 yrs
- Wildfire 1/10 Low
- Heat 2/10 Low 7 d/yr ≥102°F today · 15 d/yr by 30 yrs out
- Wind 2/10 Low
- Air quality 2/10 Low 1 unhealthy d/yr today · 2 by 30 yrs out
Nearby sold comps map
Loading sold comps map…
Walkable amenities ~0.75 mi
Loading nearby amenities…
Taxation est. · year 1
- Rental income
- $17,598
- − Mortgage interest
- −$4,873
- − Property taxes
- −$1,217
- − Insurance
- −$435
- − Repairs & maintenance
- −$1,408
- − Management
- −$1,408
- − Depreciation
- −$2,531
- Taxable income
- $5,725
- Est. tax owed @ 24.0%
- −$1,374
- After-tax cash flow
- $5,401/yr
For passive investors: Depreciation is non-cash, so a rental often shows a tax loss while cash-flowing — sheltering income. Rental losses are passive: they offset passive income freely, and up to $25,000/yr can offset ordinary (W-2) income if you actively participate and your MAGI is under $100k (phasing out to $0 by $150k); unused losses carry forward. On sale, claimed depreciation is recaptured at up to 25%, and gains may owe capital-gains tax (a 1031 exchange can defer both). Figures are a year-1 estimate at your 24.0% rate — not tax advice; consult a CPA.
Schools (NCES district)
- District
- Rockford SD 205
- NCES district ID
- 1734510
- Math proficiency
- 12% ▼ -2.00%
- Reading proficiency
- 16% ▼ -3.00%
- Median HH income
- $42,533
- Composite
- 12.21/100
- National rank
- #9649
- State rank
- #533 of 620 in IL
Livability — Rockford
- Score
- 62/100
- State rank
- #876
- US rank
- #17035
Category grades
Schools grade is shown separately in the Schools card above.
Census & demographics
- Census place
- Rockford, IL
- County
- Winnebago County · 147,297 people
- City population
- 147,297
- Metro
- Rockford, IL
- Population (ZIP)
- 30,765
- Household income
- $78,574
- Rent vs Own
- Severe rent burden
- 981.0
Population outlook (Winnebago County) Hauer SSP2
- Today (2025)
- 271,080 people
- By 2030
- 260,684 · -3.8%
- By 2040
- 238,405 · -12.1%
- By 2050
- 216,129 · -20.3%
- By 2075
- 172,882 · -36.2%
- By 2100
- 135,336 · -50.1%
Race, ethnicity, and origin ACS 2023
- Neighborhood character
- Predominantly White (68%)
- Race & ethnicity
- White 68% Hispanic / Latino 15% Black 9% Two or more races 9% Asian 4% Native American 1%
- Hispanic origin (detail)
- Mexican 11% Puerto Rican 1%
- Common ancestry
- Romanian 6% Portuguese 4% Lithuanian 2%
- Foreign-born
- 10% · Canada, China
- Languages at home
- 83% English-only · Spanish 11% Arabic 1% Other Indo-European 1%
Political lean MEDSL · Winnebago
- 2024 margin
- Toss-up / Even · D 49.5% · R 49.0% · Other 1.5%
- 2008→2024 swing
- -12.2pp toward R · 2008: 12.8pp · 2024: 0.6pp
- All cycles
- 2024: D+0.6 2020: D+2.5 2016: R+1.2 2012: D+5.7 2008: D+12.8
Not yet ingested
- Civics
- —
Market trends
- HPI YoY
- ▼ -62.46%
- Current HPI
- 248.8598
- Rent YoY
- ▲ 5.92%
- Metro
- Rockford, IL
- State GDP YoY
- ▲ 1.59%
- F500 in state
- 60
Industry mix (Fortune 500 HQ in IL)
| Industry | F500 HQs | Revenue |
|---|---|---|
| Insurance | 4 | $201B |
|
||
| Consumer Goods | 4 | $87B |
|
||
| Industrial Machinery | 3 | $64B |
|
||
| Healthcare | 2 | $55B |
|
||
| Retail / Pharmacy | 1 | $148B |
|
||
| Agriculture / Food | 1 | $86B |
|
||
Price history
+1238.5% since first listed17 events — show timeline
- 2026-06-01 Listed $87,000 NWIAR
- 2024-12-23 Sold (Public Records) $87,500 Public Records
- 2024-01-31 Listing Removed — MRED as Distributed by MLS Grid
- 2023-12-05 Relisted — MRED as Distributed by MLS Grid
- 2023-11-30 Listing Removed — MRED as Distributed by MLS Grid
- 2023-11-28 Price Changed — MRED as Distributed by MLS Grid
- 2023-11-28 Price Changed $79,500 NWIAR
- 2023-11-01 Price Changed $82,500 NWIAR
- 2023-11-01 Price Changed — MRED as Distributed by MLS Grid
- 2023-10-24 Price Changed $85,000 NWIAR
- 2023-10-24 Price Changed — MRED as Distributed by MLS Grid
- 2023-10-14 Listed — MRED as Distributed by MLS Grid
- 2022-12-20 Listing Removed — MRED as Distributed by MLS Grid
- 2022-08-20 Listed — MRED as Distributed by MLS Grid
- 2018-07-24 Listing Removed — MRED as Distributed by MLS Grid
- 2018-05-29 Listed — MRED as Distributed by MLS Grid
- 2000-11-10 Sold (Public Records) $6,500 Public Records
Property tax history
+0.5%/yrLatest (2024): $1,217 · +3.5% YoY. Source: county tax records.
Cash-flow waterfall
monthlySold comps — $/sqft
last 12 mo · ≤1 miLoading sold comps…