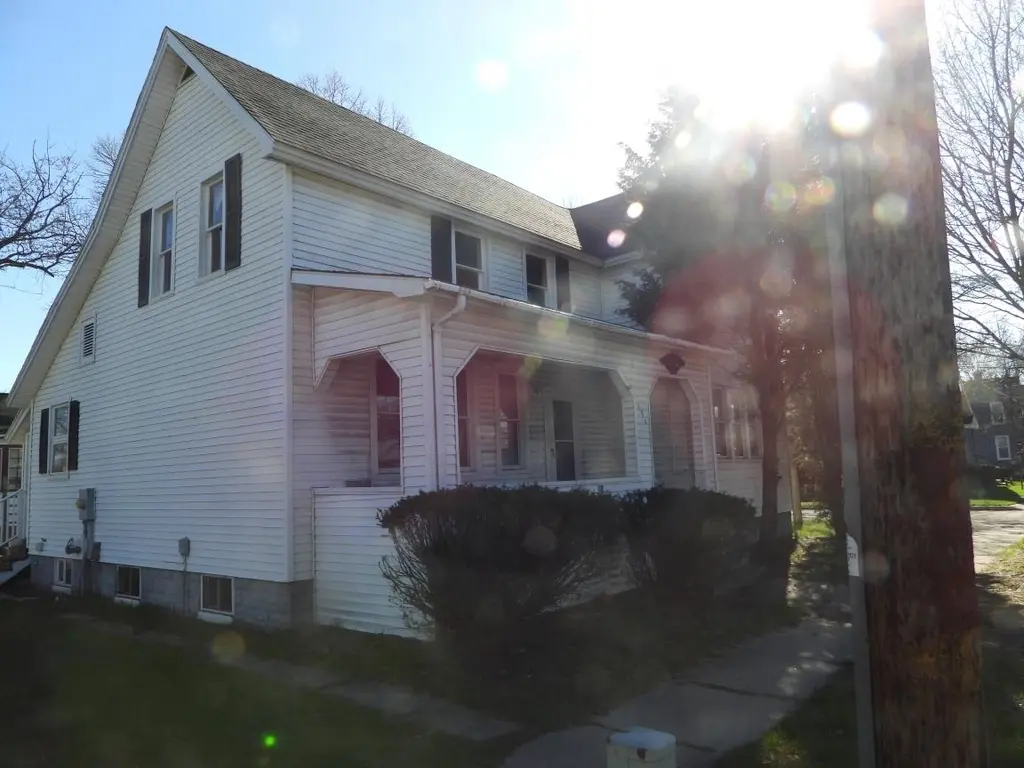
171 8th St · Manistee, MI
Flood risk 1/10 · Minimal
- FEMA flood zone
- X (unshaded)
- Chance of flooding over 30 yrs
- 0.0%
- Est. flood insurance / yr
- $473 – $860
Fire risk 1/10 · Minimal
- Est. fire insurance / yr
- $784 – $1,456
Heat risk 1/10 · Minimal
- Hot days now (above 93°F)
- 7 days/yr
- Hot days in 30 yrs
- 14 days/yr
Wind risk 1/10 · Minimal
- Chance of severe wind over 30 yrs
- —
Air-quality risk 3/10 · Minor
- Unhealthy air days now
- 3 days/yr
- Unhealthy air days in 30 yrs
- 4 days/yr
Risk factors via First Street. Map © Google.
Why this score? — see what drove the C grade
The composite is a weighted blend of 9 inputs, each scored 0–100. Each bar is that input's sub-score; the figure is the points it added to the 100-point composite (weight × sub-score).
- Cash flow +23.7/30.0
- DSCR +7.6/10.0
- ARV discount +7.5/15.0
- 1% rule +6.3/10.0
- Livability +3.9/5.0
- Schools +3.0/10.0
- Rent growth +2.5/5.0
- Condition / age +2.5/5.0
- Appreciation +0.0/10.0
$114,900
🖨 Deal sheet (PDF) 📄 Offer letter ✓ Due diligence
Listing remarks MLS
2 STORY HOME WITH 4 BEDROOM, 2 BATH AND FULL BASEMENT. HOUSE IS IN LIVING CONDITIONS, HOME IS JUST SOUTH OF THE CITY. HOME IS NEAR SHOPPING, RESTAURANT AND DNR STATE PARK
Key facts
- Near shopping
- Near dnr state park
- Full basement
Tags
Property features AI
Exterior
- Parking: Detached 1-car garage
- Utilities: Public water; Shared septic
- Home design: Single-family residence; One and a half stories
- Construction: Vinyl siding
- Exterior features: Front porch; Lot approximately 0.19 acres (dimensions ~138.58 x 62.33); Zoned residential
Interior
- Bathrooms: Two full bathrooms
- Heating & cooling: Forced air heating (natural gas); No central cooling
- Interior features: Full unfinished basement; Seven total rooms
Neighborhood map
What this means for you Summary
Snapshot
- This is a 4-bed/2.0-bath single-family listed at $115k.
Deal economics
- At list price, monthly cash flow is $219 ($3k/yr) — positive.
- The deal already cash-flows at list — no discount required.
- Meets the 1% rule at list price ($1k rent vs $115k).
- Recommended offer: $111k (3.0% below list) — sets the bar for market timing.
- Cap rate 8.6% vs local median 3.0% in Manistee — top-decile yield for the area; either an underpriced asset or a hidden risk that comps aren't pricing in. Stress-test before assuming the spread holds.
Location & tenants
- Location reads 78/100 on livability (#103 in MI, #2,543 nationally) — a middle-class / working-renter tenant base. Strengths: cost of living A+, housing A+, health & safety A; Watch: employment D+, commute F.
- Manistee Area Public Schools (town): math 33% / reading 38% proficiency, ranked #284 of 540 in MI (top 53%) — families likely to look elsewhere, expect single-tenant / working-renter base with shorter leases.
- Zoned schools: Thomas Jefferson Elem School (259 students, 62% FRL); John F Kennedy Elem School (math 37% / reading 32%, grade F, #744 of 1,397 statewide, top 57%, 279 students, 60% FRL); Manistee Middle High School (math 30% / reading 44%, grade F, #334 of 713 statewide, top 51%, 687 students, 50% FRL).
- Market conditions: 156 active listings in the ZIP; 109 units permitted in Manistee County in 2024 (0 in 5+ unit buildings).
Forward outlook
- Local home prices are declining (-3.0%/yr); year-one equity from $794 of loan paydown is wiped out by about $3k of value loss. Plan a longer hold.
- Manistee County population projected at -13% by 2050 — secular population decline; favor cash flow + early exit over multi-decade hold.
Negotiation context
- It's been on market 60 days — a 3% lower offer ($111k) is reasonable based on typical stale-listing flexibility.
- 14 sale attempts since 15y ago; this cycle's ask has dropped $40k (26%) from the opening price — seller is motivated, your offer sets the floor, not the list.
Risks & watch-outs
- Watch-outs: built in 1900 — expect roof / HVAC / electrical / plumbing capex.
Questions for the listing agent
- It's been on market 60 days. Have you received any prior offers? Is the seller open to a 3% concession, seller financing, or rate buy-down credit?
- Built in 1900 — when were the roof, HVAC, electrical panel, plumbing, and water heater last replaced?
- Is there a deadline driving the sale (1031 exchange, divorce, estate, relocation)? That informs how much negotiation room exists.
- What's the average days-on-market for RENTAL listings here right now (not sales)? A rising rental-DOM trend means longer vacancies and softer asking-rent achievability than the comps imply.
- What's the recent tenant-quality profile in this submarket — average credit score on applications, eviction rate, late-payment / NSF rate, and stable-employment percentage? A property-management company in the area should have these aggregated.
- How much new for-sale + rental construction is in the pipeline within 1–3 miles? Heavy new supply typically softens prices + rents 12–24 months out; constrained supply supports both.
Investment metrics
- 1% rule
- 1.13% ✓
- Cap rate
- 8.58%
- Cash-on-cash
- 8.17%
- DSCR
- 1.36
- GRM
- 7.4
CMA / ARV
- ARV (on-the-fly)
- $234,346
- Comps found
- 12
Show comp detail 12 sales within ~0.75 mi
| Address | Dist | Beds/Ba | Sqft | Sold | Price | $/sf | Match |
|---|---|---|---|---|---|---|---|
| 706 Ramsdell St | 0.17mi | 4/2.0 | 1,722 (-2%) | 10mo | $193,000 | $112 | 80 |
| 810 Vine St | 0.11mi | 3/1.5 (-1) | 1,696 (-4%) | 5mo | $82,000 | $48 | 77 |
| 1303 Manistee St | 0.35mi | 3/2.0 (-1) | 1,738 (-1%) | 4mo | $265,000 | $152 | 73 |
| 534 Hancock St | 0.36mi | 4/1.0 | 1,682 (-4%) | 5mo | $132,000 | $78 | 67 |
| 289 6th St | 0.41mi | 3/1.0 (-1) | 1,677 (-5%) | 0mo | $213,900 | $128 | 64 |
| 305 5th St | 0.47mi | 3/1.5 (-1) | 1,826 (+4%) | 7mo | $306,000 | $168 | 59 |
| 1335 Greenwich St | 0.62mi | 3/2.0 (-1) | 1,840 (+4%) | 1mo | $275,000 | $149 | 58 |
| 359 10th St | 0.60mi | 3/2.0 (-1) | 1,632 (-7%) | 7mo | $249,000 | $153 | 49 |
| 115 Mckee St | 0.60mi | 3/1.5 (-1) | 1,942 (+10%) | 5mo | $200,000 | $103 | 44 |
| 602 Fairview Ave | 0.60mi | 3/1.5 (-1) | 1,565 (-11%) | 9mo | $207,900 | $133 | 39 |
| 370 4th St | 0.69mi | 4/1.0 | 1,949 (+11%) | 11mo | $210,000 | $108 | 37 |
| 395 4th St | 0.75mi | 3/2.0 (-1) | 1,550 (-12%) | 10mo | $369,000 | $238 | 31 |
Match score weights: distance 35% · size 25% · config 20% · recency 20%. Top-matched comps best support the ARV.
Projected returns pro-forma
-3.0% appreciation · 3.0% rent growth · sell at horizon
- IRR
- -3.9%
- Equity multiple
- 0.86×
- Total profit
- $-4,643
- Equity at exit
- $17,132
- IRR
- 5.9%
- Equity multiple
- 1.44×
- Total profit
- $14,023
- Equity at exit
- $9,934
Cash invested: $32,172 (down + closing). Projections, not guarantees.
Landlord ↔ Tenant lean methodology
- Overall (STATE)
- 62 Landlord-Friendly
- State Michigan
- 62 Landlord-Friendly · EVEN
- County
- — inherits STATE
- City
- — inherits STATE
ZIP-level market 49660
- Active inventory
- 156
- Price-to-rent
- 7.4×
Monthly cashflow live
- Estimated rent
- $1,293 medium interval (Pro) →
- Mortgage (P&I)
- −$603
- Tax from tax record
- −$152 /mo · $1,828/yr
- Insurance
- −$48
- HOA
- −$0
- Vacancy / Maint / Mgmt
- −$272
- Net cashflow
- $219
Break-even live
Sensitivity live
| Price | -10% $284 | -5% $252 | +0% $219 | +5% $187 | +10% $154 |
|---|---|---|---|---|---|
| Rent | -10% $117 | -5% $168 | +0% $219 | +5% $270 | +10% $321 |
| Rate | -1.0pp $277 | -0.5pp $248 | base $219 | +0.5pp $189 | +1.0pp $159 |
UW: 25.0% down · 7.5% · 30yr · 1.5% tax · 5.0% vac · 8.0% maint · 8.0% mgmt
Financing live
Cash to close
- Down payment
- $28,725
- Closing costs
- $3,447
- Reserves months
- —
- Total cash needed
- —
Loan-product check · same deal, 3 products live
Conventional
25% down · 7.5% · 30yr
- Down + closing
- —
- Monthly P&I
- —
- Monthly cashflow
- —
- DSCR
- —
- Eligible?
- —
Personal DTI + credit; lowest rate.
DSCR
20% down · 8.5% · 30yr
- Down + closing
- —
- Monthly P&I
- —
- Monthly cashflow
- —
- DSCR
- —
- Eligible?
- —
No personal income docs; deal must DSCR.
Hard money
10% down · 12.0% · 12mo
- Down + closing
- —
- Monthly P&I
- —
- Monthly cashflow
- —
- DSCR
- —
- Eligible?
- —
Short-term bridge; refi at stabilization.
Listing history 50 events
-
2026-06-22days on market $114,900 Active 60 DOM
-
2026-06-21days on market $114,900 Active 59 DOM
-
2026-06-21days on market $114,900 Active 58 DOM
-
2026-06-18days on market $114,900 Active 56 DOM
-
2026-06-17days on market $114,900 Active 55 DOM
-
2026-06-16days on market $114,900 Active 54 DOM
-
2026-06-15days on market $114,900 Active 53 DOM
-
2026-06-13days on market $114,900 Active 51 DOM
-
2026-06-12days on market $114,900 Active 50 DOM
-
2026-06-09days on market $114,900 Active 47 DOM
-
2026-06-09price $114,900 Active 46 DOM
-
2026-06-08days on market $132,500 Active 46 DOM
-
2026-06-07days on market $132,500 Active 45 DOM
-
2026-06-07days on market $132,500 Active 44 DOM
-
2026-06-04days on market $132,500 Active 41 DOM
-
2026-06-02days on market $132,500 Active 40 DOM
-
2026-06-01days on market $132,500 Active 39 DOM
-
2026-05-31days on market $132,500 Active 38 DOM
-
2026-05-31days on market $132,500 Active 37 DOM
-
2026-04-20$155,000 Active 170-char remark
Show marketing remark (170 chars)
2 STORY HOME WITH 4 BEDROOM, 2 BATH AND FULL BASEMENT. HOUSE IS IN LIVING CONDITIONS, HOME IS JUST SOUTH OF THE CITY. HOME IS NEAR SHOPPING, RESTAURANT AND DNR STATE PARK
-
2026-04-20$155,000 Active
Show marketing remark (170 chars)
2 STORY HOME WITH 4 BEDROOM, 2 BATH AND FULL BASEMENT. HOUSE IS IN LIVING CONDITIONS, HOME IS JUST SOUTH OF THE CITY. HOME IS NEAR SHOPPING, RESTAURANT AND DNR STATE PARK
-
2026-04-20$155,000 Active 170-char remark
Show marketing remark (170 chars)
2 STORY HOME WITH 4 BEDROOM, 2 BATH AND FULL BASEMENT. HOUSE IS IN LIVING CONDITIONS, HOME IS JUST SOUTH OF THE CITY. HOME IS NEAR SHOPPING, RESTAURANT AND DNR STATE PARK
-
2022-09-20historical
-
2021-12-30soldstatus $115,000 Sold
-
2021-12-30soldstatus $115,000 Sold
-
2021-12-30soldstatus $115,000
-
2021-12-21historical Active Contingent
-
2021-12-21historical Contingent - Continue To Show
-
2021-11-05price $115,000
-
2021-11-05price $115,000
-
2021-11-05status Active
-
2021-11-05status Active
-
2021-10-20historical Contingent - Continue To Show
-
2021-10-20historical Active Backup
-
2021-10-15historical
-
2021-10-15price $119,000
-
2021-10-15price $119,000
-
2021-10-15historical
-
2021-09-20$135,000 Active
-
2021-09-20$135,000
-
2021-09-20$135,000 Active
-
2021-09-18$135,000 Active
-
2021-09-18$135,000 Active
-
2021-09-18$115,000
-
2017-10-12historical
-
2016-10-12$69,900
-
2011-12-19soldstatus $33,500
-
2011-12-19soldstatus $33,500
-
2011-12-14soldstatus $33,500
-
2011-07-08$36,900
ⓘ Source: listings_history table (triggers on properties + properties_extension) + one-shot
backfill from property_details.listing_events for pre-trigger history.
Tax reassessment forecast MI · Partial reset (capped growth)
- Current annual tax
- $1,828 · $152/mo
- Projected year-2 tax
- $1,828 · $152/mo
- Expected delta
- $0/yr ($0/mo · 0.0%)
ⓘ Screening estimate from a state-policy table — verify with the county assessor before closing.
Climate risk First Street
- Flood 1/10 Low FEMA zone X (unshaded) · 0% chance over 30 yrs
- Wildfire 1/10 Low
- Heat 1/10 Low 7 d/yr ≥93°F today · 14 d/yr by 30 yrs out
- Wind 1/10 Low
- Air quality 3/10 Moderate 3 unhealthy d/yr today · 4 by 30 yrs out
Nearby sold comps map
Loading sold comps map…
Walkable amenities ~0.75 mi
Loading nearby amenities…
Taxation est. · year 1
- Rental income
- $15,521
- − Mortgage interest
- −$6,436
- − Property taxes
- −$1,828
- − Insurance
- −$574
- − Repairs & maintenance
- −$1,242
- − Management
- −$1,242
- − Depreciation
- −$3,343
- Taxable income
- $856
- Est. tax owed @ 24.0%
- −$206
- After-tax cash flow
- $2,423/yr
For passive investors: Depreciation is non-cash, so a rental often shows a tax loss while cash-flowing — sheltering income. Rental losses are passive: they offset passive income freely, and up to $25,000/yr can offset ordinary (W-2) income if you actively participate and your MAGI is under $100k (phasing out to $0 by $150k); unused losses carry forward. On sale, claimed depreciation is recaptured at up to 25%, and gains may owe capital-gains tax (a 1031 exchange can defer both). Figures are a year-1 estimate at your 24.0% rate — not tax advice; consult a CPA.
Schools (NCES district)
- District
- Manistee Area Public Schools
- NCES district ID
- 2622410
- Math proficiency
- 33% ▼ -12.00%
- Reading proficiency
- 38% ▼ -7.00%
- Median HH income
- $42,417
- Composite
- 30.02/100
- National rank
- #6358
- State rank
- #284 of 540 in MI
Livability — Manistee
- Score
- 78/100
- State rank
- #103
- US rank
- #2543
Category grades
Schools grade is shown separately in the Schools card above.
Census & demographics
- Census place
- Manistee, MI
- Population (ZIP)
- 14,501
Population outlook (Manistee County) Hauer SSP2
- Today (2025)
- 23,785 people
- By 2030
- 23,227 · -2.3%
- By 2040
- 21,795 · -8.4%
- By 2050
- 20,653 · -13.2%
- By 2075
- 18,833 · -20.8%
- By 2100
- 15,491 · -34.9%
Race, ethnicity, and origin ACS 2023
- Neighborhood character
- Predominantly White (84%)
- Race & ethnicity
- White 84% Two or more races 6% Black 5% Hispanic / Latino 4% Native American 2%
- Common ancestry
- Romanian 15% Iranian 3% Lithuanian 3%
- Foreign-born
- 3% · Canada
- Languages at home
- 95% English-only · Spanish 2% Other Indo-European 1%
Political lean MEDSL · Manistee
- 2024 margin
- R (+15.9) · D 41.2% · R 57.2% · Other 1.6%
- 2008→2024 swing
- -29.2pp toward R · 2008: 13.3pp · 2024: -15.9pp
- All cycles
- 2024: R+15.9 2020: R+15.1 2016: R+15.4 2012: D+5.9 2008: D+13.3
Not yet ingested
- Civics
- —
Market trends
- HPI YoY
- ▼ -204.26%
- Current HPI
- 214.9984
- Rent YoY
- —
- Metro
- —
- State GDP YoY
- ▲ 1.37%
- F500 in state
- 28
Industry mix (Fortune 500 HQ in MI)
| Industry | F500 HQs | Revenue |
|---|---|---|
| Automotive Parts | 3 | $48B |
|
||
| Automotive | 2 | $372B |
|
||
| Chemicals | 1 | $45B |
|
||
| Automotive Retail | 1 | $29B |
|
||
| Healthcare / Medical Devices | 1 | $23B |
|
||
| Automotive Technology | 1 | $20B |
|
||
Price history
+320.1% since first listed32 events — show timeline
- 2026-04-20 Listed $155,000 MiRealSource-MiMLS
- 2026-04-20 Listed $155,000 REALCOMP
- 2026-04-20 Listed $155,000 WWMLS
- 2022-09-20 Listing Removed — MiRealSource-MiMLS
- 2021-12-30 Sold (Public Records) $115,000 Public Records
- 2021-12-30 Sold (MLS) $115,000 SW Michigan MLS
- 2021-12-30 Sold (MLS) $115,000 REALCOMP
- 2021-12-21 Contingent — SW Michigan MLS
- 2021-12-21 Contingent — REALCOMP
- 2021-11-05 Price Changed $115,000 REALCOMP
- 2021-11-05 Price Changed $115,000 SW Michigan MLS
- 2021-11-05 Relisted — REALCOMP
- 2021-11-05 Relisted — SW Michigan MLS
- 2021-10-20 Contingent — REALCOMP
- 2021-10-20 Contingent — SW Michigan MLS
- 2021-10-15 Listing Removed — REALCOMP
- 2021-10-15 Price Changed $119,000 REALCOMP
- 2021-10-15 Price Changed $119,000 SW Michigan MLS
- 2021-10-15 Listing Removed — SW Michigan MLS
- 2021-09-20 Listed $135,000 SW Michigan MLS
- 2021-09-20 Listed $135,000 MiRealSource-MiMLS
- 2021-09-20 Listed $135,000 REALCOMP
- 2021-09-18 Listed $115,000 MiRealSource-MiMLS
- 2021-09-18 Listed $135,000 SW Michigan MLS
- 2021-09-18 Listed $135,000 REALCOMP
- 2017-10-12 Listing Removed — REALCOMP
- 2016-10-12 Listed $69,900 REALCOMP
- 2011-12-19 Sold (MLS) $33,500 REALCOMP
- 2011-12-19 Sold (MLS) $33,500 SW Michigan MLS
- 2011-12-14 Sold (Public Records) $33,500 Public Records
- 2011-07-08 Listed $36,900 REALCOMP
- 2011-07-08 Listed $36,900 SW Michigan MLS
Property tax history
-0.7%/yrLatest (2025): $1,828 · -18.8% YoY. Source: county tax records.
Cash-flow waterfall
monthlySold comps — $/sqft
last 12 mo · ≤1 miLoading sold comps…