 Duplex
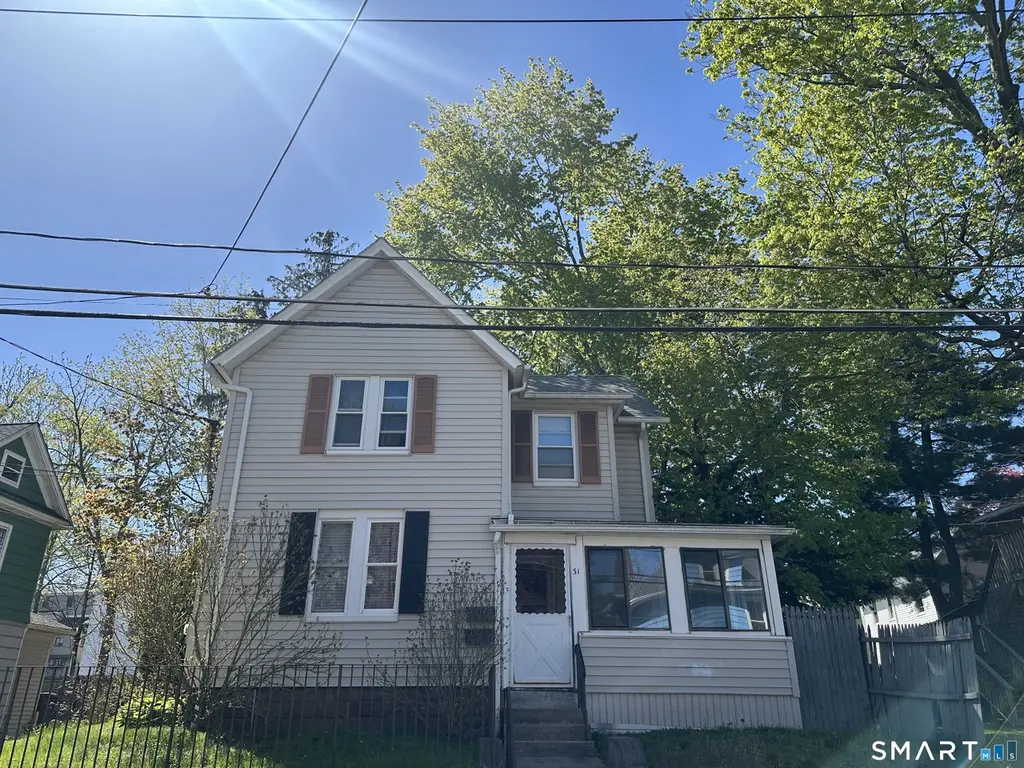
31 Burr Ave · Middletown, CT
Flood risk 1/10 · Minimal
- FEMA flood zone
- X (unshaded)
- Chance of flooding over 30 yrs
- 0.0%
- Est. flood insurance / yr
- $473 – $860
Fire risk 1/10 · Minimal
- Est. fire insurance / yr
- $829 – $1,539
Heat risk 5/10 · Moderate
- Hot days now (above 99°F)
- 7 days/yr
- Hot days in 30 yrs
- 16 days/yr
Wind risk 6/10 · Moderate
- Chance of severe wind over 30 yrs
- 27.0%
Air-quality risk 3/10 · Minor
- Unhealthy air days now
- 3 days/yr
- Unhealthy air days in 30 yrs
- 4 days/yr
Risk factors via First Street. Map © Google.
Why this score? — see what drove the C- grade
The composite is a weighted blend of 9 inputs, each scored 0–100. Each bar is that input's sub-score; the figure is the points it added to the 100-point composite (weight × sub-score).
- Cash flow +17.3/30.0
- ARV discount +11.8/15.0
- DSCR +5.4/10.0
- 1% rule +4.5/10.0
- Livability +4.0/5.0
- Schools +3.0/10.0
- Rent growth +2.6/5.0
- Condition / age +2.5/5.0
- Appreciation +0.0/10.0
$330,000
🖨 Deal sheet 📄 Offer letter ✓ Due diligence
Multi-family units
County records classify this as Multi-Family (2-4 Unit). Listing-text estimate: 2 units. confirmed
Listing remarks
Outstanding opportunity to own a well-maintained two-family property in one of Central Connecticut's most convenient locations. Featuring two spacious 1-bedroom, 1-bath apartments, this versatile property is ideal for owner-occupants seeking rental income or investors looking to expand their portfolio. Thoughtful updates enhance both value and efficiency, including separate on-demand heating and hot water systems installed approximately four years ago, along with a recently constructed deck and exterior staircase serving the second-floor unit. Location is a standout feature. Just steps from Middlesex Health and minutes from Wesleyan University, downtown Middletown's restaurants, shops, and
Key facts
- 5,662 sq ft lot
- 4 parking spots
- Built 1900
Property features AI
Finance
- Other: No additional financial details provided
- Financial info: Multifamily property: 2 units (total rooms listed as 6)
- HOA & community: No HOA information provided
Exterior
- Parking: Unpaved off-street parking; 4 parking spaces
- Security: No security details provided
- Utilities: Public water; Public sewer (in street); Natural gas service
- Home design: Multi-family (2-family) property
- Construction: Frame construction with vinyl siding; Tan exterior color; Asphalt shingle roof; Concrete and masonry foundation; Built as a two-family (multi-unit) building
- Exterior features: Enclosed porch; Open porch; Deck; Shed; Sloping lot
Interior
- Kitchen: No kitchen appliance details provided
- Bedrooms: 2 bedrooms
- Flooring: No flooring details provided
- Bathrooms: 2 full bathrooms
- Heating & cooling: Hot water heating (natural gas); Wall unit cooling
- Interior features: 6 total rooms; Full basement with dirt floor and hatchway; Basement has laundry hook-ups
- Laundry & utility: Basement washer/dryer hook-ups; Tankless hot water (natural gas)
Neighborhood map
What this means for you Summary
Snapshot
- This is a 2 × 1-bed/1.0-bath units multifamily listed at $330k.
Deal economics
- At list price, monthly cash flow is $241 ($3k/yr) — positive. Per door: $120/mo.
- The deal already cash-flows at list — no discount required.
- To meet the 1% rule (rent ≥ 1% of price), the offer needs to be $312k (5.4% below list).
- Recommended offer: $312k (5.4% below list) — sets the bar for 1% rule.
- Cap rate 7.2% vs local median 3.7% in Middletown — top-decile yield for the area; either an underpriced asset or a hidden risk that comps aren't pricing in. Stress-test before assuming the spread holds.
Location & tenants
- Location reads 81/100 on livability (#17 in CT, #1,390 nationally) — a professional / high-income tenant draw. Strengths: crime A+, amenities A+, health & safety A+; Watch: commute F.
- Middletown School District (urban): math 24% / reading 44% proficiency, ranked #113 of 153 in CT (top 74%) — families likely to look elsewhere, expect single-tenant / working-renter base with shorter leases.
- Zoned schools: Middletown High School (math 25% / reading 52%, grade F, #111 of 194 statewide, top 57%, 1,214 students, 49% FRL).
- Market conditions: Rents flat; 143 active listings in the ZIP; 30 comparable units currently listed for rent nearby; rentals at typical pace (median 16d on market — plan ~3-4 weeks tenant-placement turnaround); solid renter incomes; 278 units permitted in Lower Connecticut River Valley Planning Region in 2024 (89 in 5+ unit buildings).
- At $3,122/mo this rent would consume 47% of the median local household income ($79k/yr) (locally 2196% of renters already pay >50% of income on rent) — very limited rent-growth headroom before tenants either downsize or default.
Forward outlook
- Local home prices are declining (-3.0%/yr); year-one equity from $2k of loan paydown is wiped out by about $10k of value loss. Plan a longer hold.
Negotiation context
- It's been on market 31 days — a 3% lower offer ($320k) is reasonable based on typical stale-listing flexibility.
- 5 sale attempts since 23y ago with the ask held roughly flat each time — persistent listings suggest the price (not the market) is what's stuck; bring a comps-based counter.
- Current owner paid $197k; list at $330k implies a 68% gain — meaningful room to come down on a strong offer.
Risks & watch-outs
- Watch-outs: built in 1900 — expect roof / HVAC / electrical / plumbing capex.
- Climate carrying-cost: major wind risk, 27% chance of damaging wind over 30y; extreme-heat days projected 7→16/yr by 2055 (HVAC capex compounding) — expect insurance premiums to compound above CPI over the hold.
Questions for the listing agent
- It's been on market 31 days. Have you received any prior offers? Is the seller open to a 5% concession, seller financing, or rate buy-down credit?
- Can we see the unit-by-unit rent roll, current vacancy, and any below-market leases? What's the average tenancy length?
- What capital expenditures (roof, boiler, parking lot, exteriors) have been made in the last 5 years, and what's planned in the next 2?
- Built in 1900 — when were the roof, HVAC, electrical panel, plumbing, and water heater last replaced?
- Is there a deadline driving the sale (1031 exchange, divorce, estate, relocation)? That informs how much negotiation room exists.
- What's the average days-on-market for RENTAL listings here right now (not sales)? A rising rental-DOM trend means longer vacancies and softer asking-rent achievability than the comps imply.
- What's the recent tenant-quality profile in this submarket — average credit score on applications, eviction rate, late-payment / NSF rate, and stable-employment percentage? A property-management company in the area should have these aggregated.
- How much new apartment / multifamily construction is in the pipeline within 1–3 miles? Heavy new supply (>2% of stock underway) typically softens rents 12–24 months out; light construction supports rent growth.
Investment metrics
- 1% rule
- 0.95% ✗
- Cap rate
- 7.17%
- Cash-on-cash
- 3.12%
- DSCR
- 1.14
- GRM
- 8.8
CMA / ARV
- ARV (median comp)
- $365,119
- List price
- $330,000
- Delta
- -9.62%
- Verdict
- FAIR
- Comps
- 20 within 1.0 mi
Show comp detail 1 sale within ~0.75 mi
| Address | Dist | Beds/Ba | Sqft | Sold | Price | $/sf | Match |
|---|---|---|---|---|---|---|---|
| 205 Main ST EXT | 0.40mi | 2/2.0 | 1,264 (-14%) | 23mo | $177,000 | $140 | 39 |
Match score weights: distance 35% · size 25% · config 20% · recency 20%. Top-matched comps best support the ARV.
Projected returns pro-forma
-3.0% appreciation · 0.22% rent growth · sell at horizon
- IRR
- -14.5%
- Equity multiple
- 0.50×
- Total profit
- $-46,635
- Equity at exit
- $49,204
- IRR
- -11.0%
- Equity multiple
- 0.42×
- Total profit
- $-53,804
- Equity at exit
- $28,532
Cash invested: $92,400 (down + closing). Projections, not guarantees.
Landlord ↔ Tenant lean methodology
- Overall (STATE)
- 27 Tenant-Leaning
- State Connecticut
- 27 Tenant-Leaning · D+7
- County
- — inherits STATE
- City
- — inherits STATE
ZIP-level market 06457
- Rents YoY
- 0.2%
- Active inventory
- 143
- Price-to-rent
- 17.6×
Monthly cashflow live
- Estimated rent
- $3,122 high interval (Pro) →
- Mortgage (P&I)
- −$1,731
- Tax from tax record
- −$358 /mo · $4,293/yr
- Insurance
- −$138
- HOA
- −$0
- Vacancy / Maint / Mgmt
- −$656
- Net cashflow
- $241
Break-even live
2-unit breakdown (identical units grouped — click to expand)
| Units | Beds | Baths | Est. rent |
|---|---|---|---|
| 2× units | 1 | 1 | $3,122 |
| #1 | 1 | 1 | $1,561 |
| #2 | 1 | 1 | $1,561 |
| Total (2 units) | $3,122 | ||
UW: 25.0% down · 7.5% · 30yr · 1.5% tax · 5.0% vac · 8.0% maint · 8.0% mgmt
Financing live
Cash to close
- Down payment
- $82,500
- Closing costs
- $9,900
- Reserves months
- —
- Total cash needed
- —
Loan-product check · same deal, 3 products live
Conventional
25% down · 7.5% · 30yr
- Down + closing
- —
- Monthly P&I
- —
- Monthly cashflow
- —
- DSCR
- —
- Eligible?
- —
Personal DTI + credit; lowest rate.
DSCR
20% down · 8.5% · 30yr
- Down + closing
- —
- Monthly P&I
- —
- Monthly cashflow
- —
- DSCR
- —
- Eligible?
- —
No personal income docs; deal must DSCR.
Hard money
10% down · 12.0% · 12mo
- Down + closing
- —
- Monthly P&I
- —
- Monthly cashflow
- —
- DSCR
- —
- Eligible?
- —
Short-term bridge; refi at stabilization.
Rent comps 30 comps
| Address | Beds | Baths | Sqft | Rent | $/sqft | DOM | Units | Dist |
|---|---|---|---|---|---|---|---|---|
| 31 Burr Ave #1 Middletown, CT | 1.0 | 1.0 | 894 | $1,600 | $1.79 | 2d | 1 | 0.02mi |
| 27 Woodside Cir Unit 37 Middletown, CT | 3.0 | 2.0 | 1600 | $2,300 | $1.44 | 44d | 1 | 0.19mi |
| 305 S Main St Middletown, CT | 1.0–2.0 | 1.0 | 950 | $1,850 | $1.95 | 2d | 1 | 0.23mi |
| 11 Huber Ave Middletown, CT | 3.0 | 1.0 | 1102 | $2,300 | $2.09 | 24d | 1 | 0.30mi |
| 61 Main St Unit 2 Middletown, CT | 2.0 | 1.0 | 913 | $1,800 | $1.97 | 44d | 1 | 0.45mi |
| 166 College St Unit 2 Middletown, CT | 2.0 | 1.0 | 975 | $1,700 | $1.74 | 16d | 1 | 0.53mi |
| 36 Walnut St Unit 2 Middletown, CT | 2.0 | 1.0 | 1200 | $1,400 | $1.17 | 44d | 1 | 0.62mi |
| 43 McKenzie St Middletown, CT | 2.0 | 1.0 | 981 | $1,800 | $1.83 | 44d | 1 | 0.70mi |
| 505 Main St Middletown, CT | 3.0 | 2.0 | 1263 | $2,000 | $1.58 | 2d | 1 | 0.83mi |
| 131 Eastern Dr Middletown, CT | 2.0 | 1.5 | 1442 | $1,750 | $1.21 | 2d | 1 | 0.87mi |
| 57 Ferry St Unit 1 Middletown, CT | 3.0 | 1.5 | 1500 | $2,000 | $1.33 | 10d | 1 | 0.89mi |
| 60 Ferry St Unit 1A Middletown, CT | 2.0 | 1.0 | 950 | $1,750 | $1.84 | 14d | 1 | 0.90mi |
| 94 Liberty St Middletown, CT | 3.0 | 1.5 | 978 | $1,850 | $1.89 | 44d | 1 | 0.91mi |
| 173 Liberty St Middletown, CT | 2.0 | 1.0 | 1172 | $1,500 | $1.28 | 16d | 1 | 0.91mi |
| 582 Main St Middletown, CT | 3.0 | 1.0 | 1200 | $2,000 | $1.67 | 2d | 1 | 0.91mi |
| 40 Ferry St Middletown, CT | 2.0 | 2.0 | 1100 | $1,750 | $1.59 | 14d | 1 | 0.92mi |
| 40 Ferry St Unit 4A Middletown, CT | 2.0 | 2.0 | 1100 | $1,750 | $1.59 | 2d | 1 | 0.92mi |
| 59 Park Pl Middletown, CT | 2.0 | 1.0 | 929 | $1,700 | $1.83 | 20d | 1 | 0.93mi |
| 39 Grand St Unit 3 Middletown, CT | 3.0 | 1.0 | 1076 | $2,000 | $1.86 | 2d | 1 | 0.96mi |
| 3 Clinton Ave Unit 3 CLINTON Middletown, CT | 3.0 | 1.0 | 1200 | $1,450 | $1.21 | 21d | 1 | 0.97mi |
| 22 Green St Middletown, CT | 2.0 | 1.0 | 1000 | $1,400 | $1.40 | 44d | 1 | 0.98mi |
| 128 Grand St Unit 3 Middletown, CT | 2.0 | 1.0 | 1000 | $1,650 | $1.65 | 44d | 1 | 0.99mi |
| 63 Maynard St Middletown, CT | 2.0 | 1.0 | 950 | $1,600 | $1.68 | 44d | 1 | 0.99mi |
| 580 High St Middletown, CT | 3.0 | 1.0 | 1466 | $1,900 | $1.30 | 2d | 1 | 1.25mi |
| 103 Grove St Unit 3 Middletown, CT | 2.0 | 1.0 | 1000 | $1,700 | $1.70 | 2d | 1 | 1.38mi |
| 38 Boston Rd Middletown, CT | 2.0 | 1.0 | 704 | $4,480 | $6.36 | 2d | 1 | 1.39mi |
| 650 High St Unit 2 Middletown, CT | 2.0 | 1.0 | 900 | $1,500 | $1.67 | 24d | 1 | 1.40mi |
| 652 High St Middletown, CT | 2.0 | 1.0 | 1100 | $1,600 | $1.45 | 44d | 1 | 1.40mi |
| 184 Rose Cir Middletown, CT | 1.0–3.0 | 1.0–1.5 | 1220 | $1,700 | $1.39 | 2d | 6 | 1.42mi |
| 3 Quarry Ln Unit 1 Portland, CT | 2.0 | 1.0 | 900 | $1,800 | $2.00 | 10d | 1 | 1.46mi |
Listing history 27 events
-
2026-06-18days on market $330,000 Active 31 DOM
-
2026-06-17days on market $330,000 Active 30 DOM
-
2026-06-16days on market $330,000 Active 29 DOM
-
2026-06-15days on market $330,000 Active 28 DOM
-
2026-06-13days on market $330,000 Active 26 DOM
-
2026-06-13days on market $330,000 Active 25 DOM
-
2026-06-10remarks 699-char remark
-
2026-06-10days on market $330,000 Active 23 DOM
-
2026-06-09days on market $330,000 Active 22 DOM
-
2026-06-08days on market $330,000 Active 21 DOM
-
2026-06-07days on market $330,000 Active 20 DOM
-
2026-06-03days on market $330,000 Active 16 DOM
-
2026-06-02days on market $330,000 Active 15 DOM
-
2026-06-01days on market $330,000 Active 14 DOM
-
2026-05-31days on market $330,000 Active 13 DOM
-
2026-05-13historical $330,000 683-char remark
-
2017-11-21historical
-
2017-07-05$174,500
-
2015-06-13historical
-
2015-04-13$180,000
-
2007-04-13soldstatus $197,000
-
2007-04-12soldstatus $197,000
-
2006-10-03$216,000
-
2003-09-02soldstatus $125,000
-
2003-09-02soldstatus $125,000
-
2003-08-29soldstatus $125,000
-
2003-04-01$138,900
ⓘ Source: listings_history table (triggers on properties + properties_extension) + one-shot
backfill from property_details.listing_events for pre-trigger history.
Tax reassessment forecast CT · Partial reset (capped growth)
- Current annual tax
- $4,293 · $358/mo
- Projected year-2 tax
- $5,678 · $473/mo
- Expected delta
- +$1,384/yr (+$115/mo · 32.3%)
ⓘ Screening estimate from a state-policy table — verify with the county assessor before closing.
Climate risk First Street
- Flood 1/10 Low FEMA zone X (unshaded) · 0% chance over 30 yrs
- Wildfire 1/10 Low
- Heat 5/10 Major 7 d/yr ≥99°F today · 16 d/yr by 30 yrs out
- Wind 6/10 Major 27% chance of damaging wind over 30 yrs
- Air quality 3/10 Moderate 3 unhealthy d/yr today · 4 by 30 yrs out
Nearby sold comps map
Loading sold comps map…
Walkable amenities ~0.75 mi
Loading nearby amenities…
Taxation est. · year 1
- Rental income
- $37,464
- − Mortgage interest
- −$18,485
- − Property taxes
- −$4,293
- − Insurance
- −$1,650
- − Repairs & maintenance
- −$2,997
- − Management
- −$2,997
- − Depreciation
- −$9,600
- Taxable loss
- −$2,558
- Est. tax savings @ 24.0%
- +$614
- After-tax cash flow
- $3,501/yr
For passive investors: Depreciation is non-cash, so a rental often shows a tax loss while cash-flowing — sheltering income. Rental losses are passive: they offset passive income freely, and up to $25,000/yr can offset ordinary (W-2) income if you actively participate and your MAGI is under $100k (phasing out to $0 by $150k); unused losses carry forward. On sale, claimed depreciation is recaptured at up to 25%, and gains may owe capital-gains tax (a 1031 exchange can defer both). Figures are a year-1 estimate at your 24.0% rate — not tax advice; consult a CPA.
Schools (NCES district)
- District
- Middletown School District
- NCES district ID
- 0902490
- Math proficiency
- 24% ▼ -15.00%
- Reading proficiency
- 44% ▼ -8.00%
- Median HH income
- $60,733
- Composite
- 30.47/100
- National rank
- #6224
- State rank
- #113 of 153 in CT
Livability — Middletown
- Score
- 81/100
- State rank
- #17
- US rank
- #1390
Category grades
Schools grade is shown separately in the Schools card above.
Census & demographics
- Census place
- Middletown, CT
- County
- Middlesex County · 63,941 people
- City population
- 46,720
- Metro
- Hartford-East Hartford-Middletown, CT
- Population (ZIP)
- 46,720
- Household income
- $79,463
- Rent vs Own
- Severe rent burden
- 2196.0
Population outlook (Lower Connecticut River Valley County) Hauer SSP2
- By 2040
- 188,651
Race, ethnicity, and origin ACS 2023
- Neighborhood character
- Majority White (65%)
- Race & ethnicity
- White 65% Black 13% Hispanic / Latino 12% Two or more races 9% Asian 5%
- Hispanic origin (detail)
- Mexican 1% Puerto Rican 7%
- Common ancestry
- Romanian 9% Lithuanian 5% Slovak 2%
- Foreign-born
- 12% · Canada, China
- Languages at home
- 82% English-only · Spanish 6% Other Indo-European 4% Russian/Polish/Slavic 2%
Political lean MEDSL · Lower Connecticut River Valley
- 2024 margin
- D (+13.4) · D 55.9% · R 42.4% · Other 1.7%
- All cycles
- 2024: D+13.4
Not yet ingested
- Civics
- —
Market trends
- HPI YoY
- ▼ -470.20%
- Current HPI
- 255.1597
- Rent YoY
- ▲ 0.22%
- Metro
- Hartford-East Hartford-Middletown, CT
- State GDP YoY
- ▲ 1.06%
- F500 in state
- 38
Industry mix (Fortune 500 HQ in CT)
| Industry | F500 HQs | Revenue |
|---|---|---|
| Industrial Machinery | 4 | $38B |
|
||
| Insurance | 3 | $71B |
|
||
| Financial Services | 2 | $25B |
|
||
| Transportation / Logistics | 2 | $18B |
|
||
| Healthcare | 1 | $247B |
|
||
| Telecommunications | 1 | $55B |
|
||
Price history
+137.6% since first listed13 events — show timeline
- 2026-05-19 Listed $330,000 Smart MLS
- 2026-05-13 Coming Soon $330,000 Smart MLS
- 2017-11-21 Listing Removed — Smart MLS
- 2017-07-05 Listed $174,500 Smart MLS
- 2015-06-13 Listing Removed — Smart MLS
- 2015-04-13 Listed $180,000 Smart MLS
- 2007-04-13 Sold (Public Records) $197,000 Public Records
- 2007-04-12 Sold (MLS) $197,000 Smart MLS
- 2006-10-03 Listed $216,000 Smart MLS
- 2003-09-02 Sold (Public Records) $125,000 Public Records
- 2003-09-02 Sold (Public Records) $125,000 Public Records
- 2003-08-29 Sold (MLS) $125,000 Smart MLS
- 2003-04-01 Listed $138,900 Smart MLS
Property tax history
-0.1%/yrLatest (2022): $4,293 · +0.0% YoY. Source: county tax records.
Cash-flow waterfall
monthlySold comps — $/sqft
last 12 mo · ≤1 miLoading sold comps…