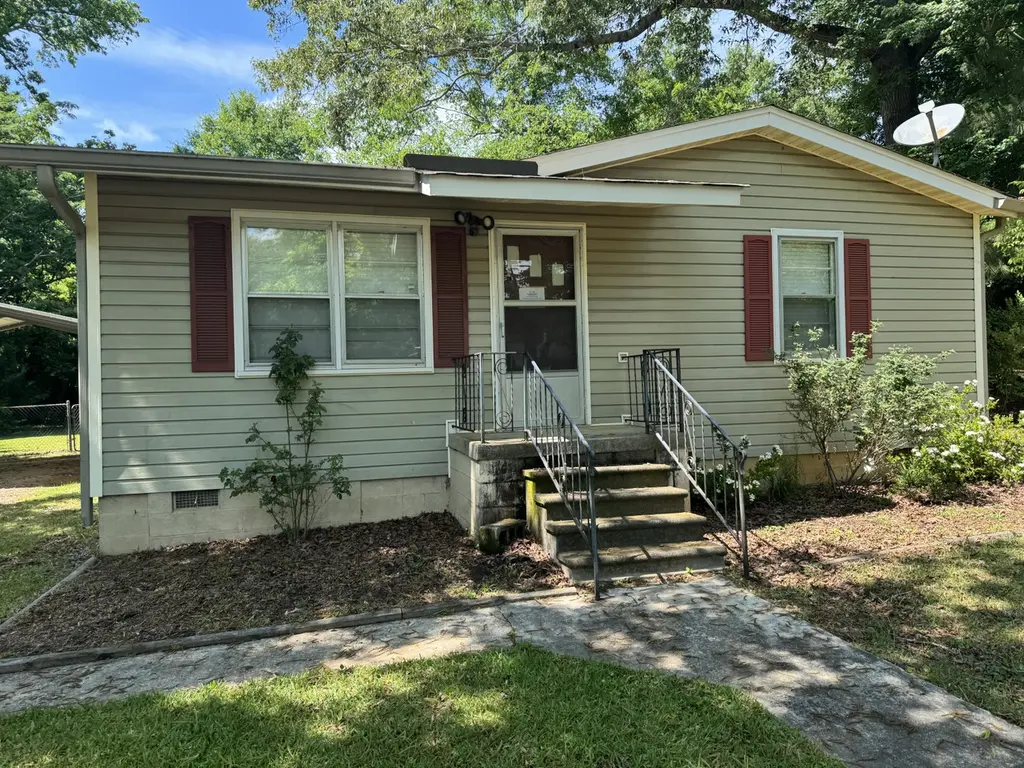
103 Furman Ave · Greenwood, SC
Flood risk 1/10 · Minimal
- FEMA flood zone
- X (unshaded)
- Chance of flooding over 30 yrs
- 0.0%
- Est. flood insurance / yr
- $507 – $1,088
Fire risk 3/10 · Minor
- Est. fire insurance / yr
- $783 – $1,453
Heat risk 6/10 · Moderate
- Hot days now (above 105°F)
- 7 days/yr
- Hot days in 30 yrs
- 17 days/yr
Wind risk 6/10 · Moderate
- Chance of severe wind over 30 yrs
- 27.0%
Air-quality risk 3/10 · Minor
- Unhealthy air days now
- 3 days/yr
- Unhealthy air days in 30 yrs
- 3 days/yr
Risk factors via First Street. Map © Google.
Why this score? — see what drove the C grade
The composite is a weighted blend of 9 inputs, each scored 0–100. Each bar is that input's sub-score; the figure is the points it added to the 100-point composite (weight × sub-score).
- Cash flow +22.4/30.0
- 1% rule +8.0/10.0
- ARV discount +7.5/15.0
- DSCR +7.2/10.0
- Livability +3.2/5.0
- Schools +2.9/10.0
- Rent growth +2.5/5.0
- Condition / age +2.5/5.0
- Appreciation +0.0/10.0
$95,000
🖨 Deal sheet 📄 Offer letter ✓ Due diligence
Listing remarks MLS
Check out this cozy cottage one level home in a great location just off bypass behind the old Walmart. Walking distance to everything! Vinyl siding for easy maintenance. 2 bedrooms, 1 full bath Hardwood floors (underneath carpet). Central heat and air with 4 ton unit installed 2017. Ceiling fans in all rooms Lots of windows for natural light with 2 inch faux wood blinds. Fully fenced . 48 acre private lot in quiet neighborhood with two double gates and electrical hookup. 22 x 20 2 car awning carport added in 2017. Smooth top stove, refrigerator. Gutters with lead guards installed 2017. Beautiful back yard with a serene setting!!
Key facts
- Fully fenced
- Central heat and air
- Ceiling fans
Tags
Property features AI
Exterior
- Parking: Carport (2 spaces)
- Utilities: Public water; Public sewer; Cable available
- Home design: Single-family residence; One story
- Construction: Vinyl siding; Block foundation; Composition roof; Built with typical residential construction
- Exterior features: Porch; Deck; Fenced yard; Landscaped lot; Paved road access; Outbuilding
Interior
- Flooring: Ceramic tile; Carpet; Hardwood
- Bathrooms: 1 full bathroom
- Heating & cooling: Natural gas heating; Central electric air conditioning; Ceiling fans
- Interior features: Ceiling fans; Storm windows; Gas water heater; See remarks
- Laundry & utility: Washer hookup; Electric dryer hookup
Neighborhood map
What this means for you Summary
Snapshot
- This is a 2-bed/1.0-bath other listed at $95k.
Deal economics
- At list price, monthly cash flow is $158 ($2k/yr) — positive.
- The deal already cash-flows at list — no discount required.
- Meets the 1% rule at list price ($1k rent vs $95k).
- Recommended offer: $94k (1.5% below list) — sets the bar for market timing.
- Cap rate 8.3% vs local median 3.6% in Greenwood — top-decile yield for the area; either an underpriced asset or a hidden risk that comps aren't pricing in. Stress-test before assuming the spread holds.
Location & tenants
- Location reads 63/100 on livability (#167 in SC) — a middle-class / working-renter tenant base. Strengths: cost of living A+, health & safety A+, housing A; Watch: amenities D, schools F, crime F.
- Greenwood 50 (town): math 31% / reading 39% proficiency, ranked #43 of 80 in SC (top 54%) — families likely to look elsewhere, expect single-tenant / working-renter base with shorter leases.
- Market conditions: 253 active listings in the ZIP; 1 comparable units currently listed for rent nearby; 193 units permitted in Greenwood County in 2024 (0 in 5+ unit buildings).
Forward outlook
- Local home prices are declining (-3.0%/yr); year-one equity from $657 of loan paydown is wiped out by about $3k of value loss. Plan a longer hold.
- Greenwood County population projected to shrink 8% by 2050 — rents likely to lag national; underwrite the cash flow, not the appreciation.
Negotiation context
- It's been on market 16 days — a 2% lower offer ($94k) is reasonable based on typical stale-listing flexibility.
- 6 sale attempts since 10y ago with the ask held roughly flat each time — persistent listings suggest the price (not the market) is what's stuck; bring a comps-based counter.
Risks & watch-outs
- Watch-outs: property tax is 3.6% of price.
- Climate carrying-cost: major wind risk, 27% chance of damaging wind over 30y; extreme-heat days projected 7→17/yr by 2055 (HVAC capex compounding) — expect insurance premiums to compound above CPI over the hold.
Questions for the listing agent
- Built in 1963 — when were the roof, HVAC, electrical panel, plumbing, and water heater last replaced?
- Property tax is high relative to price — has the assessment been appealed recently, and will the sale trigger a re-assessment?
- Is there a deadline driving the sale (1031 exchange, divorce, estate, relocation)? That informs how much negotiation room exists.
- Schools are F-rated, which usually means shorter tenancies and higher turnover. Who's the typical renter profile here, and what's been the actual vacancy rate?
- Crime grade is F in this area — have there been break-ins, vandalism, or insurance claims at this property in the last 3 years? What carrier currently insures it and at what premium?
- What's the average days-on-market for RENTAL listings here right now (not sales)? A rising rental-DOM trend means longer vacancies and softer asking-rent achievability than the comps imply.
- What's the recent tenant-quality profile in this submarket — average credit score on applications, eviction rate, late-payment / NSF rate, and stable-employment percentage? A property-management company in the area should have these aggregated.
- How much new for-sale + rental construction is in the pipeline within 1–3 miles? Heavy new supply typically softens prices + rents 12–24 months out; constrained supply supports both.
Investment metrics
- 1% rule
- 1.30% ✓
- Cap rate
- 8.28%
- Cash-on-cash
- 7.11%
- DSCR
- 1.32
- GRM
- 6.4
CMA / ARV
No comps found within radius.
Projected returns pro-forma
-3.0% appreciation · 3.0% rent growth · sell at horizon
- IRR
- -5.3%
- Equity multiple
- 0.80×
- Total profit
- $-5,232
- Equity at exit
- $14,165
- IRR
- 4.5%
- Equity multiple
- 1.33×
- Total profit
- $8,861
- Equity at exit
- $8,214
Cash invested: $26,600 (down + closing). Projections, not guarantees.
Landlord ↔ Tenant lean methodology
- Overall (STATE)
- 90 Strongly Landlord-Friendly
- State South Carolina
- 90 Strongly Landlord-Friendly · R+6
- County
- — inherits STATE
- City
- — inherits STATE
ZIP-level market 29649
- Active inventory
- 253
- Price-to-rent
- 6.4×
Monthly cashflow live
- Estimated rent
- $1,238 medium interval (Pro) →
- Mortgage (P&I)
- −$498
- Tax from tax record
- −$283 /mo · $3,392/yr
- Insurance
- −$40
- HOA
- −$0
- Vacancy / Maint / Mgmt
- −$260
- Net cashflow
- $158
Break-even live
UW: 25.0% down · 7.5% · 30yr · 1.5% tax · 5.0% vac · 8.0% maint · 8.0% mgmt
Financing live
Cash to close
- Down payment
- $23,750
- Closing costs
- $2,850
- Reserves months
- —
- Total cash needed
- —
Loan-product check · same deal, 3 products live
Conventional
25% down · 7.5% · 30yr
- Down + closing
- —
- Monthly P&I
- —
- Monthly cashflow
- —
- DSCR
- —
- Eligible?
- —
Personal DTI + credit; lowest rate.
DSCR
20% down · 8.5% · 30yr
- Down + closing
- —
- Monthly P&I
- —
- Monthly cashflow
- —
- DSCR
- —
- Eligible?
- —
No personal income docs; deal must DSCR.
Hard money
10% down · 12.0% · 12mo
- Down + closing
- —
- Monthly P&I
- —
- Monthly cashflow
- —
- DSCR
- —
- Eligible?
- —
Short-term bridge; refi at stabilization.
Rent comps 1 comps
| Address | Beds | Baths | Sqft | Rent | $/sqft | DOM | Units | Dist |
|---|---|---|---|---|---|---|---|---|
| 207 New Market St Greenwood, SC | 2.0 | 1.0 | 650 | $800 | $1.23 | 11d | 5 | 1.42mi |
Listing history 14 events
-
2026-05-14historical Active Under Contract 636-char remark
Show marketing remark (636 chars)
Check out this cozy cottage one level home in a great location just off bypass behind the old Walmart. Walking distance to everything! Vinyl siding for easy maintenance. 2 bedrooms, 1 full bath Hardwood floors (underneath carpet). Central heat and air with 4 ton unit installed 2017. Ceiling fans in all rooms Lots of windows for natural light with 2 inch faux wood blinds. Fully fenced . 48 acre private lot in quiet neighborhood with two double gates and electrical hookup. 22 x 20 2 car awning carport added in 2017. Smooth top stove, refrigerator. Gutters with lead guards installed 2017. Beautiful back yard with a serene setting!!
-
2026-05-11$95,000 Active 636-char remark
Show marketing remark (636 chars)
Check out this cozy cottage one level home in a great location just off bypass behind the old Walmart. Walking distance to everything! Vinyl siding for easy maintenance. 2 bedrooms, 1 full bath Hardwood floors (underneath carpet). Central heat and air with 4 ton unit installed 2017. Ceiling fans in all rooms Lots of windows for natural light with 2 inch faux wood blinds. Fully fenced . 48 acre private lot in quiet neighborhood with two double gates and electrical hookup. 22 x 20 2 car awning carport added in 2017. Smooth top stove, refrigerator. Gutters with lead guards installed 2017. Beautiful back yard with a serene setting!!
-
2026-05-11$95,000 Active
Show marketing remark (636 chars)
Check out this cozy cottage one level home in a great location just off bypass behind the old Walmart. Walking distance to everything! Vinyl siding for easy maintenance. 2 bedrooms, 1 full bath Hardwood floors (underneath carpet). Central heat and air with 4 ton unit installed 2017. Ceiling fans in all rooms Lots of windows for natural light with 2 inch faux wood blinds. Fully fenced . 48 acre private lot in quiet neighborhood with two double gates and electrical hookup. 22 x 20 2 car awning carport added in 2017. Smooth top stove, refrigerator. Gutters with lead guards installed 2017. Beautiful back yard with a serene setting!!
-
2025-10-28price $139,900
-
2024-06-25soldstatus $125,000 Closed
-
2024-06-25soldstatus $125,000
-
2024-06-25soldstatus $125,000
-
2024-05-10status Pending
-
2024-05-06$120,000 Active
-
2024-05-06$120,000
-
2024-05-06$120,000
-
2016-12-19soldstatus $48,000
-
2016-12-09soldstatus $48,000
-
2016-11-01$48,000
ⓘ Source: listings_history table (triggers on properties + properties_extension) + one-shot
backfill from property_details.listing_events for pre-trigger history.
Tax reassessment forecast SC · Resets to sale price
- Current annual tax
- $3,392 · $283/mo
- Projected year-2 tax
- $3,392 · $283/mo
- Expected delta
- $0/yr ($0/mo · 0.0%)
ⓘ Screening estimate from a state-policy table — verify with the county assessor before closing.
Climate risk First Street
- Flood 1/10 Low FEMA zone X (unshaded) · 0% chance over 30 yrs
- Wildfire 3/10 Moderate
- Heat 6/10 Major 7 d/yr ≥105°F today · 17 d/yr by 30 yrs out
- Wind 6/10 Major 27% chance of damaging wind over 30 yrs
- Air quality 3/10 Moderate 3 unhealthy d/yr today · 3 by 30 yrs out
Nearby sold comps map
Loading sold comps map…
Walkable amenities ~0.75 mi
Loading nearby amenities…
Taxation est. · year 1
- Rental income
- $14,857
- − Mortgage interest
- −$5,321
- − Property taxes
- −$3,392
- − Insurance
- −$475
- − Repairs & maintenance
- −$1,189
- − Management
- −$1,189
- − Depreciation
- −$2,764
- Taxable income
- $528
- Est. tax owed @ 24.0%
- −$127
- After-tax cash flow
- $1,765/yr
For passive investors: Depreciation is non-cash, so a rental often shows a tax loss while cash-flowing — sheltering income. Rental losses are passive: they offset passive income freely, and up to $25,000/yr can offset ordinary (W-2) income if you actively participate and your MAGI is under $100k (phasing out to $0 by $150k); unused losses carry forward. On sale, claimed depreciation is recaptured at up to 25%, and gains may owe capital-gains tax (a 1031 exchange can defer both). Figures are a year-1 estimate at your 24.0% rate — not tax advice; consult a CPA.
Schools (NCES district)
- District
- Greenwood 50
- NCES district ID
- 4502340
- Math proficiency
- 31% ▼ -4.00%
- Reading proficiency
- 39% ▲ 2.00%
- Median HH income
- $37,663
- Composite
- 29.14/100
- National rank
- #6585
- State rank
- #43 of 80 in SC
Livability — Greenwood
- Score
- 63/100
- State rank
- #167
- US rank
- #15097
Category grades
Schools grade is shown separately in the Schools card above.
Census & demographics
- Census place
- Greenwood, SC
- County
- Greenwood County · 26,275 people
- Metro
- Greenwood, SC
- Population (ZIP)
- 26,275
- Household income
- $54,585
- Rent vs Own
- Severe rent burden
- 566.0
Population outlook (Greenwood County) Hauer SSP2
- Today (2025)
- 69,627 people
- By 2030
- 68,905 · -1.0%
- By 2040
- 66,640 · -4.3%
- By 2050
- 63,768 · -8.4%
- By 2075
- 55,769 · -19.9%
- By 2100
- 47,293 · -32.1%
Race, ethnicity, and origin ACS 2023
- Neighborhood character
- Predominantly White (65%)
- Race & ethnicity
- White 65% Black 25% Hispanic / Latino 4% Two or more races 4% Asian 2%
- Common ancestry
- Serbian 3% Italian 3% Slovak 3%
- Foreign-born
- 4% · Canada, China
- Languages at home
- 97% English-only · Spanish 2%
Political lean MEDSL · Greenwood
- 2024 margin
- Strong R (+29.0) · D 34.9% · R 63.8% · Other 1.3%
- 2008→2024 swing
- -13.3pp toward R · 2008: -15.7pp · 2024: -29.0pp
- All cycles
- 2024: R+29.0 2020: R+22.8 2016: R+21.8 2012: R+15.4 2008: R+15.7
Not yet ingested
- Civics
- —
Market trends
- HPI YoY
- ▼ -128.00%
- Current HPI
- 167.9262
- Rent YoY
- —
- Metro
- Greenwood, SC
- State GDP YoY
- ▲ 4.51%
- F500 in state
- 2
Industry mix (Fortune 500 HQ in SC)
| Industry | F500 HQs | Revenue |
|---|---|---|
| Packaging | 1 | $7B |
|
||
Price history
+97.9% since first listed14 events — show timeline
- 2026-05-14 Contingent — GAOR
- 2026-05-11 Listed $95,000 GAOR
- 2026-05-11 Listed $95,000 AMLS
- 2025-10-28 Price Changed $139,900 GAOR
- 2024-06-25 Sold (MLS) $125,000 Hive MLS
- 2024-06-25 Sold (MLS) $125,000 Hive MLS
- 2024-06-25 Sold (MLS) $125,000 AMLS
- 2024-05-10 Pending — AMLS
- 2024-05-06 Listed $120,000 AMLS
- 2024-05-06 Listed $120,000 Hive MLS
- 2024-05-06 Listed $120,000 Hive MLS
- 2016-12-19 Sold (Public Records) $48,000 Public Records
- 2016-12-09 Sold (MLS) $48,000 GAOR
- 2016-11-01 Listed $48,000 GAOR
Property tax history
+8.4%/yrLatest (2025): $3,392 · +2726.6% YoY. Source: county tax records.
Cash-flow waterfall
monthlySold comps — $/sqft
last 12 mo · ≤1 miLoading sold comps…