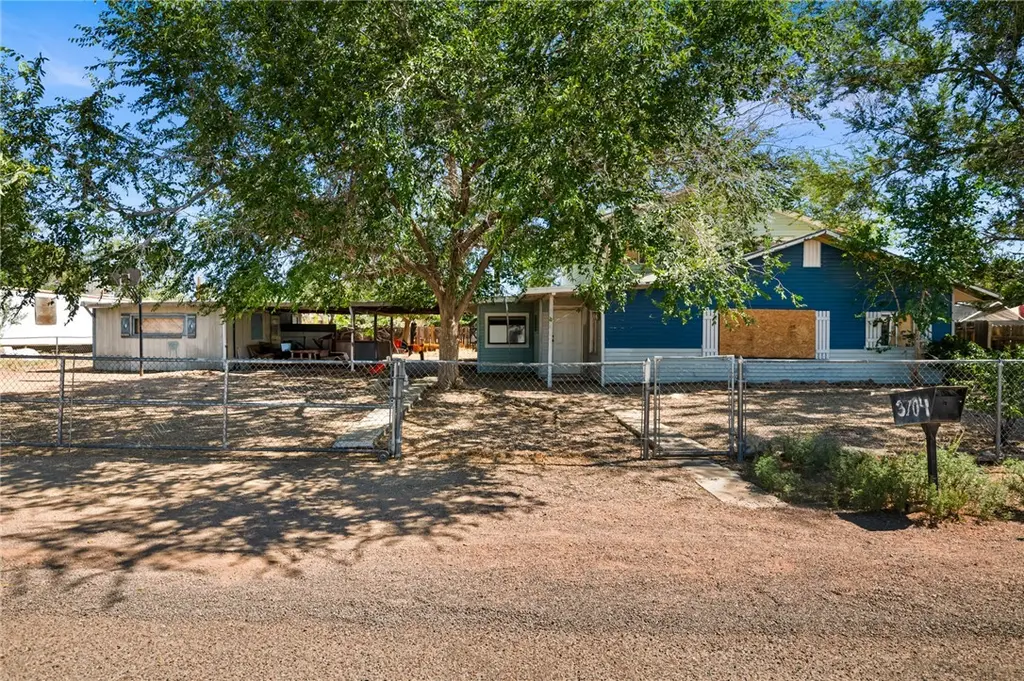
3704 E Hearne Ave · New Kingman-Butler, AZ
Flood risk 1/10 · Minimal
- FEMA flood zone
- X (unshaded)
- Chance of flooding over 30 yrs
- 0.0%
- Est. flood insurance / yr
- $507 – $1,088
Fire risk 6/10 · Moderate
- Est. fire insurance / yr
- $610 – $1,132
Heat risk 6/10 · Moderate
- Hot days now (above 100°F)
- 5 days/yr
- Hot days in 30 yrs
- 13 days/yr
Wind risk 1/10 · Minimal
- Chance of severe wind over 30 yrs
- —
Air-quality risk 1/10 · Minimal
- Unhealthy air days now
- 0 days/yr
- Unhealthy air days in 30 yrs
- 0 days/yr
Risk factors via First Street. Map © Google.
Why this score? — see what drove the B- grade
The composite is a weighted blend of 9 inputs, each scored 0–100. Each bar is that input's sub-score; the figure is the points it added to the 100-point composite (weight × sub-score).
- Cash flow +26.3/30.0
- ARV discount +15.0/15.0
- DSCR +8.9/10.0
- 1% rule +5.8/10.0
- Rent growth +2.6/5.0
- Livability +2.5/5.0
- Condition / age +2.5/5.0
- Schools +1.8/10.0
- Appreciation +0.0/10.0
$170,000
🖨 Deal sheet 📄 Offer letter ✓ Due diligence
Listing remarks MLS
Fixer-Upper Opportunity on a Double Lot in Kingman! This 3-bedroom, 2-bath, two-story home is full of potential and ready for your personal touch. Inside, you'll find a spacious layout with a living room, separate den, and formal dining area - offering plenty of room for family or entertaining. Outside, the home sits on a double lot with a large fully-fenced yard, providing tons of space for pets, play, or future improvements. A huge carport and attached workshop add even more value for hobbyists or extra storage. Whether you're an investor or a buyer looking to build sweat equity, this property is a great opportunity you won't want to miss!
Key facts
- Attached workshop
- Fully-fenced yard
- Double lot
Tags
Neighborhood map
What this means for you Summary
Snapshot
- This is a 3-bed/2.0-bath single-family listed at $170k.
Deal economics
- At list price, monthly cash flow is $439 ($5k/yr) — positive.
- The deal already cash-flows at list — no discount required.
- Meets the 1% rule at list price ($2k rent vs $170k).
- Recommended offer: $160k (6.0% below list) — sets the bar for market timing.
- Cap rate 9.4% vs local median 4.3% in New Kingman-Butler — top-decile yield for the area; either an underpriced asset or a hidden risk that comps aren't pricing in. Stress-test before assuming the spread holds.
Location & tenants
- Location reads: area grade B — affects rentability + tenant quality, not the cash-flow math above.
- Kingman Unified School District (79598) (town): math 19% / reading 24% proficiency, ranked #179 of 249 in AZ (top 72%) — low school quality limits family demand, transient renter base, plan for 1-2y turnover.
- Market conditions: Rents flat; 643 active listings in the ZIP; 8 comparable units currently listed for rent nearby; rentals lingering (median 44d on market — plan ~5-8 weeks vacancy on turnover, expect pricing pressure); 62% of comp listings sitting > 30 days — soft ceiling on asking rent; 2,543 units permitted in Mohave County in 2024 (33 in 5+ unit buildings).
- This rent runs 43% of the median local income ($51k/yr) — at the standard rent-burdened threshold; future hikes will face affordability resistance.
Forward outlook
- Local home prices are declining (-3.0%/yr); year-one equity from $1k of loan paydown is wiped out by about $5k of value loss. Plan a longer hold.
- Mohave County population projected to shrink 6% by 2050 — rents likely to lag national; underwrite the cash flow, not the appreciation.
Negotiation context
- It's been on market 66 days — a 6% lower offer ($160k) is reasonable based on typical stale-listing flexibility.
- 2 sale attempts with the ask held roughly flat each time — persistent listings suggest the price (not the market) is what's stuck; bring a comps-based counter.
- Current owner paid $55k; list at $170k implies a 209% gain — meaningful room to come down on a strong offer.
Risks & watch-outs
- Climate carrying-cost: major wildfire risk; extreme-heat days projected 5→13/yr by 2055 (HVAC capex compounding) — expect insurance premiums to compound above CPI over the hold.
Questions for the listing agent
- It's been on market 66 days. Have you received any prior offers? Is the seller open to a 6% concession, seller financing, or rate buy-down credit?
- Built in 1974 — when were the roof, HVAC, electrical panel, plumbing, and water heater last replaced?
- Why hasn't it sold? Are there any deal-killer items the seller is aware of (foundation, flood, title, zoning, code violations)?
- Is there a deadline driving the sale (1031 exchange, divorce, estate, relocation)? That informs how much negotiation room exists.
- What's the average days-on-market for RENTAL listings here right now (not sales)? A rising rental-DOM trend means longer vacancies and softer asking-rent achievability than the comps imply.
- What's the recent tenant-quality profile in this submarket — average credit score on applications, eviction rate, late-payment / NSF rate, and stable-employment percentage? A property-management company in the area should have these aggregated.
- How much new for-sale + rental construction is in the pipeline within 1–3 miles? Heavy new supply typically softens prices + rents 12–24 months out; constrained supply supports both.
Investment metrics
- 1% rule
- 1.08% ✓
- Cap rate
- 9.39%
- Cash-on-cash
- 11.06%
- DSCR
- 1.49
- GRM
- 7.7
CMA / ARV
- ARV (median comp)
- $262,207
- List price
- $170,000
- Delta
- -35.17%
- Verdict
- UNDERPRICED
- Comps
- 20 within 1.0 mi
Show comp detail 12 sales within ~0.75 mi
| Address | Dist | Beds/Ba | Sqft | Sold | Price | $/sf | Match |
|---|---|---|---|---|---|---|---|
| 3717 E Angelina Dr | 0.26mi | 4/2.0 (+1) | 1,969 (-2%) | 2mo | $305,000 | $155 | 79 |
| 3798 E Nicole Ave | 0.41mi | 3/2.0 | 1,701 (-15%) | 0mo | $265,000 | $156 | 56 |
| 3799 E Ames Ave | 0.52mi | 3/2.0 | 1,819 (-9%) | 8mo | $295,000 | $162 | 54 |
| 4807 N Powell Ave | 0.55mi | 4/2.0 (+1) | 1,909 (-4%) | 10mo | $408,400 | $214 | 54 |
| 4779 N Andrea Cir | 0.43mi | 4/2.0 (+1) | 1,815 (-9%) | 9mo | $269,990 | $149 | 52 |
| 3900 E Lass Ave | 0.43mi | 3/2.0 | 1,742 (-13%) | 8mo | $299,900 | $172 | 52 |
| 3932 E Ames Ave | 0.63mi | 3/2.0 | 1,800 (-10%) | 3mo | $319,999 | $178 | 51 |
| 4535 E Highway 66 | 0.72mi | 2/1.5 (-1) | 2,028 (+2%) | 9mo | $188,000 | $93 | 50 |
| 3845 E Butler Ave | 0.38mi | 2/2.0 (-1) | 1,708 (-15%) | 8mo | $170,000 | $100 | 46 |
| 4783 N Andrea Cir | 0.43mi | 4/2.0 (+1) | 1,741 (-13%) | 10mo | $293,990 | $169 | 45 |
| 3925 E Ames Ave | 0.64mi | 3/2.0 | 1,800 (-10%) | 10mo | $306,300 | $170 | 45 |
| 3960 E Ames Ave | 0.69mi | 3/2.0 | 1,801 (-10%) | 8mo | $290,000 | $161 | 45 |
Match score weights: distance 35% · size 25% · config 20% · recency 20%. Top-matched comps best support the ARV.
Projected returns pro-forma
-3.0% appreciation · 0.33% rent growth · sell at horizon
- IRR
- -2.6%
- Equity multiple
- 0.91×
- Total profit
- $-4,474
- Equity at exit
- $25,348
- IRR
- 4.2%
- Equity multiple
- 1.28×
- Total profit
- $13,113
- Equity at exit
- $14,698
Cash invested: $47,600 (down + closing). Projections, not guarantees.
Landlord ↔ Tenant lean methodology
- Overall (STATE)
- 87 Strongly Landlord-Friendly
- State Arizona
- 87 Strongly Landlord-Friendly · R+3
- County
- — inherits STATE
- City
- — inherits STATE
ZIP-level market 86409
- Rents YoY
- 0.3%
- Active inventory
- 643
- Price-to-rent
- 7.7×
Monthly cashflow live
- Estimated rent
- $1,836 high interval (Pro) →
- Mortgage (P&I)
- −$891
- Tax from tax record
- −$49 /mo · $590/yr
- Insurance
- −$71
- HOA
- −$0
- Vacancy / Maint / Mgmt
- −$386
- Net cashflow
- $439
Break-even live
UW: 25.0% down · 7.5% · 30yr · 1.5% tax · 5.0% vac · 8.0% maint · 8.0% mgmt
Financing live
Cash to close
- Down payment
- $42,500
- Closing costs
- $5,100
- Reserves months
- —
- Total cash needed
- —
Loan-product check · same deal, 3 products live
Conventional
25% down · 7.5% · 30yr
- Down + closing
- —
- Monthly P&I
- —
- Monthly cashflow
- —
- DSCR
- —
- Eligible?
- —
Personal DTI + credit; lowest rate.
DSCR
20% down · 8.5% · 30yr
- Down + closing
- —
- Monthly P&I
- —
- Monthly cashflow
- —
- DSCR
- —
- Eligible?
- —
No personal income docs; deal must DSCR.
Hard money
10% down · 12.0% · 12mo
- Down + closing
- —
- Monthly P&I
- —
- Monthly cashflow
- —
- DSCR
- —
- Eligible?
- —
Short-term bridge; refi at stabilization.
Rent comps 8 comps
| Address | Beds | Baths | Sqft | Rent | $/sqft | DOM | Units | Dist |
|---|---|---|---|---|---|---|---|---|
| 3678 E Andrea Dr Kingman, AZ | 4.0 | 3.0 | 2042 | $1,850 | $0.91 | 43d | 1 | 0.19mi |
| 3665 E Koval Dr Kingman, AZ | 3.0 | 2.0 | 1400 | $1,665 | $1.19 | 13d | 1 | 0.36mi |
| 3597 E Koval Dr Kingman, AZ | 4.0 | 3.0 | 1811 | $2,200 | $1.21 | 43d | 1 | 0.42mi |
| 3858 E Ames Ave Kingman, AZ | 3.0 | 2.0 | 1631 | $1,550 | $0.95 | 43d | 1 | 0.51mi |
| 4786 E Old West Rd Kingman, AZ | 3.0 | 2.0 | 1513 | $1,700 | $1.12 | 21d | 1 | 0.76mi |
| 3356 E El Tovar Ave Kingman, AZ | 3.0 | 2.0 | 1356 | $1,975 | $1.46 | 43d | 1 | 0.86mi |
| 4839 E Blackhawk Dr Kingman, AZ | 3.0 | 2.0 | 1500 | $1,748 | $1.17 | 13d | 1 | 0.88mi |
| 4263 E Medicine Bend Rd Kingman, AZ | 3.0 | 2.0 | 1482 | $1,800 | $1.21 | 43d | 1 | 1.19mi |
Listing history 22 events
-
2026-06-18days on market $170,000 Active 66 DOM
-
2026-06-17days on market $170,000 Active 65 DOM
-
2026-06-16days on market $170,000 Active 64 DOM
-
2026-06-15days on market $170,000 Active 63 DOM
-
2026-06-14days on market $170,000 Active 61 DOM
-
2026-06-13days on market $170,000 Active 60 DOM
-
2026-06-10days on market $170,000 Active 58 DOM
-
2026-06-09days on market $170,000 Active 57 DOM
-
2026-06-08days on market $170,000 Active 56 DOM
-
2026-06-07days on market $170,000 Active 55 DOM
-
2026-06-05days on market $170,000 Active 52 DOM
-
2026-06-03days on market $170,000 Active 51 DOM
-
2026-06-02days on market $170,000 Active 50 DOM
-
2026-06-01days on market $170,000 Active 49 DOM
-
2026-05-31days on market $170,000 Active 48 DOM
-
2026-05-30days on market $170,000 Active 47 DOM
-
2026-04-13$170,000 Active 649-char remark
Show marketing remark (649 chars)
Fixer-Upper Opportunity on a Double Lot in Kingman! This 3-bedroom, 2-bath, two-story home is full of potential and ready for your personal touch. Inside, you'll find a spacious layout with a living room, separate den, and formal dining area - offering plenty of room for family or entertaining. Outside, the home sits on a double lot with a large fully-fenced yard, providing tons of space for pets, play, or future improvements. A huge carport and attached workshop add even more value for hobbyists or extra storage. Whether you're an investor or a buyer looking to build sweat equity, this property is a great opportunity you won't want to miss!
-
2025-07-30$180,000 Active
-
2021-12-03soldstatus $55,000
-
2009-04-28soldstatus $73,500
-
1997-09-29soldstatus $78,000
-
1993-12-15soldstatus $59,900
ⓘ Source: listings_history table (triggers on properties + properties_extension) + one-shot
backfill from property_details.listing_events for pre-trigger history.
Tax reassessment forecast AZ · Resets to sale price
- Current annual tax
- $590 · $49/mo
- Projected year-2 tax
- $1,122 · $94/mo
- Expected delta
- +$532/yr (+$44/mo · 90.0%)
ⓘ Screening estimate from a state-policy table — verify with the county assessor before closing.
Climate risk First Street
- Flood 1/10 Low FEMA zone X (unshaded) · 0% chance over 30 yrs
- Wildfire 6/10 Major
- Heat 6/10 Major 5 d/yr ≥100°F today · 13 d/yr by 30 yrs out
- Wind 1/10 Low
- Air quality 1/10 Low 0 unhealthy d/yr today · 0 by 30 yrs out
Nearby sold comps map
Loading sold comps map…
Walkable amenities ~0.75 mi
Loading nearby amenities…
Taxation est. · year 1
- Rental income
- $22,031
- − Mortgage interest
- −$9,523
- − Property taxes
- −$590
- − Insurance
- −$850
- − Repairs & maintenance
- −$1,762
- − Management
- −$1,762
- − Depreciation
- −$4,945
- Taxable income
- $2,598
- Est. tax owed @ 24.0%
- −$623
- After-tax cash flow
- $4,643/yr
For passive investors: Depreciation is non-cash, so a rental often shows a tax loss while cash-flowing — sheltering income. Rental losses are passive: they offset passive income freely, and up to $25,000/yr can offset ordinary (W-2) income if you actively participate and your MAGI is under $100k (phasing out to $0 by $150k); unused losses carry forward. On sale, claimed depreciation is recaptured at up to 25%, and gains may owe capital-gains tax (a 1031 exchange can defer both). Figures are a year-1 estimate at your 24.0% rate — not tax advice; consult a CPA.
Schools (NCES district)
- District
- Kingman Unified School District (79598)
- NCES district ID
- 0400295
- Math proficiency
- 19% ▼ -11.00%
- Reading proficiency
- 24% ▼ -9.00%
- Median HH income
- $36,760
- Composite
- 17.87/100
- National rank
- #9002
- State rank
- #179 of 249 in AZ
Livability — New Kingman-Butler
No livability data for this city. (Only ~50 U.S. cities are tracked.)
Census & demographics
- Census place
- New Kingman-Butler, AZ
- County
- Mohave County · 181,906 people
- Metro
- Lake Havasu City-Kingman, AZ
- Population (ZIP)
- 30,365
- Household income
- $50,852
- Rent vs Own
- Severe rent burden
- 688.0
Population outlook (Mohave County) Hauer SSP2
- Today (2025)
- 209,184 people
- By 2030
- 209,674 · +0.2%
- By 2040
- 205,897 · -1.6%
- By 2050
- 196,810 · -5.9%
- By 2075
- 169,454 · -19.0%
- By 2100
- 136,630 · -34.7%
Race, ethnicity, and origin ACS 2023
- Neighborhood character
- Predominantly White (76%)
- Race & ethnicity
- White 76% Hispanic / Latino 16% Two or more races 10% Native American 1%
- Hispanic origin (detail)
- Mexican 12%
- Common ancestry
- Lithuanian 3% Slovak 2% Portuguese 2%
- Foreign-born
- 6% · Canada
- Languages at home
- 92% English-only · Spanish 7%
Political lean MEDSL · Mohave
- 2024 margin
- Solid R (+55.8) · D 21.8% · R 77.6%
- 2008→2024 swing
- -22.9pp toward R · 2008: -32.9pp · 2024: -55.8pp
- All cycles
- 2024: R+55.8 2020: R+51.3 2016: R+51.5 2012: R+42.6 2008: R+32.9
Not yet ingested
- Civics
- —
Market trends
- HPI YoY
- ▼ -158.90%
- Current HPI
- 280.1884
- Rent YoY
- ▲ 0.33%
- Metro
- Lake Havasu City-Kingman, AZ
- State GDP YoY
- ▲ 4.54%
- F500 in state
- 20
Industry mix (Fortune 500 HQ in AZ)
| Industry | F500 HQs | Revenue |
|---|---|---|
| Technology | 2 | $13B |
|
||
| Mining / Metals | 1 | $23B |
|
||
| Environmental Services | 1 | $16B |
|
||
| Metals / Steel | 1 | $14B |
|
||
| Technology Distribution | 1 | $9B |
|
||
| Homebuilding | 1 | $8B |
|
||
Price history
+183.8% since first listed6 events — show timeline
- 2026-04-13 Listed $170,000 WARDEX
- 2025-07-30 Listed $180,000 WARDEX
- 2021-12-03 Sold (Public Records) $55,000 Public Records
- 2009-04-28 Sold (Public Records) $73,500 Public Records
- 1997-09-29 Sold (Public Records) $78,000 Public Records
- 1993-12-15 Sold (Public Records) $59,900 Public Records
Property tax history
+4.0%/yrLatest (2025): $590 · +1.6% YoY. Source: county tax records.
Cash-flow waterfall
monthlySold comps — $/sqft
last 12 mo · ≤1 miLoading sold comps…