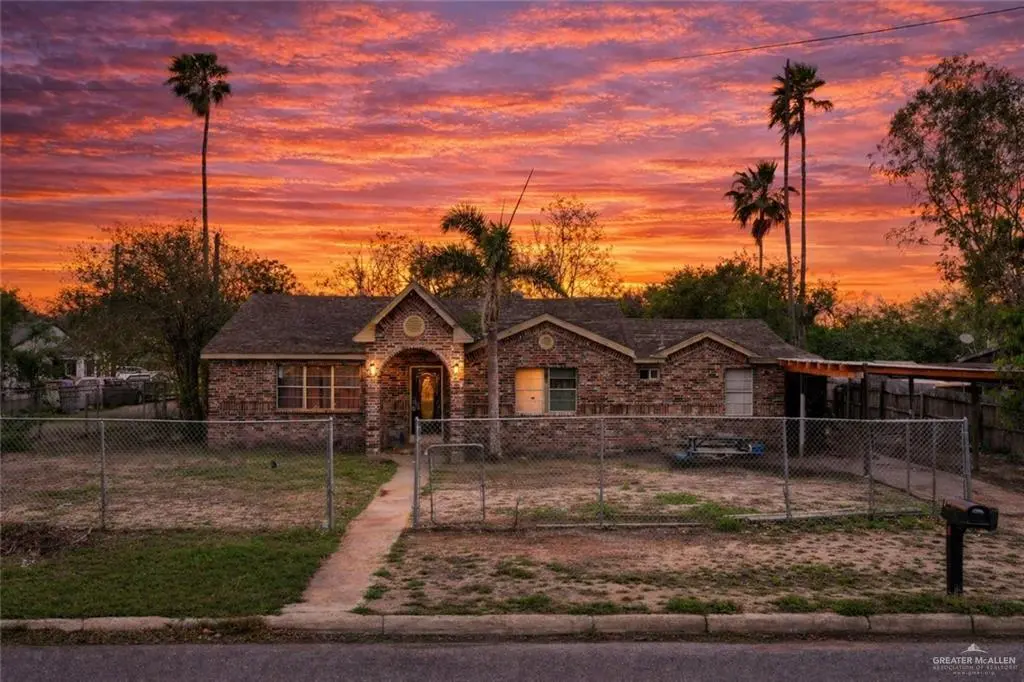
604 W Caffery Ave · Pharr, TX
Flood risk 1/10 · Minimal
- FEMA flood zone
- X (shaded)
- Chance of flooding over 30 yrs
- 0.0%
- Est. flood insurance / yr
- $507 – $1,088
Fire risk 1/10 · Minimal
- Est. fire insurance / yr
- $1,222 – $2,270
Heat risk 9/10 · Severe
- Hot days now (above 111°F)
- 7 days/yr
- Hot days in 30 yrs
- 22 days/yr
Wind risk 8/10 · Major
- Chance of severe wind over 30 yrs
- 99.0%
Air-quality risk 3/10 · Minor
- Unhealthy air days now
- 1 days/yr
- Unhealthy air days in 30 yrs
- 4 days/yr
Risk factors via First Street. Map © Google.
Why this score? — see what drove the B+ grade
The composite is a weighted blend of 9 inputs, each scored 0–100. Each bar is that input's sub-score; the figure is the points it added to the 100-point composite (weight × sub-score).
- Cash flow +30.0/30.0
- ARV discount +15.0/15.0
- DSCR +10.0/10.0
- 1% rule +9.9/10.0
- Livability +3.6/5.0
- Condition / age +2.5/5.0
- Rent growth +2.4/5.0
- Schools +2.0/10.0
- Appreciation +0.0/10.0
$120,000
🖨 Deal sheet (PDF) 📄 Offer letter ✓ Due diligence
Listing remarks
Charming and well-located property at 604 W Caffery Avenue in Pharr, offering a great opportunity for homeowners or investors alike. This residence features a functional layout designed for comfortable everyday living, with ample natural light and well-proportioned living spaces. Situated on a generously sized lot, the property provides plenty of outdoor space with potential for expansion, entertaining, or future improvements. Conveniently located near schools, shopping, dining, and with quick access to major roadways, this home combines accessibility with neighborhood charm. A solid opportunity in a growing area—schedule your private showing today!
Key facts
- Ample natural light
- Generously sized lot
- Quick access
Tags
Property features AI
Finance
- HOA & community: No association
Exterior
- Parking: 1 total parking space; Covered parking; 1-car carport; Garage faces front (no garage spaces)
- Utilities: Public water
- Home design: Brick construction; Composition shingle roof; Crawl space foundation with pillar/post/pier supports; Does not include owned lot
- Construction: Brick exterior
- Exterior features: Chain link fencing; Corner lot; Paved road access
Interior
- Kitchen: Electric water heater; No conveying appliances
- Flooring: Granite flooring
- Bathrooms: 4 full bathrooms
- Heating & cooling: Central heating (electric); Central air conditioning (electric)
- Interior features: Granite countertops; Walk-in closet(s); No window coverings
Neighborhood map
What this means for you Summary
Snapshot
- This is a 3-bed/2.0-bath single-family listed at $120k.
Deal economics
- At list price, monthly cash flow is $480 ($6k/yr) — positive.
- The deal already cash-flows at list — no discount required.
- Meets the 1% rule at list price ($2k rent vs $120k).
- Recommended offer: $116k (3.0% below list) — sets the bar for market timing.
- Cap rate 11.1% vs local median 3.4% in Pharr — top-decile yield for the area; either an underpriced asset or a hidden risk that comps aren't pricing in. Stress-test before assuming the spread holds.
Location & tenants
- Location reads 72/100 on livability (#245 in TX) — a middle-class / working-renter tenant base. Strengths: cost of living A+, housing A+, health & safety A+; Watch: schools D, amenities F, commute F.
- Pharr-San Juan-Alamo ISD (suburban): math 18% / reading 30% proficiency, ranked #740 of 826 in TX (top 90%) — low school quality limits family demand, transient renter base, plan for 1-2y turnover; 72% free/reduced lunch — lower-income household profile, screen leases tightly.
- Market conditions: Rents soft (-0.2%/yr); 451 active listings in the ZIP; 10 comparable units currently listed for rent nearby; rentals lingering (median 45d on market — plan ~5-8 weeks vacancy on turnover, expect pricing pressure); 60% of comp listings sitting > 30 days — soft ceiling on asking rent; 7,378 units permitted in Hidalgo County in 2024 (641 in 5+ unit buildings).
- This rent runs 41% of the median local income ($53k/yr) — at the standard rent-burdened threshold; future hikes will face affordability resistance.
Forward outlook
- Local home prices are declining (-3.0%/yr); year-one equity from $830 of loan paydown is wiped out by about $4k of value loss. Plan a longer hold.
- Hidalgo County population projected at +28% by 2050 — long-run rental-demand tailwind backs the buy-and-hold thesis.
- At projected returns (-3.0% appreciation + 0.0% rent growth), your $34k cash investment doubles in ~10 years — after that, you're playing with house money.
Negotiation context
- It's been on market 48 days — a 3% lower offer ($116k) is reasonable based on typical stale-listing flexibility.
- 4 sale attempts since 8y ago; this cycle's ask has dropped $19k (14%) from the opening price — seller is motivated, your offer sets the floor, not the list.
Risks & watch-outs
- Climate carrying-cost: severe wind risk, 99% chance of damaging wind over 30y; extreme-heat days projected 7→22/yr by 2055 (HVAC capex compounding) — expect insurance premiums to compound above CPI over the hold.
Questions for the listing agent
- It's been on market 48 days. Have you received any prior offers? Is the seller open to a 3% concession, seller financing, or rate buy-down credit?
- Is there a deadline driving the sale (1031 exchange, divorce, estate, relocation)? That informs how much negotiation room exists.
- Schools are D-rated, which usually means shorter tenancies and higher turnover. Who's the typical renter profile here, and what's been the actual vacancy rate?
- What's the average days-on-market for RENTAL listings here right now (not sales)? A rising rental-DOM trend means longer vacancies and softer asking-rent achievability than the comps imply.
- What's the recent tenant-quality profile in this submarket — average credit score on applications, eviction rate, late-payment / NSF rate, and stable-employment percentage? A property-management company in the area should have these aggregated.
- How much new for-sale + rental construction is in the pipeline within 1–3 miles? Heavy new supply typically softens prices + rents 12–24 months out; constrained supply supports both.
Investment metrics
- 1% rule
- 1.49% ✓
- Cap rate
- 11.09%
- Cash-on-cash
- 17.15%
- DSCR
- 1.76
- GRM
- 5.6
CMA / ARV
- ARV (median comp)
- $193,161
- List price
- $120,000
- Delta
- -37.88%
- Verdict
- UNDERPRICED
- Comps
- 20 within 1.0 mi
Show comp detail 5 sales within ~0.75 mi
| Address | Dist | Beds/Ba | Sqft | Sold | Price | $/sf | Match |
|---|---|---|---|---|---|---|---|
| 610 W Gore Ave | 0.21mi | 3/2.0 | 1,790 (-6%) | 20mo | $165,000 | $92 | 64 |
| 117 W Hawk Ave | 0.45mi | 4/3.0 (+1) | 1,842 (-3%) | 2mo | $215,000 | $117 | 64 |
| 307 W Boone Ave | 0.41mi | 3/2.0 | 2,065 (+9%) | 10mo | $205,000 | $99 | 58 |
| 309 E Jones Ave | 0.68mi | 3/3.0 | 1,856 (-2%) | 10mo | $95,000 | $51 | 52 |
| 401 E Gore Ave | 0.73mi | 3/2.0 | 1,738 (-8%) | 6mo | $138,000 | $79 | 47 |
Match score weights: distance 35% · size 25% · config 20% · recency 20%. Top-matched comps best support the ARV.
Projected returns pro-forma
-3.0% appreciation · 0.0% rent growth · sell at horizon
- IRR
- 4.8%
- Equity multiple
- 1.18×
- Total profit
- $5,999
- Equity at exit
- $17,892
- IRR
- 11.0%
- Equity multiple
- 1.74×
- Total profit
- $24,771
- Equity at exit
- $10,375
Cash invested: $33,600 (down + closing). Projections, not guarantees.
Landlord ↔ Tenant lean methodology
- Overall (STATE)
- 87 Strongly Landlord-Friendly
- State Texas
- 87 Strongly Landlord-Friendly · R+5
- County
- — inherits STATE
- City
- — inherits STATE
ZIP-level market 78577
- Home prices YoY
- -8.1%
- Rents YoY
- -0.2%
- Active inventory
- 451
- Price-to-rent
- 5.6×
Monthly cashflow live
- Estimated rent
- $1,782 high interval (Pro) →
- Mortgage (P&I)
- −$629
- Tax from tax record
- −$248 /mo · $2,981/yr
- Insurance
- −$50
- HOA
- −$0
- Vacancy / Maint / Mgmt
- −$374
- Net cashflow
- $480
Break-even live
Sensitivity live
| Price | -10% $548 | -5% $514 | +0% $480 | +5% $446 | +10% $412 |
|---|---|---|---|---|---|
| Rent | -10% $339 | -5% $410 | +0% $480 | +5% $551 | +10% $621 |
| Rate | -1.0pp $541 | -0.5pp $511 | base $480 | +0.5pp $449 | +1.0pp $417 |
UW: 25.0% down · 7.5% · 30yr · 1.5% tax · 5.0% vac · 8.0% maint · 8.0% mgmt
Financing live
Cash to close
- Down payment
- $30,000
- Closing costs
- $3,600
- Reserves months
- —
- Total cash needed
- —
Loan-product check · same deal, 3 products live
Conventional
25% down · 7.5% · 30yr
- Down + closing
- —
- Monthly P&I
- —
- Monthly cashflow
- —
- DSCR
- —
- Eligible?
- —
Personal DTI + credit; lowest rate.
DSCR
20% down · 8.5% · 30yr
- Down + closing
- —
- Monthly P&I
- —
- Monthly cashflow
- —
- DSCR
- —
- Eligible?
- —
No personal income docs; deal must DSCR.
Hard money
10% down · 12.0% · 12mo
- Down + closing
- —
- Monthly P&I
- —
- Monthly cashflow
- —
- DSCR
- —
- Eligible?
- —
Short-term bridge; refi at stabilization.
Rent comps 10 comps
| Address | Beds | Baths | Sqft | Rent | $/sqft | DOM | Units | Dist |
|---|---|---|---|---|---|---|---|---|
| 302 W Sam Houston Blvd Pharr, TX | 3.0 | 2.0 | 2037 | $2,100 | $1.03 | 24d | 1 | 0.41mi |
| 1000 S Flag St Pharr, TX | 4.0 | 3.0 | 2215 | $2,275 | $1.03 | 15d | 1 | 0.52mi |
| 1000 S Flag St Pharr, TX | 4.0 | 3.0 | 2215 | $2,350 | $1.06 | 44d | 1 | 0.52mi |
| 134 W Daffodil Ave Pharr, TX | 3.0 | 2.0 | 1684 | $1,500 | $0.89 | 24d | 1 | 0.65mi |
| 907 S Diplomat Dr Pharr, TX | 3.0 | 2.0 | 1350 | $1,750 | $1.30 | 44d | 1 | 0.75mi |
| 518 E Kelly Ave Pharr, TX | 2.0 | 2.0 | 1482 | $1,300 | $0.88 | 44d | 1 | 0.84mi |
| 900 E Dallas Ave #17 McAllen, TX | 2.0 | 2.0 | 1367 | $1,450 | $1.06 | 44d | 1 | 1.27mi |
| 900 E Dallas Ave Unit UT3 McAllen, TX | 3.0 | 2.0 | 1371 | $1,550 | $1.13 | 15d | 1 | 1.27mi |
| 901 E Dallas Ave #16 McAllen, TX | 3.0 | 3.0 | 1940 | $1,500 | $0.77 | 44d | 1 | 1.30mi |
| 1506 S Bilboa St Unit 1 Pharr, TX | 3.0 | 2.5 | 1500 | $1,600 | $1.07 | 44d | 1 | 1.30mi |
Listing history 26 events
-
2026-06-18days on market $120,000 Active 48 DOM
-
2026-06-17days on market $120,000 Active 47 DOM
-
2026-06-16days on market $120,000 Active 46 DOM
-
2026-06-15days on market $120,000 Active 45 DOM
-
2026-06-14days on market $120,000 Active 43 DOM
-
2026-06-13days on market $120,000 Active 42 DOM
-
2026-06-10days on market $120,000 Active 40 DOM
-
2026-06-09days on market $120,000 Active 39 DOM
-
2026-06-08days on market $120,000 Active 38 DOM
-
2026-06-07pricedays on market $120,000 Active 37 DOM
-
2026-06-03days on market $129,500 Active 33 DOM
-
2026-06-02days on market $129,500 Active 32 DOM
-
2026-06-01days on market $129,500 Active 31 DOM
-
2026-05-31days on market $129,500 Active 30 DOM
-
2026-05-31days on market $129,500 Active 29 DOM
-
2026-05-15price $129,500 663-char remark
-
2026-05-01$139,000 Active 663-char remark
-
2026-04-12$142,500 Active
-
2025-11-24soldstatus
-
2018-08-27historical Temporarily Off Market
-
2018-08-07status Active
-
2018-07-24historical Option
-
2018-05-01$80,000 Active
-
2016-01-12soldstatus
-
2005-01-06soldstatus
-
2005-01-06soldstatus
ⓘ Source: listings_history table (triggers on properties + properties_extension) + one-shot
backfill from property_details.listing_events for pre-trigger history.
Tax reassessment forecast TX · Resets to sale price
- Current annual tax
- $2,981 · $248/mo
- Projected year-2 tax
- $2,981 · $248/mo
- Expected delta
- $0/yr ($0/mo · 0.0%)
ⓘ Screening estimate from a state-policy table — verify with the county assessor before closing.
Climate risk First Street
- Flood 1/10 Low FEMA zone X (shaded) · 0% chance over 30 yrs
- Wildfire 1/10 Low
- Heat 9/10 Extreme 7 d/yr ≥111°F today · 22 d/yr by 30 yrs out
- Wind 8/10 Severe 99% chance of damaging wind over 30 yrs
- Air quality 3/10 Moderate 1 unhealthy d/yr today · 4 by 30 yrs out
Nearby sold comps map
Loading sold comps map…
Walkable amenities ~0.75 mi
Loading nearby amenities…
Taxation est. · year 1
- Rental income
- $21,384
- − Mortgage interest
- −$6,722
- − Property taxes
- −$2,981
- − Insurance
- −$600
- − Repairs & maintenance
- −$1,711
- − Management
- −$1,711
- − Depreciation
- −$3,491
- Taxable income
- $4,169
- Est. tax owed @ 24.0%
- −$1,001
- After-tax cash flow
- $4,761/yr
For passive investors: Depreciation is non-cash, so a rental often shows a tax loss while cash-flowing — sheltering income. Rental losses are passive: they offset passive income freely, and up to $25,000/yr can offset ordinary (W-2) income if you actively participate and your MAGI is under $100k (phasing out to $0 by $150k); unused losses carry forward. On sale, claimed depreciation is recaptured at up to 25%, and gains may owe capital-gains tax (a 1031 exchange can defer both). Figures are a year-1 estimate at your 24.0% rate — not tax advice; consult a CPA.
Schools (NCES district)
- District
- Pharr-San Juan-Alamo ISD
- NCES district ID
- 4834860
- Math proficiency
- 18% ▼ -34.00%
- Reading proficiency
- 30% ▼ -11.00%
- Median HH income
- $33,757
- Composite
- 19.63/100
- National rank
- #8744
- State rank
- #740 of 826 in TX
Livability — Pharr
- Score
- 72/100
- State rank
- #245
- US rank
- #5852
Category grades
Schools grade is shown separately in the Schools card above.
Census & demographics
- Census place
- Pharr, TX
- County
- Hidalgo County · 623,128 people
- City population
- 80,540
- Metro
- McAllen-Edinburg-Mission, TX
- Population (ZIP)
- 80,540
- Household income
- $52,770
- Rent vs Own
- Severe rent burden
- 2161.0
Population outlook (Hidalgo County) Hauer SSP2
- Today (2025)
- 955,232 people
- By 2030
- 1,009,774 · +5.7%
- By 2040
- 1,120,332 · +17.3%
- By 2050
- 1,225,036 · +28.2%
- By 2075
- 1,439,189 · +50.7%
- By 2100
- 1,533,429 · +60.5%
Race, ethnicity, and origin ACS 2023
- Neighborhood character
- Predominantly Hispanic (95%)
- Race & ethnicity
- Hispanic / Latino 95% Two or more races 45% White 5%
- Hispanic origin (detail)
- Mexican 92%
- Foreign-born
- 29% · Canada
- Languages at home
- 18% English-only · Spanish 81%
Political lean MEDSL · Hidalgo
- 2024 margin
- Toss-up / Even · D 48.1% · R 51.0%
- 2008→2024 swing
- -41.6pp toward R · 2008: 38.7pp · 2024: -2.9pp
- All cycles
- 2024: R+2.9 2020: D+17.1 2016: D+40.5 2012: D+41.8 2008: D+38.7
Not yet ingested
- Civics
- —
Market trends
- HPI YoY
- ▼ -23.00%
- Current HPI
- 261.1606
- Rent YoY
- ▼ -0.24%
- Metro
- McAllen-Edinburg-Mission, TX
- State GDP YoY
- ▲ 3.95%
- F500 in state
- 110
Industry mix (Fortune 500 HQ in TX)
| Industry | F500 HQs | Revenue |
|---|---|---|
| Energy | 16 | $1,198B |
|
||
| Technology | 5 | $198B |
|
||
| Engineering / Construction | 4 | $72B |
|
||
| Energy Services | 3 | $60B |
|
||
| Utilities | 3 | $41B |
|
||
| Healthcare | 2 | $330B |
|
||
Price history
+50.0% since first listed12 events — show timeline
- 2026-06-05 Price Changed $120,000 MCALLENMLS
- 2026-05-15 Price Changed $129,500 MCALLENMLS
- 2026-05-01 Listed $139,000 MCALLENMLS
- 2026-04-12 Listed $142,500 MCALLENMLS
- 2025-11-24 Sold (Public Records) — Public Records
- 2018-08-27 Delisted — MCALLENMLS
- 2018-08-07 Relisted — MCALLENMLS
- 2018-07-24 Contingent — MCALLENMLS
- 2018-05-01 Listed $80,000 MCALLENMLS
- 2016-01-12 Sold (Public Records) — Public Records
- 2005-01-06 Sold (Public Records) — Public Records
- 2005-01-06 Sold (Public Records) — Public Records
Property tax history
+5.5%/yrLatest (2025): $2,981 · +13.3% YoY. Source: county tax records.
Cash-flow waterfall
monthlySold comps — $/sqft
last 12 mo · ≤1 miLoading sold comps…