10464 E 54 Hwy · Roscoe, MO
Flood risk 1/10 · Minimal
- FEMA flood zone
- X (unshaded)
- Chance of flooding over 30 yrs
- 0.0%
- Est. flood insurance / yr
- $473 – $860
Fire risk 4/10 · Minor
- Est. fire insurance / yr
- $1,054 – $1,958
Heat risk 4/10 · Minor
- Hot days now (above 109°F)
- 7 days/yr
- Hot days in 30 yrs
- 18 days/yr
Wind risk 2/10 · Minimal
- Chance of severe wind over 30 yrs
- 1.0%
Air-quality risk 2/10 · Minimal
- Unhealthy air days now
- 1 days/yr
- Unhealthy air days in 30 yrs
- 1 days/yr
Risk factors via First Street. Map © Google.
Why this score? — see what drove the D grade
The composite is a weighted blend of 9 inputs, each scored 0–100. Each bar is that input's sub-score; the figure is the points it added to the 100-point composite (weight × sub-score).
- ARV discount +15.0/15.0
- Appreciation +10.0/10.0
- Cash flow +4.6/30.0
- Livability +3.0/5.0
- Rent growth +2.5/5.0
- Condition / age +2.5/5.0
- Schools +2.4/10.0
- 1% rule +0.6/10.0
- DSCR +0.0/10.0
$229,300
🖨 Deal sheet (PDF) 📄 Offer letter ✓ Due diligence
Listing remarks MLS
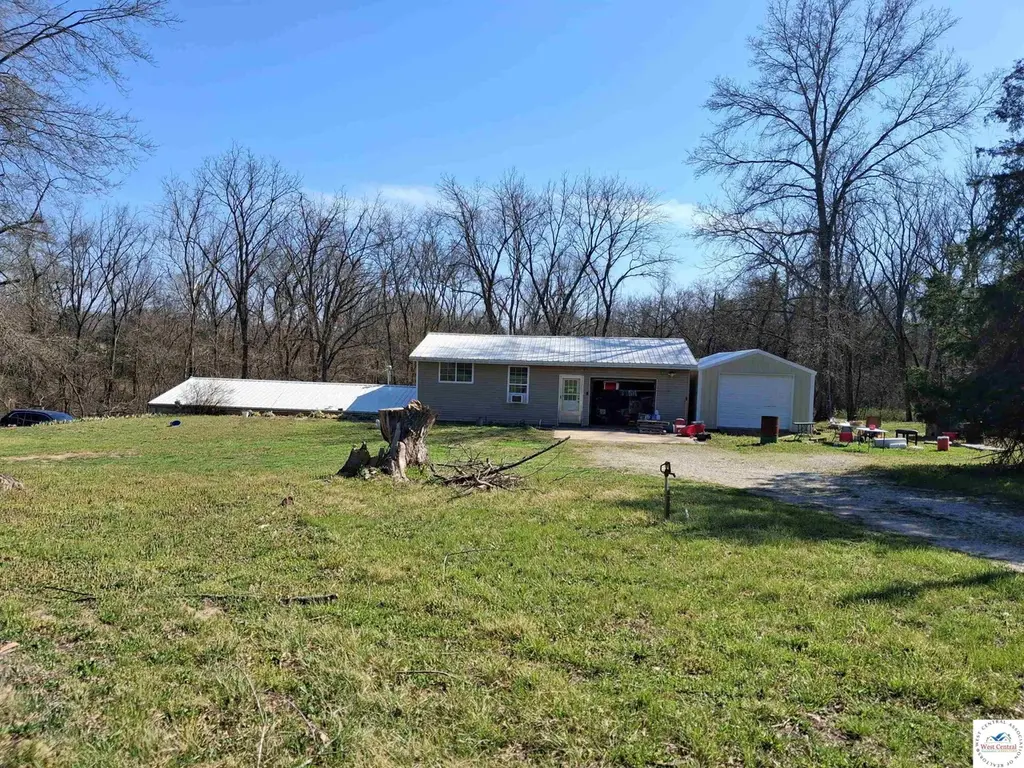
This Earth Contact house on 12 acres is very well built and huge! on top of Basement house another 1/2 house on upper level. plus additional 2 huge garages on concrete floor and 1 garage is spray foam insulated also a storage shed too! Turkey and deer are plentiful! finished concrete floor on main level.
Key facts
- Earth contact house
- Storage shed
- Huge garages
Tags
Neighborhood map
What this means for you Summary
Snapshot
- This is a 3-bed/2.5-bath single-family listed at $229k.
Deal economics
- At list price, monthly cash flow is $-576 ($-7k/yr) — negative.
- To cash-flow at today's rent, offer at most $146k (36.4% below list).
- To meet the 1% rule (rent ≥ 1% of price), the offer needs to be $128k (44.3% below list).
- Recommended offer: $128k (44.3% below list) — sets the bar for 1% rule.
Location & tenants
- Location reads 60/100 on livability (#470 in MO) — a middle-class / working-renter tenant base. Strengths: cost of living A+, housing A+; Watch: employment C-, crime F, amenities F.
- El Dorado Springs R-II (town): math 25% / reading 34% proficiency, ranked #279 of 324 in MO (top 86%) — low school quality limits family demand, transient renter base, plan for 1-2y turnover.
- Zoned schools: El Dorado Springs Elem. (math 26% / reading 34%, grade F, #808 of 1,115 statewide, top 73%, 580 students, 100% FRL); El Dorado Springs Middle (math 28% / reading 31%, grade F, #291 of 391 statewide, top 76%, 244 students, 51% FRL); El Dorado Springs High (math 12% / reading 47%, grade F, #382 of 521 statewide, top 78%, 348 students, 40% FRL).
- Market conditions: 84 active listings in the ZIP; 4 units permitted in Cedar County in 2024 (0 in 5+ unit buildings).
Forward outlook
- In year one you build about $25k of equity ($2k loan paydown + $23k appreciation (10.0% local appreciation)).
- Cedar County population projected at -12% by 2050 — secular population decline; favor cash flow + early exit over multi-decade hold.
- By year 2, paydown + projected appreciation supports a ~$39k cash-out refi (75% LTV) — recoverable capital for the next deal without selling this one.
Negotiation context
- It's been on market 79 days — a 6% lower offer ($216k) is reasonable based on typical stale-listing flexibility.
Questions for the listing agent
- What do current leases actually rent for vs. the listed asking? Can we see a recent rent roll and the last 12 months of T-12 income?
- It's been on market 79 days. Have you received any prior offers? Is the seller open to a 44% concession, seller financing, or rate buy-down credit?
- Why hasn't it sold? Are there any deal-killer items the seller is aware of (foundation, flood, title, zoning, code violations)?
- Is there a deadline driving the sale (1031 exchange, divorce, estate, relocation)? That informs how much negotiation room exists.
- Schools are F-rated, which usually means shorter tenancies and higher turnover. Who's the typical renter profile here, and what's been the actual vacancy rate?
- Crime grade is F in this area — have there been break-ins, vandalism, or insurance claims at this property in the last 3 years? What carrier currently insures it and at what premium?
- The area grade is low — what's the realistic commute time and amenity access for the typical tenant pool here? Any planned neighborhood developments (good or bad) we should know about?
- What's the average days-on-market for RENTAL listings here right now (not sales)? A rising rental-DOM trend means longer vacancies and softer asking-rent achievability than the comps imply.
- What's the recent tenant-quality profile in this submarket — average credit score on applications, eviction rate, late-payment / NSF rate, and stable-employment percentage? A property-management company in the area should have these aggregated.
- How much new for-sale + rental construction is in the pipeline within 1–3 miles? Heavy new supply typically softens prices + rents 12–24 months out; constrained supply supports both.
Investment metrics
- 1% rule
- 0.56% ✗
- Cap rate
- 3.28%
- Cash-on-cash
- -10.77%
- DSCR
- 0.52
- GRM
- 15.0
CMA / ARV
- ARV (median comp)
- $405,108
- List price
- $229,300
- Delta
- -43.40%
- Verdict
- UNDERPRICED
- Comps
- 1 within 2.0 mi
Projected returns pro-forma
10.0% appreciation · 3.0% rent growth · sell at horizon
- IRR
- 16.7%
- Equity multiple
- 2.37×
- Total profit
- $88,194
- Equity at exit
- $206,572
- IRR
- 15.9%
- Equity multiple
- 5.50×
- Total profit
- $288,623
- Equity at exit
- $445,479
Cash invested: $64,204 (down + closing). Projections, not guarantees.
Landlord ↔ Tenant lean methodology
- Overall (STATE)
- 81 Strongly Landlord-Friendly
- State Missouri
- 81 Strongly Landlord-Friendly · R+10
- County
- — inherits STATE
- City
- — inherits STATE
ZIP-level market 64744
- Home prices YoY
- 5.2%
- Active inventory
- 84
- Price-to-rent
- 15.0×
Monthly cashflow live
- Estimated rent
- $1,276 medium interval (Pro) →
- Mortgage (P&I)
- −$1,202
- Tax est. 1.5%
- −$287 /mo · $3,440/yr
- Insurance
- −$96
- HOA
- −$0
- Vacancy / Maint / Mgmt
- −$268
- Net cashflow
- $-576
Break-even live
Sensitivity live
| Price | -10% $-418 | -5% $-497 | +0% $-576 | +5% $-656 | +10% $-735 |
|---|---|---|---|---|---|
| Rent | -10% $-677 | -5% $-627 | +0% $-576 | +5% $-526 | +10% $-476 |
| Rate | -1.0pp $-461 | -0.5pp $-518 | base $-576 | +0.5pp $-636 | +1.0pp $-696 |
UW: 25.0% down · 7.5% · 30yr · 1.5% tax · 5.0% vac · 8.0% maint · 8.0% mgmt
Financing live
Cash to close
- Down payment
- $57,325
- Closing costs
- $6,879
- Reserves months
- —
- Total cash needed
- —
Loan-product check · same deal, 3 products live
Conventional
25% down · 7.5% · 30yr
- Down + closing
- —
- Monthly P&I
- —
- Monthly cashflow
- —
- DSCR
- —
- Eligible?
- —
Personal DTI + credit; lowest rate.
DSCR
20% down · 8.5% · 30yr
- Down + closing
- —
- Monthly P&I
- —
- Monthly cashflow
- —
- DSCR
- —
- Eligible?
- —
No personal income docs; deal must DSCR.
Hard money
10% down · 12.0% · 12mo
- Down + closing
- —
- Monthly P&I
- —
- Monthly cashflow
- —
- DSCR
- —
- Eligible?
- —
Short-term bridge; refi at stabilization.
Listing history 17 events
-
2026-06-21days on market $229,300 Active 79 DOM
-
2026-06-21days on market $229,300 Active 78 DOM
-
2026-06-18days on market $229,300 Active 76 DOM
-
2026-06-17days on market $229,300 Active 75 DOM
-
2026-06-16days on market $229,300 Active 74 DOM
-
2026-06-15days on market $229,300 Active 73 DOM
-
2026-06-13days on market $229,300 Active 71 DOM
-
2026-06-12days on market $229,300 Active 70 DOM
-
2026-06-09days on market $229,300 Active 67 DOM
-
2026-06-08days on market $229,300 Active 66 DOM
-
2026-06-07days on market $229,300 Active 65 DOM
-
2026-06-07days on market $229,300 Active 64 DOM
-
2026-06-04pricedays on market $229,300 Active 61 DOM
-
2026-06-02days on market $240,000 Active 60 DOM
-
2026-06-01days on market $240,000 Active 59 DOM
-
2026-05-31days on market $240,000 Active 58 DOM
-
2026-03-30$240,000 Active 305-char remark
Show marketing remark (305 chars)
This Earth Contact house on 12 acres is very well built and huge! on top of Basement house another 1/2 house on upper level. plus additional 2 huge garages on concrete floor and 1 garage is spray foam insulated also a storage shed too! Turkey and deer are plentiful! finished concrete floor on main level.
ⓘ Source: listings_history table (triggers on properties + properties_extension) + one-shot
backfill from property_details.listing_events for pre-trigger history.
Climate risk First Street
- Flood 1/10 Low FEMA zone X (unshaded) · 0% chance over 30 yrs
- Wildfire 4/10 Moderate
- Heat 4/10 Moderate 7 d/yr ≥109°F today · 18 d/yr by 30 yrs out
- Wind 2/10 Low 100% chance of damaging wind over 30 yrs
- Air quality 2/10 Low 1 unhealthy d/yr today · 1 by 30 yrs out
Nearby sold comps map
Loading sold comps map…
Walkable amenities ~0.75 mi
Loading nearby amenities…
Taxation est. · year 1
- Rental income
- $15,316
- − Mortgage interest
- −$12,844
- − Property taxes
- −$3,440
- − Insurance
- −$1,146
- − Repairs & maintenance
- −$1,225
- − Management
- −$1,225
- − Depreciation
- −$6,671
- Taxable loss
- −$11,236
- Est. tax savings @ 24.0%
- +$2,697
- After-tax cash flow
- $-4,220/yr
For passive investors: Depreciation is non-cash, so a rental often shows a tax loss while cash-flowing — sheltering income. Rental losses are passive: they offset passive income freely, and up to $25,000/yr can offset ordinary (W-2) income if you actively participate and your MAGI is under $100k (phasing out to $0 by $150k); unused losses carry forward. On sale, claimed depreciation is recaptured at up to 25%, and gains may owe capital-gains tax (a 1031 exchange can defer both). Figures are a year-1 estimate at your 24.0% rate — not tax advice; consult a CPA.
Schools (NCES district)
- District
- El Dorado Springs R-II
- NCES district ID
- 2911310
- Math proficiency
- 25% ▼ -5.00%
- Reading proficiency
- 34% ▼ -5.00%
- Median HH income
- $31,880
- Composite
- 24.02/100
- National rank
- #7772
- State rank
- #279 of 324 in MO
Livability — Roscoe
- Score
- 60/100
- State rank
- #470
- US rank
- #18712
Category grades
Schools grade is shown separately in the Schools card above.
Census & demographics
- City population
- 92
- Population (ZIP)
- 8,547
Population outlook (Cedar County) Hauer SSP2
- Today (2025)
- 13,424 people
- By 2030
- 13,080 · -2.6%
- By 2040
- 12,434 · -7.4%
- By 2050
- 11,841 · -11.8%
- By 2075
- 10,171 · -24.2%
- By 2100
- 7,744 · -42.3%
Race, ethnicity, and origin ACS 2023
- Neighborhood character
- Predominantly White (95%)
- Race & ethnicity
- White 95% Two or more races 4%
- Common ancestry
- Italian 6% Iranian 3% Romanian 3%
- Foreign-born
- 1% · Canada
- Languages at home
- 94% English-only · German/W. Germanic 5% Spanish 1%
Political lean MEDSL · Cedar
- 2024 margin
- Solid R (+69.6) · D 14.8% · R 84.4%
- 2008→2024 swing
- -36.0pp toward R · 2008: -33.6pp · 2024: -69.6pp
- All cycles
- 2024: R+69.6 2020: R+65.9 2016: R+63.9 2012: R+47.0 2008: R+33.6
Not yet ingested
- Civics
- —
Market trends
- HPI YoY
- ▲ 11.88%
- Current HPI
- 242.0421
- Rent YoY
- —
- Metro
- —
- State GDP YoY
- ▲ 1.84%
- F500 in state
- 20
Industry mix (Fortune 500 HQ in MO)
| Industry | F500 HQs | Revenue |
|---|---|---|
| Healthcare | 1 | $163B |
|
||
| Insurance | 1 | $21B |
|
||
| Industrial Technology | 1 | $17B |
|
||
| Retail | 1 | $16B |
|
||
| Industrial Distribution | 1 | $10B |
|
||
| Utilities | 1 | $9B |
|
||
Price history
1 event — show timeline
- 2026-03-30 Listed $240,000 WCAR
Cash-flow waterfall
monthlySold comps — $/sqft
last 12 mo · ≤1 miLoading sold comps…