1122 S Pine Street St · Laurinburg, NC
Flood risk 3/10 · Minor
- FEMA flood zone
- X (unshaded)
- Chance of flooding over 30 yrs
- 0.2%
- Est. flood insurance / yr
- $507 – $1,088
Fire risk 4/10 · Minor
- Est. fire insurance / yr
- $906 – $1,684
Heat risk 7/10 · Major
- Hot days now (above 107°F)
- 7 days/yr
- Hot days in 30 yrs
- 16 days/yr
Wind risk 7/10 · Major
- Chance of severe wind over 30 yrs
- 78.0%
Air-quality risk 1/10 · Minimal
- Unhealthy air days now
- 0 days/yr
- Unhealthy air days in 30 yrs
- 0 days/yr
Risk factors via First Street. Map © Google.
Why this score? — see what drove the B+ grade
The composite is a weighted blend of 9 inputs, each scored 0–100. Each bar is that input's sub-score; the figure is the points it added to the 100-point composite (weight × sub-score).
- Cash flow +30.0/30.0
- ARV discount +15.0/15.0
- 1% rule +10.0/10.0
- DSCR +10.0/10.0
- Livability +2.8/5.0
- Rent growth +2.5/5.0
- Condition / age +2.5/5.0
- Schools +2.1/10.0
- Appreciation +0.5/10.0
$40,000
🖨 Deal sheet (PDF) 📄 Offer letter ✓ Due diligence
Listing remarks MLS
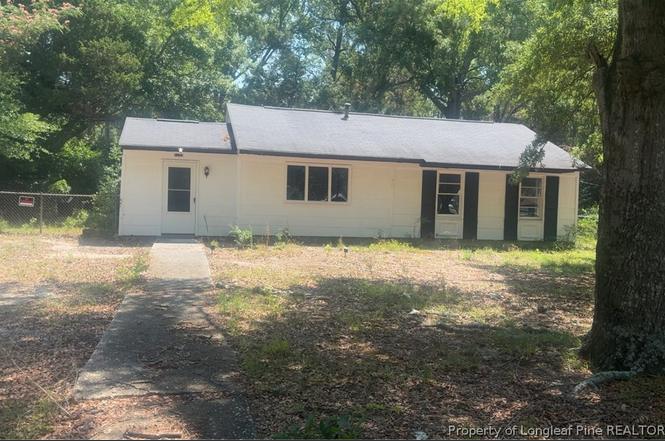
Great investment opportunity! This three-bedroom, one-bathroom ranch-style home sits on a spacious . 25-acre lot, featuring large, level front and back yards.
Key facts
- Spacious lot
- Built 1960
- Listed 3 days
Tags
Property features AI
Exterior
- Parking: No garage
- Utilities: Sewer not available; Water not available; No water source listed
- Home design: Single-family residence; One story
- Construction: Construction materials: Unknown
- Exterior features: Paved road access; Zoned R6 (Residential District)
Interior
- Flooring: Concrete
- Bathrooms: One full bathroom
- Heating & cooling: No heating
- Interior features: Concrete floors; No fireplace; Five total rooms; No basement
Neighborhood map
What this means for you Summary
Snapshot
- This is a 3-bed/1.0-bath single-family listed at $40k.
Deal economics
- At list price, monthly cash flow is $746 ($9k/yr) — positive.
- The deal already cash-flows at list — no discount required.
- Meets the 1% rule at list price ($1k rent vs $40k).
- Cap rate 28.7% vs local median 5.1% in Laurinburg — top-decile yield for the area; either an underpriced asset or a hidden risk that comps aren't pricing in. Stress-test before assuming the spread holds.
Location & tenants
- Location reads 56/100 on livability (#632 in NC) — a working-class tenant base; expect higher turnover. Strengths: cost of living A+, housing A-; Watch: health & safety C-, crime F, amenities F.
- Scotland County Schools (town): math 23% / reading 28% proficiency, ranked #160 of 178 in NC (top 90%) — low school quality limits family demand, transient renter base, plan for 1-2y turnover; 72% free/reduced lunch — lower-income household profile, screen leases tightly.
- Zoned schools: Sycamore Lane Elementary (math 12% / reading 21%, grade F, #1,307 of 1,410 statewide, top 93%, 357 students, 98% FRL); Carver Middle (math 17% / reading 26%, grade F, #422 of 475 statewide, top 89%, 659 students, 100% FRL); Scotland High School (math 45% / reading 44%, grade F, #352 of 535 statewide, top 68%, 1,445 students, 98% FRL) — zoned schools average 98% FRL vs 72% district-wide (26 pts higher); higher-poverty schools than district average — tighter screening recommended.
- Market conditions: 157 active listings in the ZIP; 70 units permitted in Scotland County in 2024 (0 in 5+ unit buildings).
Forward outlook
- Local home prices are declining (-3.0%/yr); year-one equity from $277 of loan paydown is wiped out by about $1k of value loss. Plan a longer hold.
- Scotland County population projected at -20% by 2050 — secular population decline; favor cash flow + early exit over multi-decade hold.
- At projected returns (-3.0% appreciation + 3.0% rent growth), your $11k cash investment doubles in ~2 years — after that, you're playing with house money.
Negotiation context
- Only 3 days on market — expect competitive offers; lowballing is unlikely to land.
- 2 sale attempts since 2y ago with the ask held roughly flat each time — persistent listings suggest the price (not the market) is what's stuck; bring a comps-based counter.
- Current owner paid $20k; list at $40k implies a 100% gain — meaningful room to come down on a strong offer.
Risks & watch-outs
- Climate carrying-cost: major wind risk, 78% chance of damaging wind over 30y; extreme-heat days projected 7→16/yr by 2055 (HVAC capex compounding) — expect insurance premiums to compound above CPI over the hold.
Questions for the listing agent
- Built in 1960 — when were the roof, HVAC, electrical panel, plumbing, and water heater last replaced?
- Is there a deadline driving the sale (1031 exchange, divorce, estate, relocation)? That informs how much negotiation room exists.
- Schools are F-rated, which usually means shorter tenancies and higher turnover. Who's the typical renter profile here, and what's been the actual vacancy rate?
- Crime grade is F in this area — have there been break-ins, vandalism, or insurance claims at this property in the last 3 years? What carrier currently insures it and at what premium?
- What's the average days-on-market for RENTAL listings here right now (not sales)? A rising rental-DOM trend means longer vacancies and softer asking-rent achievability than the comps imply.
- What's the recent tenant-quality profile in this submarket — average credit score on applications, eviction rate, late-payment / NSF rate, and stable-employment percentage? A property-management company in the area should have these aggregated.
- How much new for-sale + rental construction is in the pipeline within 1–3 miles? Heavy new supply typically softens prices + rents 12–24 months out; constrained supply supports both.
Investment metrics
- 1% rule
- 3.16% ✓
- Cap rate
- 28.66%
- Cash-on-cash
- 79.89%
- DSCR
- 4.55
- GRM
- 2.6
CMA / ARV
- ARV (on-the-fly)
- $78,440
- Comps found
- 12
Show comp detail 12 sales within ~0.75 mi
| Address | Dist | Beds/Ba | Sqft | Sold | Price | $/sf | Match |
|---|---|---|---|---|---|---|---|
| 1117 S Pine St | 0.03mi | 2/1.0 (-1) | 1,070 (+1%) | 7mo | $45,000 | $42 | 86 |
| 341 Roosevelt St | 0.21mi | 3/1.0 | 1,080 (+2%) | 9mo | $8,000 | $7 | 79 |
| 413 E Covington St | 0.48mi | 3/1.0 | 1,080 (+2%) | 4mo | $80,000 | $74 | 71 |
| 714 S Pine St | 0.34mi | 3/1.5 | 986 (-7%) | 2mo | $138,000 | $140 | 68 |
| 1111 Hammond Dr | 0.12mi | 3/1.0 | 960 (-9%) | 13mo | $68,000 | $71 | 68 |
| 1115 S Pine St | 0.04mi | 2/1.0 (-1) | 945 (-11%) | 12mo | $100,000 | $106 | 65 |
| 340 Douglas St | 0.19mi | 3/1.0 | 1,192 (+12%) | 8mo | $36,500 | $31 | 64 |
| 309 Midland Way | 0.42mi | 3/1.0 | 1,155 (+9%) | 7mo | $98,000 | $85 | 60 |
| 423 Midland Way | 0.52mi | 2/1.0 (-1) | 1,005 (-5%) | 4mo | $76,500 | $76 | 58 |
| 311 Wilson St | 0.26mi | 2/1.0 (-1) | 926 (-13%) | 4mo | $65,000 | $70 | 58 |
| 906 Biggs St | 0.25mi | 3/2.0 | 1,200 (+13%) | 9mo | $85,000 | $71 | 55 |
| 327 E Vance St | 0.36mi | 3/2.0 | 1,180 (+11%) | 11mo | $125,000 | $106 | 51 |
Match score weights: distance 35% · size 25% · config 20% · recency 20%. Top-matched comps best support the ARV.
Projected returns pro-forma
-3.0% appreciation · 3.0% rent growth · sell at horizon
- IRR
- 80.0%
- Equity multiple
- 4.66×
- Total profit
- $41,011
- Equity at exit
- $5,964
- IRR
- 83.5%
- Equity multiple
- 9.65×
- Total profit
- $96,878
- Equity at exit
- $3,458
Cash invested: $11,200 (down + closing). Projections, not guarantees.
Landlord ↔ Tenant lean methodology
- Overall (STATE)
- 85 Strongly Landlord-Friendly
- State North Carolina
- 85 Strongly Landlord-Friendly · R+3
- County
- — inherits STATE
- City
- — inherits STATE
ZIP-level market 28352
- Home prices YoY
- -3.4%
- Active inventory
- 157
- Price-to-rent
- 2.6×
Monthly cashflow live
- Estimated rent
- $1,262 medium interval (Pro) →
- Mortgage (P&I)
- −$210
- Tax from tax record
- −$25 /mo · $304/yr
- Insurance
- −$17
- HOA
- −$0
- Vacancy / Maint / Mgmt
- −$265
- Net cashflow
- $746
Break-even live
Sensitivity live
| Price | -10% $768 | -5% $757 | +0% $746 | +5% $734 | +10% $723 |
|---|---|---|---|---|---|
| Rent | -10% $646 | -5% $696 | +0% $746 | +5% $795 | +10% $845 |
| Rate | -1.0pp $766 | -0.5pp $756 | base $746 | +0.5pp $735 | +1.0pp $725 |
UW: 25.0% down · 7.5% · 30yr · 1.5% tax · 5.0% vac · 8.0% maint · 8.0% mgmt
Financing live
Cash to close
- Down payment
- $10,000
- Closing costs
- $1,200
- Reserves months
- —
- Total cash needed
- —
Loan-product check · same deal, 3 products live
Conventional
25% down · 7.5% · 30yr
- Down + closing
- —
- Monthly P&I
- —
- Monthly cashflow
- —
- DSCR
- —
- Eligible?
- —
Personal DTI + credit; lowest rate.
DSCR
20% down · 8.5% · 30yr
- Down + closing
- —
- Monthly P&I
- —
- Monthly cashflow
- —
- DSCR
- —
- Eligible?
- —
No personal income docs; deal must DSCR.
Hard money
10% down · 12.0% · 12mo
- Down + closing
- —
- Monthly P&I
- —
- Monthly cashflow
- —
- DSCR
- —
- Eligible?
- —
Short-term bridge; refi at stabilization.
Listing history 5 events
-
2026-06-19status $40,000 Pending 3 DOM
-
2026-06-18days on market $40,000 Active 3 DOM
-
2026-06-17days on market $40,000 Active 2 DOM
-
2026-06-15remarks 195-char remark
-
2026-06-15$40,000 Active 1 DOM
ⓘ Source: listings_history table (triggers on properties + properties_extension) + one-shot
backfill from property_details.listing_events for pre-trigger history.
Tax reassessment forecast NC · Resets to sale price
- Current annual tax
- $304 · $25/mo
- Projected year-2 tax
- $328 · $27/mo
- Expected delta
- +$24/yr (+$2/mo · 8.1%)
ⓘ Screening estimate from a state-policy table — verify with the county assessor before closing.
Climate risk First Street
- Flood 3/10 Moderate FEMA zone X (unshaded) · 20% chance over 30 yrs
- Wildfire 4/10 Moderate
- Heat 7/10 Severe 7 d/yr ≥107°F today · 16 d/yr by 30 yrs out
- Wind 7/10 Severe 78% chance of damaging wind over 30 yrs
- Air quality 1/10 Low 0 unhealthy d/yr today · 0 by 30 yrs out
Nearby sold comps map
Loading sold comps map…
Walkable amenities ~0.75 mi
Loading nearby amenities…
Taxation est. · year 1
- Rental income
- $15,150
- − Mortgage interest
- −$2,241
- − Property taxes
- −$304
- − Insurance
- −$200
- − Repairs & maintenance
- −$1,212
- − Management
- −$1,212
- − Depreciation
- −$1,164
- Taxable income
- $8,818
- Est. tax owed @ 24.0%
- −$2,116
- After-tax cash flow
- $6,831/yr
For passive investors: Depreciation is non-cash, so a rental often shows a tax loss while cash-flowing — sheltering income. Rental losses are passive: they offset passive income freely, and up to $25,000/yr can offset ordinary (W-2) income if you actively participate and your MAGI is under $100k (phasing out to $0 by $150k); unused losses carry forward. On sale, claimed depreciation is recaptured at up to 25%, and gains may owe capital-gains tax (a 1031 exchange can defer both). Figures are a year-1 estimate at your 24.0% rate — not tax advice; consult a CPA.
Schools (NCES district)
- District
- Scotland County Schools
- NCES district ID
- 3704200
- Math proficiency
- 23% ▼ -5.00%
- Reading proficiency
- 28% ▼ -3.00%
- Median HH income
- $31,203
- Composite
- 20.66/100
- National rank
- #8536
- State rank
- #160 of 178 in NC
Livability — Laurinburg
- Score
- 56/100
- State rank
- #632
- US rank
- #22962
Category grades
Schools grade is shown separately in the Schools card above.
Census & demographics
- Census place
- Laurinburg, NC
- City population
- 24,177
- Population (ZIP)
- 24,177
Population outlook (Scotland County) Hauer SSP2
- Today (2025)
- 33,331 people
- By 2030
- 32,017 · -3.9%
- By 2040
- 29,290 · -12.1%
- By 2050
- 26,554 · -20.3%
- By 2075
- 19,857 · -40.4%
- By 2100
- 13,851 · -58.4%
Race, ethnicity, and origin ACS 2023
- Neighborhood character
- Diverse neighborhood (Simpson 0.69)
- Race & ethnicity
- Black 42% White 37% Native American 11% Two or more races 6% Hispanic / Latino 4% Asian 1%
- Common ancestry
- Serbian 2% Slovak 1% Italian 1%
- Foreign-born
- 3% · Canada, China
- Languages at home
- 94% English-only · Spanish 3% Chinese 1%
Political lean MEDSL · Scotland
- 2024 margin
- Lean R (+6.9) · D 46.2% · R 53.1%
- 2008→2024 swing
- -22.0pp toward R · 2008: 15.1pp · 2024: -6.9pp
- All cycles
- 2024: R+6.9 2020: R+1.9 2016: D+7.8 2012: D+16.6 2008: D+15.1
Not yet ingested
- Civics
- —
Market trends
- HPI YoY
- ▼ -9.08%
- Current HPI
- 255.331
- Rent YoY
- —
- Metro
- —
- State GDP YoY
- ▲ 3.28%
- F500 in state
- 26
Industry mix (Fortune 500 HQ in NC)
| Industry | F500 HQs | Revenue |
|---|---|---|
| Financial Services | 2 | $213B |
|
||
| Retail | 2 | $95B |
|
||
| Industrial Conglomerate | 1 | $38B |
|
||
| Metals / Steel | 1 | $35B |
|
||
| Utilities | 1 | $30B |
|
||
| Industrial Machinery | 1 | $19B |
|
||
Price history
+100.0% since first listed4 events — show timeline
- 2026-06-13 Listed $40,000 LPRMLS
- 2025-01-13 Sold (MLS) $20,000 TMLS
- 2024-12-31 Pending — TMLS
- 2024-12-17 Listed $20,000 TMLS
Property tax history
+1.3%/yrLatest (2025): $304 · +0.0% YoY. Source: county tax records.
Cash-flow waterfall
monthlySold comps — $/sqft
last 12 mo · ≤1 miLoading sold comps…