 🏗️ New Construction
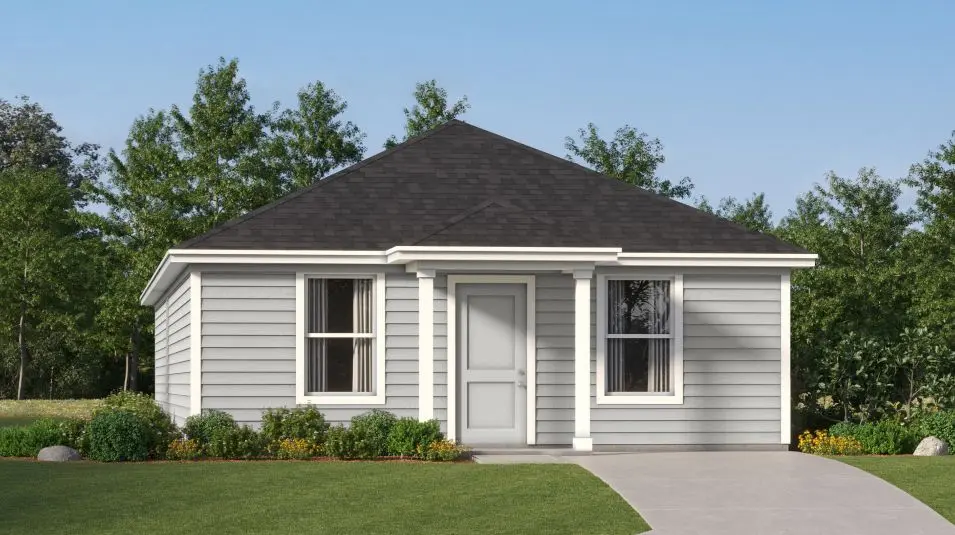
Timms Plan · Converse, TX
Flood risk No data
- FEMA flood zone
- —
- Chance of flooding over 30 yrs
- —
- Est. flood insurance / yr
- —
Fire risk No data
- Est. fire insurance / yr
- —
Heat risk No data
- Hot days now (above threshold)
- —
- Hot days in 30 yrs
- —
Wind risk No data
- Chance of severe wind over 30 yrs
- —
Air-quality risk No data
- Unhealthy air days now
- —
- Unhealthy air days in 30 yrs
- —
Risk factors via First Street. Map © Google.
Why this score? — see what drove the D grade
The composite is a weighted blend of 9 inputs, each scored 0–100. Each bar is that input's sub-score; the figure is the points it added to the 100-point composite (weight × sub-score).
- Cash flow +13.8/30.0
- ARV discount +7.5/15.0
- DSCR +4.2/10.0
- Condition / age +4.0/5.0
- 1% rule +3.9/10.0
- Livability +3.3/5.0
- Rent growth +2.2/5.0
- Schools +1.9/10.0
- Appreciation +0.0/10.0
$188,049
🖨 Deal sheet 📄 Offer letter ✓ Due diligence
Listing remarks MLS
This new single-level home features a modern and low-maintenance design. Three bedrooms can be found off the foyer, leading to an open-concept floorplan that combines the kitchen, living and dining areas. The luxe owner's suite is tucked into a private rear corner, complete with an en-suite bathroom and walk-in closet.
Key facts
- Walk-in closet
- En-suite bathroom
- Listed 350 days
Tags
Neighborhood map
What this means for you Summary
Snapshot
- This is a 4-bed/2.0-bath single-family listed at $188k. Condition is rated good.
Deal economics
- At list price, monthly cash flow is $19 ($229/yr) — positive.
- The deal already cash-flows at list — no discount required.
- Meets the 1% rule at list price ($2k rent vs $188k).
- Recommended offer: $165k (12.0% below list) — sets the bar for market timing.
- Cap rate 6.4% vs local median 4.4% in Converse — top-decile yield for the area; either an underpriced asset or a hidden risk that comps aren't pricing in. Stress-test before assuming the spread holds.
Location & tenants
- Location reads 66/100 on livability (#649 in TX) — a middle-class / working-renter tenant base. Strengths: cost of living A+, housing A+, employment B; Watch: schools C-, crime C-, amenities F.
- East Central ISD (rural): math 16% / reading 25% proficiency, ranked #758 of 826 in TX (top 92%) — low school quality limits family demand, transient renter base, plan for 1-2y turnover; 61% free/reduced lunch — lower-income household profile, screen leases tightly.
- Market conditions: Rents soft (-1.1%/yr); 1152 active listings in the ZIP; 32 comparable units currently listed for rent nearby; rentals at typical pace (median 24d on market — plan ~3-4 weeks tenant-placement turnaround); solid renter incomes; 8,308 units permitted in Bexar County in 2024 (2,506 in 5+ unit buildings).
Forward outlook
- Local home prices are declining (-3.0%/yr); year-one equity from $1k of loan paydown is wiped out by about $6k of value loss. Plan a longer hold.
- Bexar County population projected at +50% by 2050 — long-run rental-demand tailwind backs the buy-and-hold thesis.
Negotiation context
- It's been on market 350 days — a 12% lower offer ($165k) is reasonable based on typical stale-listing flexibility.
Questions for the listing agent
- It's been on market 350 days. Have you received any prior offers? Is the seller open to a 12% concession, seller financing, or rate buy-down credit?
- Why hasn't it sold? Are there any deal-killer items the seller is aware of (foundation, flood, title, zoning, code violations)?
- Is there a deadline driving the sale (1031 exchange, divorce, estate, relocation)? That informs how much negotiation room exists.
- The area grade is low — what's the realistic commute time and amenity access for the typical tenant pool here? Any planned neighborhood developments (good or bad) we should know about?
- What's the average days-on-market for RENTAL listings here right now (not sales)? A rising rental-DOM trend means longer vacancies and softer asking-rent achievability than the comps imply.
- What's the recent tenant-quality profile in this submarket — average credit score on applications, eviction rate, late-payment / NSF rate, and stable-employment percentage? A property-management company in the area should have these aggregated.
- How much new for-sale + rental construction is in the pipeline within 1–3 miles? Heavy new supply typically softens prices + rents 12–24 months out; constrained supply supports both.
Investment metrics
- 1% rule
- 0.89% ✗
- Cap rate
- 6.40%
- Cash-on-cash
- 0.38%
- DSCR
- 1.02
- GRM
- 9.4
CMA / ARV
- ARV (median comp)
- $215,336
- List price
- $188,049
- Delta
- -12.67%
- Verdict
- UNDERPRICED
- Comps
- 20 within 1.0 mi
Show comp detail 12 sales within ~0.75 mi
| Address | Dist | Beds/Ba | Sqft | Sold | Price | $/sf | Match |
|---|---|---|---|---|---|---|---|
| 11545 Cinnamon Rose | 0.27mi | 4/2.0 | 1,500 (0%) | 2mo | $169,999 | $113 | 86 |
| 11537 Chestnut Rose | 0.24mi | 4/2.0 | 1,500 (0%) | 5mo | $185,499 | $124 | 85 |
| 11525 Cinnamon Rose | 0.29mi | 4/2.0 | 1,483 (-1%) | 2mo | $208,999 | $141 | 83 |
| 11553 Cinnamon Rose | 0.26mi | 3/2.0 (-1) | 1,380 (-8%) | 1mo | $164,999 | $120 | 69 |
| 11711 Evergreen Rose | 0.21mi | 4/3.0 | 1,657 (+10%) | 2mo | $227,999 | $138 | 67 |
| 11639 Evergreen Rose | 0.21mi | 4/3.0 | 1,657 (+10%) | 2mo | $236,999 | $143 | 67 |
| 11723 Evergreen Rose | 0.27mi | 4/3.0 | 1,657 (+10%) | 1mo | $236,999 | $143 | 65 |
| 11533 Cinnamon Rose | 0.28mi | 3/2.0 (-1) | 1,354 (-10%) | 2mo | $196,999 | $145 | 64 |
| 11513 Cinnamon Rose | 0.31mi | 3/2.0 (-1) | 1,354 (-10%) | 2mo | $198,999 | $147 | 63 |
| 11541 Cinnamon Rose | 0.27mi | 4/2.5 | 1,692 (+13%) | 1mo | $224,999 | $133 | 63 |
| 11516 Chestnut Rose | 0.28mi | 3/2.0 (-1) | 1,354 (-10%) | 7mo | $225,999 | $167 | 60 |
| 2207 Camellia Rose | 0.35mi | 4/2.5 | 1,692 (+13%) | 2mo | $218,999 | $129 | 59 |
Match score weights: distance 35% · size 25% · config 20% · recency 20%. Top-matched comps best support the ARV.
Projected returns pro-forma
-3.0% appreciation · 0.0% rent growth · sell at horizon
- IRR
- -19.1%
- Equity multiple
- 0.35×
- Total profit
- $-39,242
- Equity at exit
- $32,107
- IRR
- -19.5%
- Equity multiple
- 0.10×
- Total profit
- $-54,098
- Equity at exit
- $18,618
Cash invested: $60,294 (down + closing). Projections, not guarantees.
Landlord ↔ Tenant lean methodology
- Overall (STATE)
- 87 Strongly Landlord-Friendly
- State Texas
- 87 Strongly Landlord-Friendly · R+5
- County
- — inherits STATE
- City
- — inherits STATE
ZIP-level market 78109
- Home prices YoY
- -17.8%
- Rents YoY
- -1.1%
- Active inventory
- 1152
- Price-to-rent
- 8.2×
Monthly cashflow live
- Estimated rent
- $1,908 high interval (Pro) →
- Mortgage (P&I)
- −$1,129
- Tax est. 1.5%
- −$269 /mo · $3,230/yr
- Insurance
- −$90
- HOA
- −$0
- Vacancy / Maint / Mgmt
- −$401
- Net cashflow
- $19
Break-even live
UW: 25.0% down · 7.5% · 30yr · 1.5% tax · 5.0% vac · 8.0% maint · 8.0% mgmt
Financing live
Cash to close
- Down payment
- $53,834
- Closing costs
- $6,460
- Reserves months
- —
- Total cash needed
- —
Loan-product check · same deal, 3 products live
Conventional
25% down · 7.5% · 30yr
- Down + closing
- —
- Monthly P&I
- —
- Monthly cashflow
- —
- DSCR
- —
- Eligible?
- —
Personal DTI + credit; lowest rate.
DSCR
20% down · 8.5% · 30yr
- Down + closing
- —
- Monthly P&I
- —
- Monthly cashflow
- —
- DSCR
- —
- Eligible?
- —
No personal income docs; deal must DSCR.
Hard money
10% down · 12.0% · 12mo
- Down + closing
- —
- Monthly P&I
- —
- Monthly cashflow
- —
- DSCR
- —
- Eligible?
- —
Short-term bridge; refi at stabilization.
Rent comps 32 comps
| Address | Beds | Baths | Sqft | Rent | $/sqft | DOM | Units | Dist |
|---|---|---|---|---|---|---|---|---|
| 11602 Dog Rose Converse, TX | 3.0 | 2.0 | 1354 | $1,650 | $1.22 | 23d | 1 | 0.22mi |
| 4611 E 1604 N Converse, TX | 2.0–4.0 | 2.0 | 1112 | $1,499 | $1.35 | 1d | 1 | 0.89mi |
| 11151 Hollinger Cir Converse, TX | 4.0 | 2.5 | 1859 | $1,705 | $0.92 | 23d | 1 | 0.92mi |
| 11130 Hollinger Cir Converse, TX | 3.0 | 2.5 | 1689 | $1,950 | $1.15 | 1d | 1 | 0.95mi |
| 11130 Hollinger Cir Converse, TX | 3.0 | 2.5 | 1709 | $1,950 | $1.14 | 21d | 1 | 0.95mi |
| 3106 Drayton Ests Converse, TX | 2.0–5.0 | 2.0–3.5 | 1733 | $2,293 | $1.32 | 1d | 1 | 1.04mi |
| 11050 Eyelet Hbr Converse, TX | 4.0 | 2.5 | 2205 | $1,875 | $0.85 | 43d | 1 | 1.06mi |
| 11046 Eyelet Hbr Converse, TX | 3.0 | 2.0 | 1525 | $1,750 | $1.15 | 23d | 1 | 1.07mi |
| 11038 Chatham Ct Converse, TX | 4.0 | 2.5 | 2205 | $1,995 | $0.90 | 12d | 1 | 1.08mi |
| 2822 Praline Fry Converse, TX | 3.0 | 2.0 | 1525 | $1,645 | $1.08 | 2d | 1 | 1.11mi |
| 2810 Praline Fry Converse, TX | 4.0 | 2.5 | 2204 | $1,745 | $0.79 | 43d | 1 | 1.12mi |
| 11019 Chatham Ct Converse, TX | 3.0 | 2.5 | 1428 | $1,425 | $1.00 | 43d | 1 | 1.13mi |
| 11002 Eyelet Hbr Converse, TX | 4.0 | 2.5 | 2204 | $1,745 | $0.79 | 43d | 1 | 1.14mi |
| 2826 Tybee Crk Converse, TX | 4.0 | 2.5 | 2204 | $1,830 | $0.83 | 4d | 1 | 1.16mi |
| 3006 Citron Gdn Converse, TX | 4.0 | 2.5 | 2198 | $1,950 | $0.89 | 3d | 1 | 1.17mi |
| 11030 Yonder Flts Converse, TX | 3.0 | 2.5 | 1428 | $1,500 | $1.05 | 4d | 1 | 1.17mi |
| 11026 Yonder Flts Converse, TX | 3.0 | 2.0 | 1525 | $1,645 | $1.08 | 3d | 1 | 1.18mi |
| 10922 Chatham Ct Converse, TX | 3.0 | 2.0 | 1525 | $1,645 | $1.08 | 23d | 1 | 1.22mi |
| 2939 Gastonian Ml Converse, TX | 3.0 | 2.0 | 1525 | $1,495 | $0.98 | 43d | 1 | 1.25mi |
| 2927 Gastonian Ml Converse, TX | 4.0 | 2.5 | 2205 | $1,850 | $0.84 | 1d | 1 | 1.26mi |
| 10950 Chippewa Trce Converse, TX | 4.0 | 2.5 | 2205 | $1,800 | $0.82 | 23d | 1 | 1.27mi |
| 10930 Juliette Pass Converse, TX | 4.0 | 2.5 | 2205 | $1,850 | $0.84 | 2d | 1 | 1.28mi |
| 10819 Juliette Pass Converse, TX | 4.0 | 2.5 | 2204 | $1,745 | $0.79 | 43d | 1 | 1.38mi |
| 2943 Forsyth Cyn Converse, TX | 4.0 | 2.5 | 2203 | $1,795 | $0.81 | 23d | 1 | 1.39mi |
| 2815 Armaan WAY Converse, TX | 3.0 | 2.5 | 1401 | $1,495 | $1.07 | 1d | 1 | 1.40mi |
| 3026 Jackson Smt Converse, TX | 4.0 | 2.5 | 2204 | $1,745 | $0.79 | 43d | 1 | 1.41mi |
| 2942 Jackson Smt Converse, TX | 4.0 | 2.5 | 2204 | $1,745 | $0.79 | 43d | 1 | 1.41mi |
| 2934 Jackson Smt Converse, TX | 4.0 | 2.5 | 2204 | $2,070 | $0.94 | 43d | 1 | 1.42mi |
| 3130 Jackson Smt Converse, TX | 3.0 | 2.5 | 1428 | $1,885 | $1.32 | 4d | 1 | 1.42mi |
| 3158 Jackson Smt Converse, TX | 4.0 | 2.5 | 2205 | $1,895 | $0.86 | 1d | 1 | 1.43mi |
| 3055 Jackson Smt Converse, TX | 3.0 | 2.0 | 1525 | $1,595 | $1.05 | 43d | 1 | 1.44mi |
| 3318 Carducci Dr Converse, TX | 3.0 | 2.0 | 1276 | $1,800 | $1.41 | 43d | 1 | 1.48mi |
Listing history 17 events
-
2026-06-18days on market $188,049 Active 350 DOM
-
2026-06-17days on market $188,049 Active 349 DOM
-
2026-06-16days on market $188,049 Active 348 DOM
-
2026-06-15pricedays on market $188,049 Active 347 DOM
-
2026-06-13pricedays on market $187,349 Active 345 DOM
-
2026-06-09days on market $186,999 Active 341 DOM
-
2026-06-08days on market $186,999 Active 340 DOM
-
2026-06-07days on market $186,999 Active 339 DOM
-
2026-06-04days on market $186,999 Active 336 DOM
-
2026-06-03days on market $186,999 Active 335 DOM
-
2026-06-02days on market $186,999 Active 334 DOM
-
2026-06-01days on market $186,999 Active 333 DOM
-
2026-05-31days on market $186,999 Active 332 DOM
-
2026-02-13price $186,999 320-char remark
Show marketing remark (320 chars)
This new single-level home features a modern and low-maintenance design. Three bedrooms can be found off the foyer, leading to an open-concept floorplan that combines the kitchen, living and dining areas. The luxe owner's suite is tucked into a private rear corner, complete with an en-suite bathroom and walk-in closet.
-
2025-11-17price $197,499 320-char remark
Show marketing remark (320 chars)
This new single-level home features a modern and low-maintenance design. Three bedrooms can be found off the foyer, leading to an open-concept floorplan that combines the kitchen, living and dining areas. The luxe owner's suite is tucked into a private rear corner, complete with an en-suite bathroom and walk-in closet.
-
2025-09-01price $202,499 320-char remark
Show marketing remark (320 chars)
This new single-level home features a modern and low-maintenance design. Three bedrooms can be found off the foyer, leading to an open-concept floorplan that combines the kitchen, living and dining areas. The luxe owner's suite is tucked into a private rear corner, complete with an en-suite bathroom and walk-in closet.
-
2025-07-03$209,499 Active 320-char remark
Show marketing remark (320 chars)
This new single-level home features a modern and low-maintenance design. Three bedrooms can be found off the foyer, leading to an open-concept floorplan that combines the kitchen, living and dining areas. The luxe owner's suite is tucked into a private rear corner, complete with an en-suite bathroom and walk-in closet.
ⓘ Source: listings_history table (triggers on properties + properties_extension) + one-shot
backfill from property_details.listing_events for pre-trigger history.
Nearby sold comps map
Loading sold comps map…
Walkable amenities ~0.75 mi
Loading nearby amenities…
Taxation est. · year 1
- Rental income
- $22,894
- − Mortgage interest
- −$12,062
- − Property taxes
- −$3,230
- − Insurance
- −$1,077
- − Repairs & maintenance
- −$1,832
- − Management
- −$1,832
- − Depreciation
- −$6,264
- Taxable loss
- −$3,402
- Est. tax savings @ 24.0%
- +$816
- After-tax cash flow
- $1,045/yr
For passive investors: Depreciation is non-cash, so a rental often shows a tax loss while cash-flowing — sheltering income. Rental losses are passive: they offset passive income freely, and up to $25,000/yr can offset ordinary (W-2) income if you actively participate and your MAGI is under $100k (phasing out to $0 by $150k); unused losses carry forward. On sale, claimed depreciation is recaptured at up to 25%, and gains may owe capital-gains tax (a 1031 exchange can defer both). Figures are a year-1 estimate at your 24.0% rate — not tax advice; consult a CPA.
Condition & rehab AI · 12 photos
This single-family home is in good condition with a modern and low-maintenance design. It offers a good balance of updates and maintenance, making it a solid investment opportunity.
Value-add opportunities
- Both Painting the exterior siding — Fresh paint can enhance curb appeal and property value.
- Both Landscaping improvements — Enhanced landscaping can increase both resale and rental value.
- Both Adding smart home features — Smart home features can increase both resale and rental value by making the home more modern and convenient.
Renovation cost estimate screening
Value-add ROI direction
- Both Painting the exterior siding — Fresh paint can enhance curb appeal and property value. ↑
- Both Landscaping improvements — Enhanced landscaping can increase both resale and rental value. ↑
- Both Adding smart home features — Smart home features can increase both resale and rental value by making the home more modern and convenient. ↑
ⓘ Cost ranges are severity-bucket heuristics (US national rule-of-thumb). Get contractor quotes + a written scope before underwriting a rehab budget.
Schools (NCES district)
- District
- East Central ISD
- NCES district ID
- 4817850
- Math proficiency
- 16% ▼ -12.00%
- Reading proficiency
- 25% ▼ -6.00%
- Median HH income
- $53,941
- Composite
- 18.67/100
- National rank
- #8887
- State rank
- #758 of 826 in TX
Livability — Converse
- Score
- 66/100
- State rank
- #649
- US rank
- #12250
Category grades
Schools grade is shown separately in the Schools card above.
Census & demographics
- County
- Bexar County · 1,990,555 people
- City population
- 1,806,925
- Metro
- San Antonio-New Braunfels, TX
- Population (ZIP)
- 63,067
- Household income
- $91,320
- Rent vs Own
- Severe rent burden
- 1732.0
Population outlook (Bexar County) Hauer SSP2
- Today (2025)
- 2,336,851 people
- By 2030
- 2,560,728 · +9.6%
- By 2040
- 3,020,569 · +29.3%
- By 2050
- 3,493,522 · +49.5%
- By 2075
- 4,668,459 · +99.8%
- By 2100
- 5,533,242 · +136.8%
Race, ethnicity, and origin ACS 2023
- Neighborhood character
- Diverse neighborhood (Simpson 0.69)
- Race & ethnicity
- Hispanic / Latino 44% White 27% Two or more races 21% Black 21% Asian 3%
- Hispanic origin (detail)
- Mexican 29% Puerto Rican 4%
- Common ancestry
- Lithuanian 1% Romanian 1% Italian 1%
- Foreign-born
- 11% · Canada, Vietnam, South Korea
- Languages at home
- 71% English-only · Spanish 23% Tagalog/Filipino 1% Other Asian/Pacific 1%
Political lean MEDSL · Bexar
- 2024 margin
- Lean D (+9.8) · D 54.3% · R 44.6% · Other 1.1%
- 2008→2024 swing
- +4.2pp toward D · 2008: 5.6pp · 2024: 9.8pp
- All cycles
- 2024: D+9.8 2020: D+18.2 2016: D+13.5 2012: D+4.6 2008: D+5.6
Not yet ingested
- Civics
- —
Market trends
- HPI YoY
- ▼ -51.02%
- Current HPI
- 236.4923
- Rent YoY
- ▼ -1.08%
- Metro
- San Antonio-New Braunfels, TX
- State GDP YoY
- ▲ 3.95%
- F500 in state
- 110
Industry mix (Fortune 500 HQ in TX)
| Industry | F500 HQs | Revenue |
|---|---|---|
| Energy | 16 | $1,198B |
|
||
| Technology | 5 | $198B |
|
||
| Engineering / Construction | 4 | $72B |
|
||
| Energy Services | 3 | $60B |
|
||
| Utilities | 3 | $41B |
|
||
| Healthcare | 2 | $330B |
|
||
Price history
-10.7% since first listed4 events — show timeline
- 2026-02-13 Price Changed $186,999 Zillow
- 2025-11-17 Price Changed $197,499 Zillow
- 2025-09-01 Price Changed $202,499 Zillow
- 2025-07-03 Listed $209,499 Zillow
Cash-flow waterfall
monthlySold comps — $/sqft
last 12 mo · ≤1 miLoading sold comps…